
 ?Mathematical formulae have been encoded as MathML and are displayed in this HTML version using MathJax in order to improve their display. Uncheck the box to turn MathJax off. This feature requires Javascript. Click on a formula to zoom.
Abstract
Background
Previous studies in our laboratory demonstrated that a synthetic peptide containing lung surfactant enhances the permeability of chemical compounds through bronchial epithelium. The purpose of this study was to test two formulations of Synsurf® combined with linezolid as respirable compounds using a pressurized metered dose inhaler (pMDI).
Methods
Aerosolization efficiency of the surfactant-drug microparticles onto Calu-3 monolayers as an air interface culture was analyzed using a Next Generation Impactor™.
Results
The delivered particles and drug dose showed a high dependency from the preparation that was aerosolized. Scanning electron microscopy imaging allowed for visualization of the deposited particles, establishing them as liposomal-type structures (diameter 500 nm to 2 μm) with filamentous features.
Conclusion
The different surfactant drug combinations allow for an evaluation of the significance of the experimental model system, as well as assessment of the formulations providing a possible noninvasive, site-specific, delivery model via pMDI.
Introduction
Considerable effort has been invested in generating aerosols for pulmonary delivery over the last 10 years. In this regard, administering clinically relevant dosages of inhaled drug and control of lung-regional distribution thereof has proven to be challenging. The principle aim of inhalation of drugs for pulmonary disease therapy is to increase the local drug concentration and avoid systemic toxicity of the said compounds.Citation1 However, lung is a complex organ that is regulated by multiple factors such as the structure of the epithelia, the physicochemical properties of the drug as well as the type of delivery system used. Although improved drug deposition remains an important aim, enhanced therapeutic effects does not necessarily follow. Studies of drug deposition and transport in vitro may reveal the fate of deposited particles on respiratory epithelia, which may allow for better understanding of similar happenings in vivo.Citation2 Human bronchial adenocarcinoma, Calu-3 cell line, due to its simple reproducible process and similarity to in vivo physiology, has become the alternative investigatory model for the in vitro study of proximal airway respiratory exposure to better understand the determinants that influences pulmonary drug dissolution, absorption, metabolism, and efficacy.Citation3,Citation4
Aerosolized antibiotic formulations and novel delivery systems for the treatment of cystic fibrosis, pneumocystis pneumonia, or pulmonary tuberculosis may overcome the time burden of therapy and improve clinical outcomes due to increased patient complience.Citation5 Furthermore, pMDIs provide patients with a versatile, reliable, instantly available, self-contained, portable, low-cost medical aerosol delivery system.Citation6 The encapsulation of antibiotics in liposomes is another novel concept regarding aerosolized drug delivery as revealed by Meers et al.Citation7 They demonstrated the targeted pulmonary delivery of amikacin via liposomal encapsulation-enhanced antibiotic penetration of mucus and biofilm on the surface of the epithelium.Citation7 Although various drugs have been tested in combination with lipid particles, the synthetic lung surfactant Alveofact® was the first liposomal product to reach the market in 15–20 years.Citation8
From a drug delivery perspective, the objective of this study was to investigate whether the use of two formulations of the pulmonary surfactant Synsurf®, combined with linezolid, is suitable as carrier, drug delivery, and permeation agent for inhalation. Although the idea to use lung surfactant as a carrier agent was proposed several years ago with a tobramycin–surfactant mixture, we have shown in our previous studies that Synsurf enhances the permeability of drugs such as 17β-estradiol, hydrocortisone, dexamethasone, zidovudine, and isoniazid across porcine bronchial tissue.Citation9 This new synthetic pulmonary surfactant contains the amphipathic phospholipid dipalmitoylphosphatidylcholine (DPPC), surface-active phosphatidylglycerol, as well as 1-hexadecanol, tyloxapol, and a polymer peptide complex of poly-l-lysine and poly-l-glutamic acid. It is an entirely synthetic pulmonary surfactant containing peptides that mimic the action of naturally occurring surfactant proteins SP-B/C and avoids the potential risk of animal-derived pathogen transmission.Citation10 Its efficacy proved to be similar to that of the commercially available naturally derived surfactants, that is, Curosurf®, in a preterm lamb model.Citation11
The aim of this study was therefore to test linezolid combined with Synsurf in a pressurized metered dose inhaler (pMDI) by using a Calu-3 cell line as target model. To our knowledge, this is an unexplored area with the drug.
Materials and methods
Reagents and standards
High-performance liquid chromatography (HPLC) grade acetonitrile (Romil, Cambridge, UK), MilliQ water (EMD Millipore, Billerica, MA, USA), and ammonium acetate (Analytical; EMD Millipore, Billerica, MA, USA) were used in the mobile phase. The rest of the analyte standards and linezolid were supplied by Sigma-Aldrich Co. (St Louis, MO, USA).
Culture of Calu-3 cells
The Calu-3 cell line (ATCC® HTB-55™) (passage 33–36) was first cultured as a polarized liquid-covered culture in 75 cm2 flasks and maintained in a humidified, 5% CO2, 95% atmospheric air incubator at 37°C before subcultured in 12 cm diameter Corning® Costar® Transwell® inserts (0.33 cm2 polyester, 0.4 μm pore size) from Sigma-Aldrich Co. The culture medium was composed of Dulbecco’s Modified Eagle’s Medium supplemented with 10% fetal calf serum, 1% nonessential amino acid solution (×100), 1% l-glutamine solution (200 mM), and 1% penicillin-streptomycin.
Cells cultured on Transwell supports were seeded at a density of 5×10⁵ cells/cm2 and were introduced into the apical surface of the Transwell support in 0.2 mL medium with 2 mL medium added to the basolateral chamber. The cells were incubated at 37°C, 5% CO2 for 24 hours. For air–liquid interface (ALI) culture, the cell culture medium was removed on day 2 post-seeding. The cell layers were evaluated through light microscopy with a Nikon TMS Inverted Phase Contrast Microscope (Nikon Corporation, Tokyo, Japan). Trans-epithelial electrical resistance (TEER) was measured using an EVOM2 chopstick electrode and EVOM2 Epithelial Volt/Ohm meter (World Precision Instruments, Sarasota, FL, USA). TEER can only be measured through liquid; therefore, pre-warmed medium (0.2 mL, 37°C) was added to the apical chambers and returned to the incubator to equilibrate for a further 30 min before evaluation as to avoid any disturbed epithelial electrical resistance readings. TEER was calculated by subtracting the resistance of a cell-free culture insert with correction for the surface area of the Transwell cell culture support. When the TEER had reached a value of >700 Ω cm2 in submersed culture, it was considered confluent. In ALI culture, the medium (1.5 mL) in the basolateral compartment was changed every 2–3 days. 0.2 and 1.5 mL media were added to the apical and the basolateral compartment, respectively, for TEER measurements.
TEER values were calculated as follows:
Cell surface staining
Alcian blue staining was employed for the detection of glycoproteins at day 1, day 7, and day 14 post seeding at ALI. Cell layers were washed twice with 100 mL Hanks’ balanced salt solution (HBSS) and fixed for 10 min by using 2.5% (v/v) glutaraldehyde in 0.1 M sodium cacodylate buffer. The cells were washed again with HBSS and 100 mL alcian blue stain (1% [w/v] alcian blue in 3% [v/v] acetic acid/water at pH 2.5) was added for 1 hour. The dye was then removed and the cell layer washed with HBSS until the rinsate ran clear (images not included).
Surfactant preparations
Two synthetic surfactant preparations were used in the study: 1) Synsurf prepared as described previously by van Zyl et alCitation13 (prep 1) and 2) Synsurf formulated with the addition of 2 wt% cholesterol (prep 2). Both the formulations were then freeze-dried for further use in the pMDI.
Synsurf® pMDIs
Canisters were filled with a 1:1 ratio of linezolid to Synsurf (prep 1 and 2) to yield a final concentration of 200 μg. Hydro-fluoroalkane propellant (Mexichem-Fluor, Runcorn, UK) was added, and the canisters were sealed with a Pamasol Manual Crimper and Filler (DH Industries, Essex, UK). Three canisters were conveyed as: L = linezolid alone, LP1 = linezolid + Synsurf prep 1, and LP2 = linezolid + Synsurf prep 2. A total of five actuations were studied per experiment.
Scanning electron microscopy (SEM), cell surface morphology, and pMDI drug deposition
The fixative solution, 2.5% glutaraldehyde and 0.5 g potassium ferrocyanide dissolved in 50 mL of normal strength culture media (without serum), was added to the basolateral chambers of the Transwell plates post pMDI actuation. The fixative was not added to the apical layer as to avoid possible “emulsion” of surfactant and/or linezolid. Rather, the plates were covered within a glass dome with fixative solution in neighboring wells for 2 hours allowing the apical side to be fixed via gaseous means. Cells were then washed with serum-free media and post-fixed with 1% osmium tetroxide + 1% potassium ferrocyanide for 1 hour at room temperature on the apical and basolateral sides. Cells were washed twice with distilled water over 15 min. The membranes were carefully cut out of the Transwell inserts and placed in small glass vials and stained with 2% aqueous uranyl acetate for 1 hour in the dark. Membranes were further washed with acetone 50%, 70%, and 90% each once over 10 min and then twice with 100% acetone, followed by one 15-minute wash with an equal mix of acetone and hexamethyldisilazane (HMDS) and then two final 15-minute washes with HMDS. Acetone was chosen as a preferable dehydrating agent as it may cause less shrinkage of the samples than ethanol, and it is not reactive with any 0s04 that may remain in the samples. HMDS was used as a chemical alternative to critical point drying (CPD) method due to its ease of use, relative quickness, and affordability. It also dehydrates without compromising the underlying structures and avoids the turbulence created by CPD when considering gentle structures.Citation14
Membranes were left partially covered overnight and subsequently sputter coated with gold to achieve a thickness of ~20 nm (Edwards Sputter Coater S150B; Edwards High Vacuum, Sussex, UK). Imaging was performed using a SEM (JOEL SEM6480LV system, Tokyo, Japan).
In vitro aerosol deposition studies using a next generation impactor (NGI) device and dissolution analysis
A multistage cascade Next Generation Impactor™ (NGI™; Copley Scientific, Nottingham, UK) was used for testing metered-dose inhalers. The impaction plates of the NGI were modified to accommodate six Transwells at three stages. This allowed the study of different particle size fractions. The loaded device was connected to the throat (induction port) of the NGI via a molded silicone mouthpiece. Testing was performed at 60 L/min flow rate with a 5-second exposure after each actuation. A dissolution assay of samples in the basolateral Transwell was performed upon each actuation (n=2). Samples were vortexed for 30 seconds with HBSS buffer (Sigma-Aldrich Co.), containing HEPES (10 mM) and a 0.025% Tween and then centrifuged for 10 min at 3,000 rpm. Supernatants (±1 mL) were then transferred to HPLC vials. At the end of the experiment, the surface of the Calu-3 cells were washed with buffer and collected for the analysis of residual apical drug. This allowed for the calculation of total drug deposited via the cumulative sum of all samples.
Analyses of linezolid by liquid chromatography–mass spectrometry (LC-MS)
A Waters Synapt G2 quadrupole time-of-flight mass spectrometer (Waters Corporation, Milford, MA, USA), fitted with a Waters Acquity UPLC and photo diode array (PDA) detector was used for LC-MS analyses. Separation was achieved on a Waters BEH Amide UPLC column (2.1×100 mm, 1.7 μm) at a temperature of 35°C. Solvent A consisted of 10 mM ammonium acetate in water, solvent B consisted of 10 mM ammonium acetate in 95% acetonitrile. The gradient consisted of a flow rate 0.25 mL/min, starting with 95% B to 40% B over 9 min, applying gradient curve over 7 min, followed by re-equilibration to initial conditions over 5 min. Electrospray ionization was applied in the negative mode, using a capillary voltage of 2.5 kV, a cone voltage of 15 V, desolvation temperature of 250°C and desolvation gas (N2) flow of 650 L/h. The rest of the MS settings were optimized for best sensitivity. Data were acquired in MSE mode, consisting of a scan using a low collision energy and a scan using a collision energy ramp from 25 to 60 V, which has the added advantage of acquiring low energy molecular ion data as well as fragmentation data for all analytes over time. Data were collected using a scan rate of 0.2 seconds over the range m/z 100–1,000. Leucine enkaphalin was used as lock mass for accurate mass determination on the fly with a lock mass flow rate of 0.002 mL/min, acquiring lock mass data every 20 seconds. Sodium formate was used to calibrate the instrument. The PDA detector was set to scan over the range 220–450 nm.
Drug permeability
The transport of compounds across Calu-3 cells is typically expressed in terms of the apparent permeability coefficient (Papp) measured in the absorptive apical to basolateral (Ap-Bl) direction and was calculated according to EquationEquation 1(1) :
Surface tension and interfacial rheology experiments
Surface tension behavior of four different preparations, namely Synsurf, Synsurf + linezolid (prep 1), Synsurf + cholesterol, and Synsurf + cholesterol + linezolid (prep 2), was systematically examined using pendant and pulsating drop configurations at the ALI. Sample concentration of test preparations was as follows: Synsurf 90 μg, cholesterol 2% by weight, linezolid 90 μg. A computer controlled One Attension Theta Optical Tensiometer (Biolin Scientific, Manchester, UK) was used for these experiments. A 15 μL droplet of each preparation was tested at 25°C for its surface tension lowering effect over 60 seconds with the pendant drop module of the instrument. Sequential data images of the suspended droplet were collected by the camera at a rate of one image per second (~2,000 data points). For each preparation, five drops were tested. Dilatational visco-elastic properties of Synsurf preparations were analyzed at 37°C. A 15 μL surfactant bubble was subjected to oscillation frequencies between 0.25 and 6 Hz (sine waveform; 10 oscillations/frequency; amplitude 1). Experiments done are representative of seven repeats for each preparation.
Statistical analysis
All the results are expressed as mean ± standard deviation of at least two replicate experiments. Data were analyzed by GraphPad Prism, Version 5, statistical software package (GraphPad Software, Inc., La Jolla, CA, USA). One-way analysis of variance (ANOVA, with Tukey’s post hoc analysis) was used to test for significance between the treatment groups. The confidence interval (CI) of 95% was also calculated based on the mean, and significant difference was accepted at P-values of ≤0.05.
Results
Transepithelial resistance
Calu-3 cells were grown at the air interface to allow mono-layer differentiation, and experiments were performed between days 11 and 14 when TEER reached values between 750 and 1,000 Ω cm2. These conditions have previously been established by Haghi et al.Citation15 After the high TEER was determined and thus the presence of tight junction proteins was confirmed, the surface properties of Calu-3 cells were studied by SEM pre- and post-pMDI impactor actuation.
Transepithelial drug transport
The average particle size (D50) for the NGI stages was established as follows: stage 2: 4.46 μm; stage 3: 2.82 μm; and stage 4: 1.66 μm at a flow rate of 60 L/min.Citation16 Uptake and transport experiments with linezolid were performed 14 days after seeding and trans-epithelial flux measurements were performed as well as total trans-epithelial drug transported and cellular uptake were calculated.
Apparent permeability for the three separate preparations in the absorptive direction (apical-to-basal) were determined for 240 min (after a 20-minute preincubation to establish a state of linear flux). Fluxes are expressed as ng/mm2/min. The passive (paracellular) route across the epithelium was estimated by repeated linezolid flux determinations that indicated steady-state diffusion.
Since these parameters are difficult to control, that is, the amount of recovered sample (start concentration in apical compartment, volume and the amount of samples within each NGI chamber), the initial compound concentration (C0) in the donor chamber was established at the end of each uptake experiment (4 hours). The total amount of linezolid collected from the basal compartment and the drug remaining on the cell surface and inside the cells were summed to represent total deposited mass.Citation17
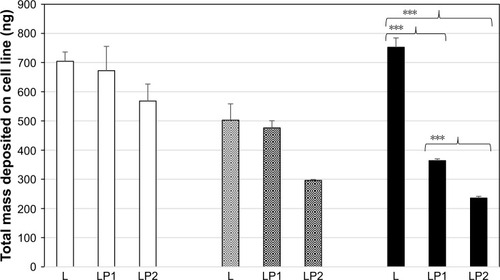
displays the total drug masses deposited on Calu-3 cell monolayer. One-way analysis of variance showed that the amounts of L deposited in the single preparation and in combination preparations (LP1 and LP2) were similar in stages 2 and 3. However, significant differences in deposited mass were found in stage 4 for L (452.50±32.01 ng) versus LP1 (363.96±6.18 ng) and L versus LP2 (235.59±6.05 ng) and LP1 (363.96±6.18 ng) versus LP2 (235.59±6.05 ng). This could be due to the increased weight/size of the combination preparations and the relative distance travelled to stage 4 (illustrates lower lung deposition) which could indicate the role of impaction rather than sedimentation for larger molecules.
Figure 1 Total drug masses deposited on Calu-3 cell monolayer for, stage 2;, stage 3; and, stage 4.
Abbreviations: L, linezolid; LP1, linezolid + prep 1; LP2, linezolid + prep 2.
displays the relative transport rate (Papp) of linezolid measured for L, LP1, and LP2 across the Calu-3 Transwell in stage 2. Initial transport rates for L, LP1, and LP2 were found to be similar at Papp values of 1.95×10⁻⁴ (±0.30) ng/mm2/min, 1.93×10⁻⁴ (±0.60) ng/mm2/min, and 1.51×10⁻⁴ (±0.96) ng/mm2/min, respectively. In , L and LP1 presented similar initial Papp values of 1.64×10⁻⁴ (±0.61) ng/mm2/min and 1.67×10⁻⁴ (±0.01) ng/mm2/min in stage 3 again; whereas LP2 displayed a significantly lower (P≤0.05) Papp value of 5.9×10⁻⁶ (±0.60) ng/mm2/min. Stage 4 represented in shows similar initial transport rates for L, LP1, and LP2 at Papp values of 2.20×10⁻⁴ (±0.18) ng/mm/min, 2.02×10⁻⁴ (±0.41) ng/mm2/min, and 1.96×10⁻⁴ (±0.85) ng/mm2/min, respectively. These transport rates were also similar to those found in stage 2 ().
Figure 2 The relative transport rate (Papp) measured for L, LP1, and LP2 across the Calu-3 Transwell in stage 2.
Abbreviations: L, linezolid; LP1, linezolid + prep 1; LP2, linezolid + prep 2.
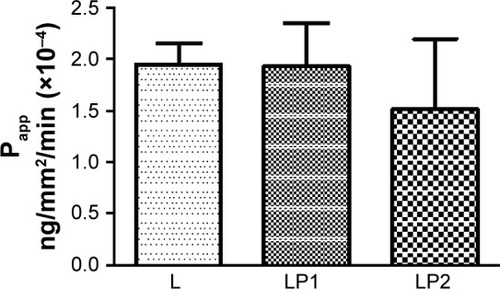
Figure 3 The relative transport rate (Papp) measured for L, LP1, and LP2 across the Calu-3 Transwell in stage 3.
Abbreviations: L, linezolid; LP1, linezolid + prep 1; LP2, linezolid + prep 2.
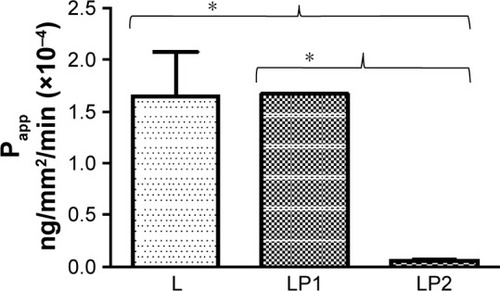
Figure 4 The relative transport rate (Papp) measured for L, LP1, and LP2 across the Calu-3 Transwell in stage 4.
Abbreviations: L, linezolid; LP1, linezolid + prep 1; LP2, linezolid + prep 2.
Analysis of the transport after 4 hours showed that 74.77%±9.50% mass percentage of linezolid from the single preparation (L) was detected in the basal chamber for stage 2. The percentage of linezolid detected in the basal chamber from the combination preparation LP1 (92.22%±0.25%) was significantly higher than from the combination preparation LP2 (56.42%±10.28%) for stage 2 (). Stage 3 () showed very similar mass percentage after transport of linezolid at 4 hours in the basal chamber for the single preparation L (86.50%±9.75%) and the combination preparations LP1 (72.55%±7.92%) and LP2 (88.31%±1.32%). The mass percentage of linezolid detected in the basal chamber for stage 4 () after 4 hours showed significant difference between the combination preparations LP1 (90.79%±0.55%) and LP2 (71.27%±12.98%); however, no difference was seen for the single preparation L (84.05%±3.44%).
Figure 5 Mass percentage of total drug particles in the basal chamber, remaining on the cell surface, and inside the cells after 4 hours after deposition of L, LP1, and LP2 at stage 2.
Abbreviations: L, linezolid; LP1, linezolid + prep 1; LP2, linezolid + prep 2.
Figure 6 Mass percentage of total drug particles in the basal chamber, remaining on the cell surface, and inside the cells after 4 hours after deposition of L, LP1, and LP2 at stage 3.
Abbreviations: L, linezolid; LP1, linezolid + prep 1; LP2, linezolid + prep 2.
Figure 7 Mass percentage of total drug particles in the basal chamber, remaining on the cell surface, and inside the cells after 4 hours after deposition of L, LP1, and L at stage 4.
Abbreviations: L, linezolid; LP1, linezolid + prep 1; LP2, linezolid + prep 2.
As seen in , analysis of the epithelial cell contents revealed that after 4 hours, 18.35%±11.75% of linezolid from the single preparation (L), 5.00%±1.36% from the combination preparation LP1, and a significant increased amount of 35.75%±6.27% from the combination preparation LP2 were found in the epithelial cells at stage 2. Therefore, at the end of the experiment, 7.84%±0.08% of linezolid from L, 2.46%±0.97% from the combination preparation LP1, and 7.16%±2.4% from the combination preparation LP2 remained on the surface of the epithelial cells. The amount of linezolid that remained on the surface of the epithelial cells from LP2 significantly increased (P#0.05) to that of LP1. The mass percentage remaining of linezolid in the single preparation L was also found to be statistically more than that of LP1 ().
The mass percentage of linezolid remaining in the epithelial cell contents after 4 hours for stage 3 can be seen in . Linezolid from LP1 (27.34%±10.19%) was significantly higher than that of linezolid from L (8.31%±4.79%) and LP2 (9.72%±0.24%), respectively. A similar mass percentage of linezolid remaining on the cell surface of the apical compartment was detected in stages 3 and 4 for all three preparations. The epithelial cell content of linezolid for the single preparation L was similar to stages 2 and 3 at 13.89±1.63 mass percentage at stage 4. The mass percentage (stage 4) of linezolid remaining in the epithelial cell contents from the combination preparation LP2 (22.22%±8.37%) was found to be statistically higher than that of linezolid from combination preparation LP1 (8.28%±0.27%). Stage 4 () showed a similar pattern in the differences of mass percentage for drug remaining within epithelial cell lysate contents for LP1 versus LP2 (P≤0.05). This direct comparison indicates the effect of drug combination type on cellular uptake and transport.
Surface activity of Synsurf preparations
summarizes the reduction in surface tension of the different Synsurf preparations. Both prep 1 and prep 2 reduced the minimum surface tension to a mean of 49.30±0.82 mN/m and 50.84±1.15 mN/m, respectively, with no significant differences between the two groups. Statistical differences in surface tension were found for Synsurf (mean 45.61±1.83 mN/m) versus prep 1 (mean 49.30±0.82 mN/m, P<0.0001) and prep 2 (mean 50.84±1.15 mN/m, P<0.0001), as well as between Synsurf + cholesterol (mean 47.18±0.66 mN/m) versus prep 2 (mean 50.84±1.15 mN/m, P<0.0001). Experimental results conducted with the preparations in the pulsating drop configuration with increasing frequencies () showed no statistical differences between the different preparations for the complex surface dilatational modulus as well as for the elastic modulus. As could be expected, addition of cholesterol to Synsurf increased the viscous modulus significantly (mean 14.03±3.08 mN/m to 20.63±1.97 mN/m, P<0.0001). However, addition of linezolid to Synsurf containing cholesterol in order to compose prep 1 decreased the viscous modulus significantly again to a mean surface tension of 10.14±1.6 mN/m, P<0.0001. Statistical difference in the viscous modulus between prep 1 and prep 2 was also found significant with a P-value <0.05.
Table 1 Surface tension and interface rheology activity of Synsurf® preparations containing 90 μg of the pulmonary surfactant with or without cholesterol (2 weight%) and/or linezolid (90 μg) in 100 mM NaCl solution
Surface morphology of Calu-3 cells grown via ALI culture
SEM was used to study the surface of the cells after 11 days in ALI culture (), the point at which the TEER maintained its maximum resistance of ~750–1,000 Ω cm2 and the cell layer was presumed to be “intact” with fully formed tight junction proteins accompanied with mucus production. The boundaries between the cells were also observed as clearly shown.
Figure 8 (A) Linezolid particles deposited on top of the cells for stage 2; (B) examples of tight junction belt fractures after freeze-drying for scanning electron microscopy.
Calu-3 cells were clearly shown to express cilia after 7 days in culture (); a characteristic trait that is only present in a differentiated pseudostratified epithelium. Around 95% of all cells in each sample displayed cilia; however, some cell populations displayed a diverse degree of differentiation. The shape and length of cilia also varied between cells, and some displayed a “clumping” characteristic which has also been described by ProctorCitation18 who reasoned it to be due to the fixing method.
Figure 9 Scanning electron microscopy images of Calu-3 epithelial layers grown at air–liquid interface where cilia on the surface as well as a mucosal layer is visible.
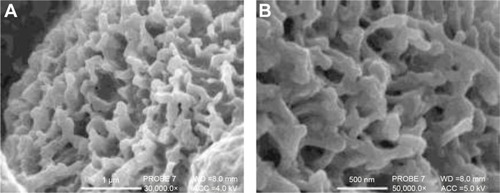
displays highly magnified images visualizing the particles present on the cell surface post-pMDI fire. Particle size delivered by the pMDI was formulation dependent. The particles have been determined by SEM visualization and indicated that, in general, the particles were well dispersed in 60 seconds post-fire. LP1 displayed a more striated dispersion (), whereas agglomerates were preferentially seen for LP2 (). Images are representative of n=2 independent experiments.
Figure 10 Scanning electron microscopy images visualizing the deposition of Synsurf® and linezolid on the Calu-3 epithelial layers grown at air–liquid interface immediately post-pMDI-fire.
Notes: (A) Linezolid + prep 1 (LP1) particles were found to be well dispersed and measured between 500 nm and 1 μm; (B) LP1 particle displaying a “burst” characteristic, spreading onto the mucosal layer; (C) linezolid + prep 2 (LP2) particle displayed a distinctive “comet-like” tail appearance. The particle measured 500 nm in diameter. (A) Scale bar =1 μm, original magnification 30,000×, working distance (WD) =8.0 mm, accelerating voltage (beam energy) (ACC) =5.0 kV. (B) Scale bar =1 μm, PROBE 7, original magnification 35,000×, WD =8.0 mm, ACC =4.0 kV. (C) Scale bar =500 nm, PROBE 7, original magnification 50,000×, WD =8.0 mm, ACC =5.0 kV. Prep 1 (Synsurf + linezolid); prep 2 (Synsurf + 2% cholesterol + linezolid).
Abbreviation: pMDI, pressurised metered dose inhaler.
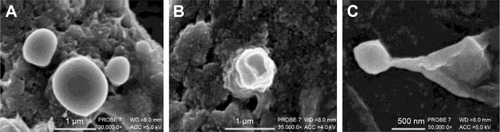
Figure 11 Scanning electron microscopy images visualizing the deposition of Synsurf® on the Calu-3 epithelial layers grown at air–liquid interface.
Abbreviations: L, linezolid; LP1, linezolid + prep 1; LP2, linezolid + prep 2; pMDI, pressurised metered dose inhaler.
Discussion
In this study, we compared the diffusion kinetics of linezolid formulated alone and within two preparations of a synthetic surfactant Synsurf-based pMDI (LP1 and LP2) across a Calu-3 cell Transwell culture. The different surfactant drug combinations allow for an evaluation of the significance of the experimental model system, as well as assessment of the formulations providing a possible noninvasive, site-specific, delivery model via pMDI. From a drug delivery perspective, this is valuable in the development and characterization of a drug-loaded synthetic surfactant. In this regard, this may lead to the better understanding of the clinical relevance achieved by concomitant use of surfactant-drug formulations in the treatment of pulmonary tuberculosis.
Under our experimental conditions with a total dose of 500 μg (C0), fired from the pMDI, the concentration delivered was calculated in different regions of the lung.Citation16 The same reasoning could be used for the deposition of the compound at the different stages of the NGI. In the large conducting airways (stage 1 of the NGI), the possible deposited concentration could amount from 30 to 300 ng/cm2. The peak concentration in the segmental bronchi (stage 2) and the small conducting airways (stage 3) could be 30 ng/cm2, and in the alveoli, the concentration was shown to be 0.1–1 ng/cm2 (stage 4–5), which correlated with the total mass deposited on the Calu-3 cell surface ().
In studies conducted with Caco-2 cells, it was shown that the apparent permeability coefficients of compounds with different physicochemical properties and mechanisms of permeation have a very distinctive effect on the rate of transport. Moreover, drug permeability under Fick’s law (EquationEquation 1(1) ) assumes that the driving force is a concentration gradient difference between the single barrier of the cell monolayer that leads to either the sequestration of lipophilic drugs into the phospholipid membranes in transcellular diffusion or the partitioning of hydrophilic drugs into aqueous tight-junctional areas in paracellular diffusion.Citation19,Citation20 On the other hand, high passive permeability is not necessarily synonymous with high lipophilicity because hydrogen bonding or the presence of an unstirred water layer for a group of compounds can delimit permeability to such an extent that the compounds would exhibit a low permeability.Citation21 This theory may be the explanation for the decreased permeability of linezolid in LP2 containing cholesterol for stage 2 and 3 compared with that of L and LP1. The addition of 2 wt% cholesterol to Synsurf prep 2 may have contributed to the more lipophilic nature of the compound LP2 as a whole; however, our data show that LP2 displayed the lowest Papp value, albeit not all significant, of all three compounds over all the three stages of the NGI (
–). These findings differ from that of a report by Foster et al which found a linear relationship between the log Papp and the log octanol/water partition coefficient.Citation22 The moderate lipophilicity of linezolid is shown in
– where the remaining concentration values are conveyed for all three pMDI preparations over all the three stages. Linezolid displays the highest concentration for remaining drug on the surface of the Calu-3 monolayer at stages 2 and 3 compared with that of linezolid in combination with either of the Synsurf preparations (LP1 and LP2). One can thus speculate that linezolid alone and LP2 have the ability to embed within the cell as their lysate concentration values are thus similar. In such a situation, electrostatic and hydrophobic interactions are enhanced and may reinforce each other. The different particle sizes among the stages are also to be taken into consideration when deliberating the remaining surface drug of cell lysate concentrations; as there could very well be a higher concentration of drug in a certain particle size distribution and thus more deposited on a certain stage than others.
Synthetic particles of diverse forms have gained increasing attention, as evident from recent studies, which suggested that morphology could influence the mechanisms of drug delivery in many ways.Citation23–Citation27 In studies conducted by Lu et al, it was shown that key parameters such as surfactant changing concentration can alter viscoelasticity and surface tension of the solution that will change the morphology of the preparation such as filament forming between drops. Instead of filaments breaking rapidly, they change from a spherical to a spindle-like appearance.Citation28 Under our experimental conditions, we found a more agglomerated and “ribbon-like” nature of LP2 () compared to that of cholesterol-devoid LP1 () that displayed more perpendicular spreading like characteristics. Moreover, the temperature at which DPPC transitions from the gel phase to the rippled phase (Tp =36°C) could also be of significance where DPPC-based liposomes form vesicle pearling filaments as seen in .Citation28,Citation29 This is reflected for both Synsurf/linezolid preparations that displayed similar supra-molecular entanglements with the incorporation of droplets and beaded filaments.
The delivered particles and drug dose showed a high dependency from the preparation that was aerosolized. The Synsurf/linezolid preparations (LP1 and LP2) showed that an assortment of particle ranges from 500 nm to 2 μm in the emitted dose which have been similarly reported by Zanen et al and other studies.Citation30–Citation32 It is generally accepted that to be therapeutically effective, the particles should be in the range of 1–5 μm since particles >5 μm will generally impact in the oropharynx and be swallowed, whereas those <1 μm may remain entrained in the airstream and be exhaled during the next breathing cycle.Citation16 The smaller particles may be deposited peripherally and may be more effective since surfactant is present and functions in the alveolar region. The diameters of LP1 and LP2 pMDI particles measured with SEM imaging revealed suitable size distribution to achieve desired lung distribution and still be deemed therapeutically effective. However, fast inhalations (>60 L/min) such as that illustrated with a pMDI result in a reduced peripheral deposition because the aerosol is more readily deposited by inertial impaction in the conducting airway and oropharyngeal regions.Citation33
It is known that the composition of pulmonary surfactant influences its biophysical properties. Synsurf consists of a mixture of DPPC (saturated lipid) combined with 10% phosphatidylglycerol (contains unsaturated fatty acids) and the nonionic detergent tyloxapol as well as 1-hexadecanol as a spreading agent.Citation11 In addition to the above compounds, prep 1 contained linezolid and prep contained 2% by weight cholesterol (neutral lipid) and linezolid. In natural human pulmonary surfactant, cholesterol is present between 5% and 10% weight of the lipid components with no inhibitory effect on surface tension as seen with supra-physiological concentrations in adult respiratory distress syndrome.Citation34 Moreover, one of the most important functions of pulmonary surfactant is increasing the surface pressure upon exhalation. Although ≥8% by weight cholesterol interferes with functionality in reconstituted pulmonary surfactants films,Citation35 we found that during compression–expansion experiments, a maximum and minimum surface pressure of ~69 mN/m and ~2 mN/m, respectively, could be reached for prep 1 and prep 2 (results not shown). In view of our results, we are of the opinion that Synsurf as a replacement pulmonary surfactant not only seems to be able to cope with cholesterol inhibition but that both prep 1 and prep 2 are beneficial test combinations for use during aerosolization of linezolid.
Conclusion
In summary, a synthetic surfactant Synsurf-based pMDI was investigated to deliver the antibiotic, linezolid. Although the small sample size with a post hoc power of analysis may be seen as a limitation, we addressed this by using CIs to estimate the magnitude of effects via a Tukey post hoc test.Citation36 Finally, our data show that linezolid can be aerosolized in desired particle ranges for optimal lung deposition. The use of the NGI and the Calu-3 cell line for the assessment of linezolid dissolution and transport after particle codeposition has allowed for a more realistic investigation with respect to the in vivo situation. This paper is the first to study Synsurf in a pMDI in the evolution of surfactant therapy and drug delivery.
Acknowledgments
We would like to thank the University of Bath, the Global Partnership Scholarship, and the direction of Dr Robert Price for making this research study possible.
Disclosure
The authors report no conflicts of interest in this work.
References
- OnoueSMisakaSKawabataYYamadaSNew treatments for chronic obstructive pulmonary disease and viable formulation/device options for inhalation therapyExpert Opin Drug Deliv20096879381119558334
- HaghiMTrainiDYoungPIn vitro cell integrated impactor deposition methodology for the study of aerodynamically relevant size fractions from commercial pressurised metered dose inhalersPharm Res20143171779178724549816
- OngHXTrainiDYoungPMPharmaceutical applications of the Calu-3 lung epithelia cell lineExpert Opin Drug Deliv20131091287130223730924
- HarcourtJLHaynesLMEstablishing a liquid-covered culture of polar-ized human airway epithelial Calu-3 cells to study host cell response to respiratory pathogens in vitroJ Vis Exp201372e50157
- KesserKCGellerDENew aerosol delivery devices for cystic fibrosisRespir Care200954675476819467162
- NewhouseMAdvantages of pressurized canister metered dose inhalersJ Aerosol Med19914313915010147675
- MeersPNevilleMMalininVBiofilm penetration, triggered release and in vivo activity of inhaled liposomal amikacin in chronic Pseudomonas aeruginosa lung infectionsJ Antimicrob Chemother200861485986818305202
- BeijaMSalvayreRLauth-de ViguerieNMartyJColloidal systems for drug delivery: from design to therapyTrends Biotechnol201230948549622673692
- ViljoenIThe Role of Surfactant in, and a Comparison of, the Permeability of Porcine and Human Epithelia to Various Chemical Compounds [dissertation]StellenboschUniversity of Stellenbosch2005
- InnovusSynsurf – synthetic lung surfactant Available from: http://www.innovus.co.za/technologies/medicine-and-health-1/therapeutics-and-pharmaceutics/synsurf-synthetic-lung-surfactant.htmlAccessed November 22, 2017
- van ZylJMSmithJSurfactant treatment before first breath for respiratory distress syndrome in preterm lambs: comparison of a peptide-containing synthetic lung surfactant with porcine-derived surfactantDrug Design Dev Ther20137905916
- DekaliSGamezCKortulewskiTBlazyKRatPLacroixGAssessment of an in vitro model of pulmonary barrier to study the translocation of nanoparticlesToxicol Rep2014115717128962236
- Van ZylJMSmithJHawtreyAThe effect of a peptide-containing synthetic lung surfactant on gas exchange and lung mechanics in a rabbit model of surfactant depletionDrug Design Dev Ther20137139148
- FischerERHansenBTNairVHoytFHDorwardDWScanning electron microscopyCurr Protoc Microbiol2012 Chapter 2:Unit2B.2
- HaghiMYoungPMTrainiDJaiswalRGongJBebawyMTime-and passage-dependent characteristics of a Calu-3 respiratory epithelial cell modelDrug Dev Ind Pharm201036101207121420374185
- Copley ScientificIntroduction to Aerodynamic Particle Sizing Available from: http://issuu.com/pyramidpress/docs/inhaler_brochure_2015_rev4__high_re?e=6944369/13992727Accessed May 15, 2017
- HaghiMTrainiDPostmaDSBebawyMYoungPMFluticasone uptake across Calu-3 cells is mediated by salmeterol when deposited as a combination powder inhalerRespirology20131881197120123796052
- ProctorVKSignalling Pathways Linking Interleukin 13 Receptor Activation to Lung Epithelial Cell Function [dissertation]BathUniversity of Bath2013
- MathiasNRTimoszykJStetskoPIMegillJRSmithRLWallDAPermeability characteristics of Calu-3 human bronchial epithelial cells: in vitro-in vivo correlation to predict lung absorption in ratsJ Drug Target2002101314011996084
- HilgersARConradiRABurtonPSCaco-2 cell monolayers as a model for drug transport across the intestinal mucosaPharm Res1990799029102235888
- SunHPangKSPermeability, transport, and metabolism of solutes in Caco-2 cell monolayers: a theoretical studyDrug Metab Dispos200736110212317932224
- FosterKAAveryMLYazdanianMAudusKLCharacterization of the Calu-3 cell line as a tool to screen pulmonary drug deliveryInt J Pharm2000208111111064206
- ChampionJAKatareYKMitragotriSParticle shape: a new design parameter for micro- and nanoscale drug delivery carriersJ Control Release200712113917544538
- SimoneEADziublaTDMuzykantovVRPolymeric carriers: role of geometry in drug deliveryExp Opin Drug Deliv200851212831300
- YooJWDoshiNMitragotriSAdaptive micro and nanoparticles: temporal control over carrier properties to facilitate drug deliveryAdv Drug Deliv Rev201163141247125621605607
- KimDKDobsonJNanomedicine for targeted drug deliveryJ Mater Chem2009193562946307
- VenkataramanSHedrickJLOngZYThe effects of polymeric nanostructure shape on drug deliveryAdv Drug Deliv Rev201163141228124621777633
- LuJHouRYangZTangZDevelopment and characterization of drug-loaded biodegradable PLA microcarriers prepared by the electrospraying technique (poly(L-lactide)) (report)Int J Mol Med201536124925425955135
- AraiNYoshimotoYYasuokaKEbisuzakiTSelf-assembly behaviours of primitive and modern lipid membrane solutions: a coarse-grained molecular simulation studyPhys Chem Chem Phys20161828194261943227378100
- BlankFRothen-RutishauserBMSchurchSGehrPAn optimized in vitro model of the respiratory tract wall to study particle cell interactionsJ Aerosol Med200619339240517034314
- MeindlCStranzingerSDzidicNPermeation of therapeutic drugs in different formulations across the airway epithelium in vitroPLoS One2015108e013569026274590
- ZanenPGoLTLammersJOptimal particle size for β2 agonist and anticholinergic aerosols in patients with severe airflow obstructionThorax199651109779808977595
- LabirisNRDolovichMBPulmonary drug delivery. Part II: the role of inhalant delivery devices and drug formulations in therapeutic effectiveness of aerosolized medicationsBr J Clin Pharmacol200356660061214616419
- ZuoYYVeldhuizenRAWNeumannAWPetersenNOPos-smayerFCurrent perspectives in pulmonary surfactant – inhibition, enhancement and evaluationBiochim Biophys Acta20081778101947197718433715
- TanevaSKeoughKMCholesterol modifies the properties of surface films of dipalmitoylphosphatidylcholine plus pulmonary surfactant-associated protein B or C spread or adsorbed at the air–water interfaceBiochemistry19973649129229020791
- LevineMEnsomMHPost hoc power analysis: an idea whose time has passed?Pharmacotherapy200121440540911310512