
 ?Mathematical formulae have been encoded as MathML and are displayed in this HTML version using MathJax in order to improve their display. Uncheck the box to turn MathJax off. This feature requires Javascript. Click on a formula to zoom.
Abstract
Epiberberine (EPI) is a novel and potentially effective therapeutic and preventive agent for diabetes and cardiovascular disease. To evaluate its potential value for drug development, a specific, sensitive and robust high-performance liquid chromatography-tandem mass spectrometry assay for the determination of EPI in rat biological samples was established. This assay was used to study the pharmacokinetics, bioavailability and excretion of EPI in rats after oral administration. In addition, a cocktail method was used to compare the inhibition characteristics of EPI on cytochrome P450 (CYP450) isoforms in human liver microsomes (HLMs) and rat liver microsomes (RLMs). The results demonstrated that EPI was rapidly absorbed and metabolized after oral administration (10, 54 or 81 mg/kg) in rats, with Tmax of 0.37–0.42 h and T1/2 of 0.49–2.73 h. The Cmax and area under the curve values for EPI increased proportionally with the dose, and the oral absolute bioavailability was 14.46%. EPI was excreted mainly in bile and feces, and after its oral administration to rats, EPI was eliminated predominantly by the kidneys. A comparison of the current half-maximal inhibitory concentration and Ki values revealed that EPI demonstrated an obvious inhibitory effect on CYP2C9 and CYP2D6. Furthermore, its effect was stronger in HLM than in RLM, more likely to be a result of noncompetitive inhibition.
Introduction
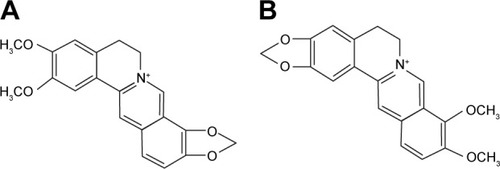
Epiberberine (EPI; ), one of the main active protoberberine alkaloids, is found in “Rhizoma Coptidis” (Huanglian).Citation1 Rhizoma Coptidis is a famous Chinese herb, which has been widely used in folk medicine for more than 2000 years. Modern pharmacological studies suggest that EPI has broad biological activity, including antihyperlipidemicCitation2–Citation6 and antihyperglycemicCitation7–Citation11 effects as well as anti-inflammatory,Citation12,Citation13 anti-Alzheimer and antioxidant effects,Citation14 and inhibits urease activity.Citation15 In addition, EPI interacts with the human organic cation transporters (OCTs) 1, 2 and 3Citation16 and the cytochrome P450 (CYP450) enzyme.Citation17 When considering binding affinity to DNA and aldose reductase inhibitory activity, EPI is more active than other coptis alkaloids including berberine, coptisine, palmatine and jatrorrhizine.Citation18 More importantly, the results for acute and subchronic toxicity in mice and rats indicate EPI is a safe compound and its toxicity is lower compared with that of the other coptis alkaloids.Citation19,Citation20 This evidence suggests that EPI holds promise as a therapeutic and preventive agent for cardiovascular disease, metabolic syndrome, Alzheimer’s disease and oxidative stress-related disease, diabetic complications, diabetes mellitus and other diseases. Until now, although EPI has been confirmed to carry enviable pharmacological activity, few studies have been conducted to investigate absorption, distribution, metabolism and excretion (ADME) as well as its pharmacokinetic characterizations for drug development. The evaluation of the EPI inhibitory effects on CYP450 isoforms has been focused on continuously; however, the results are not sufficiently comprehensive, and further research is needed.
Figure 1 Chemical structure of EPI (A) and berberine (B).
Therefore, the purpose of this study was to establish a sensitive and robust high-performance liquid chromatography-tandem mass spectrometry (HPLC-MS/MS) assay to measure EPI concentrations in biological samples. The results of the assay were then used to confirm the following pharmacokinetic properties: 1) the plasma pharmacokinetics; 2) the biliary, urinary and fecal excretion; 3) the relative inhibition of CYP450 isoforms in the mixed human liver microsome (HLM) and rat liver microsome (RLM) systems; and 4) the inhibition type.
Materials and methods
Chemicals and reagents
EPI (purity >98%) was purchased from Chengdu Pharmaceutical Co., Ltd. (Chengdu, China). Berberine (the internal standard [IS], purity ≥98%) was obtained from the National Institute for Control of Pharmaceutical and Biological Products. HLM and RLM were procured from Huizhi Kangtai Tech (iPhase Pharmaceutical Services, Beijing, China). α-Metoprolol, dapsone, phenacetin, chlorzoxazone and tolbutamide were Sigma (Sigma–Aldrich Chemical Co., St. Louis, USA) products purchased from Beijing Bayer Biology Biotechnology Co., Ltd. 4-Hydroxytoluene sulfonylurea was obtained from Beijing Leon Technology Co., Ltd. α-Hydroxymetoprolol was procured from TRC Co., Ltd (Toronto, Canada). Methanol, acetonitrile and formic acid (HPLC grade) were supplied by Thermo Fisher Technologies Inc. (Pittsburgh, MA, USA). The distilled deionized water used in all experiments was purified by a Milli-Q water purification system (Merck Millipore Co., Darmstadt, Germany). In addition, the remainder of the reagents and chemicals were analytically pure and were purchased from domestic markets.
Animals and experimental design
Male Sprague Dawley rats, weighing 200±20 g, were purchased from the Laboratory Animal Centre of Vital River (Beijing, China) and given an animal feed production certificate number (SCXK, 2012-0001). The rats were maintained in a breeding room under controlled temperature (25°C), humidity (55%±5%) and lighting (12-hour light, 12-hour dark). About 12 h prior to each experiment, the rats were fasted with free access to water. The animal experiments were preformed according to the Guide for the Care and Use of Laboratory Animals prepared by the Institute of Laboratory Animal Resources. Ethical approvals for the animal experiments were obtained from the animal ethics committee of Beijing University of Chinese Medicine.
Pharmacokinetic studies
A total of 24 rats were randomly divided into two groups: group 1 (n=18) and group 2 (n=6). In addition, rats in group 1 were orally administered at doses of 10, 54 and 81 mg/kg (six rats per dose), while rats in group 2 were intravenously injected at a dose of 10 mg/kg. Blood samples (each 0.3 mL) were collected from the postorbital venous plexuses of each rat into heparinized tubes at various time points after oral administration and intravenous dosing (group 1 and group 2, respectively ). After centrifugation at 15,000× g for 10 min, the plasma samples were obtained. Then, a 100 μL plasma aliquot (containing 0.5 μg/mL of berberine as the IS) was deproteinated by the addition of two volumes of acetonitrile. After vortex mixing for 1 min, the mixture was centrifuged at 15,000× g for 10 min. A 10 μL aliquot of the supernatant was injected into the HPLC-MS/MS instrument for analysis.
Table 1 Protocol for the pharmacokinetic and excretion study of EPI in rats
Excretion study
A total of 48 rats were randomly divided into eight groups (n=6). Each rat was administered 54 or 81 mg/kg of EPI through oral administration or intravenous injection at a dose of 10 mg/kg. The rats were then placed into separate metabolic cages designed for the separation and collection of urine and feces. The control groups received solvent via oral administration or intravenous injection. Urine and feces were collected before and after dosing at various time points (group 3 and group 5; ). Bile samples were also collected by biliary cannulation before and after dosing using the same routes and doses as described earlier (group 4, group 6, group 7 and group 8; ).
For quantitative analysis, the urinary, fecal and biliary samples were prepared as follows. The urinary and biliary samples were spiked with 10 μL of berberine solution (IS, 5 μg/mL), methanol was added (1:3, v/v) and they were vortex mixed and centrifuged at 15,000× g for 15 min. The fecal samples (0.5 g) were dried at 80°C for 2 h, spiked with 10 μL of berberine (IS, 5 μg/mL) and 2 mL methanol, vortex mixed for 10 s and soaked for 1 h. The samples were then extracted via ultrasonication for 30 min and centrifuged at 15,000× g for 15 min. The supernatant (10 μL) was injected into the HPLC-MS/MS system for analysis.
In vitro assay of CYP450 activity in RLM or HLM
The incubation mixture (total volume, 200 μL) used in our previous studyCitation21 contained 0.6 mg/mL RLM or HLM, 20 mM glucose-6-phosphate, 2 U/L of glucose-6-phosphate dehydrogenase, 0.1 mM potassium phosphate buffer (pH 7.4), 1 mM NADPNa2, 20 mM MgCl2 and specific substrates in the absence or presence of various concentrations of EPI. The substrates such as tolbutamide (CYP2C9), metoprolol (CYP2D6), phenacetin (CYP1A2), chlorzoxazone (CYP2E1) and dapsone (CYP3A4) were used at final concentrations of 10 μM (55 μM for dapsone). EPI was dissolved in methanol, and the final concentration of methanol in the solution was less than 0.5% (v/v). After a 5-minute preincubation at 37°C, nicotinamide adenine dinucleotide phosphate (NADPH) was added to the mixture to initiate the reaction. The reactions were quenched by adding 100 μL of acetonitrile and 20 μL of schisandrol A (31.5 μg/mL) as an IS. The mixture was centrifuged at 15,000× g for 10 min, and an aliquot of supernatant was transferred to an auto-injector vial for HPLC analysis.
Determination of enzyme inhibition kinetics
To evaluate the order of inhibition kinetics and calculate the inhibition parameters, various concentrations of EPI were added to reaction mixtures containing various concentrations of tolbutamide (for CYP2C9) or metoprolol (for CYP2D6; ). After a 120-minute incubation at 37°C, the reactions were quenched by adding 100 μL acetonitrile with phenacetin (100 μM) as an IS. The mixture was centrifuged at 15,000× g for 10 min, and an aliquot of supernatant was transferred to an auto-injector vial for the analysis of substrate metabolites (4-hydroxytolbutamide and α-hydroxymetoprololin) by HPLC or HPLC-MS/MS. Dixon and Lineweaver plotsCitation22 were adapted to determine the inhibition type, and a second plot of the slope from the Lineweaver–Burk plot versus EPI concentration was utilized to calculate the inhibitory constant (Ki) values.
Table 2 A series of concentrations of EPI and a series of concentrations of specific substrates of CYP450 isoforms for Dixon and Lineweaver–Burk plots
Apparatus and chromatographic conditions
LC-MS/MS was used to quantify the EPI in the rat bio-samples. The EPI concentrations were determined using a Thermo Fisher Scientific TSQ Quantum triple quadruple system (Thermo Fisher Scientific, Waltham, MA, USA) equipped with an electrospray ionization source in selected reaction monitoring (SRM) mode. Following optimization of the setting parameters, the instrument was operated in positive mode with an ion spray voltage of 3,400 V. The capillary temperature was set at 300°C. The SRM transitions were m/z 336.1→320.2 for EPI and berberine (IS; Figure S1). The analytes were chromatographically separated by an Agilent Eclipse XDB-C18 column (150×4.6 mm, 5 μm; Agilent Technologies, Santa Clara, CA, USA) using an acetonitrile and 0.1% formic acid aqueous solution (30:70, v/v) as a mobile phase at a flow rate of 1 mL/min.
A specific CYP450 cocktail assay for the simultaneous measurement of five substances (tolbutamide, metoprolol, phenacetin, chlorzoxazone and dapsone) in microsomes was achieved on the column, as described earlier, using a previously validated HPLC method.Citation21
4-Hydroxytolbutamide and phenacetin (IS) in HLM were analyzed using reversed-phase HPLC consisting of a mobile phase flow (1 mL/min) of 25% acetonitrile and 75% of 0.1% formic acid in water at 40°C. The eluent was monitored at 230 nm using a ultraviolet (UV) detector.
α-Hydroxymetoprololin and phenacetin (IS) in HLM and RLM were analyzed via the previously described HPLC-MS/MS system and the same type column. The mobile phase consisted of a mixture of acetonitrile and diammonium hydrogen phosphate buffer (pH 3.4; 25:75, v/v, %) with a flow rate of 1.0 mL/min at 30°C. Following optimization of the setting parameters, the instrument was operated in positive mode with an ion spray voltage of 2,700 V. The capillary temperature was set at 200°C. The SRM transitions were m/z 284.1→116.2 for α-hydroxymetoprolol and m/z 180.1→138.3 for phenacetin (IS; Figure S2).
Data analysis
A noncompartmental analysis utilizing WinNonlin 5.2 software (Pharsight, St Louis, MO, USA) was employed to calculate the pharmacokinetic parameters. The parameters are presented as mean ± standard deviation (SD). The cumulative excretion percentage was calculated via the following formula:
Results
Method validation
Figures S3 and S4 show typical chromatograms of plasma, urine, feces and bile samples, including blank samples, each blank spiked with EPI and IS, and samples of plasma, urine, feces and bile after oral administration. The developed method was determined to be selective, and no endogenous interference or other impurities were observed. The retention time of EPI and IS was 4.61 and 7.54 min, respectively.
Representative chromatograms of α-hydroxymetoprololin and 4-hydroxytolbutamide in microsomes are presented in Figures S5 and S6, including blank, blank spiked with reference substances and IS and microsome samples following incubation. The developed method was determined to be selective, and no endogenous interference or other impurities were observed.
The linearity results for EPI in rat samples and α-hydroxymetoprololin and 4-hydroxytolbutamide in microsomes are summarized in Tables S1 and S2. The detection limit was sufficient for the study requirements.
The precision and accuracy were determined by five replicate analyses of quality control samples at high, medium and low concentrations. The precision of the assay method, including intraday and inter-day precision (relative standard deviation [RSD]), was <15%. The accuracy is presented as the relative error within ±15%. The analyses revealed that the samples were stable when stored at −20°C for 7 days or 4°C in plastic auto-sampler vials for 8 h.
The results of extraction recoveries and matrix effects for EPI in rat samples and α-hydroxymetoprololin and 4-hydroxytolbutamide in microsomes are summarized in and .
Table 3 Extraction recovery and matrix effect for EPI in rat blood, urine, feces and bile (, n=5)
Table 4 Extraction recovery of α-hydroxymetoprololin and 4-hydroxytolbutamide in RLM and HLM (n=5)
Pharmacokinetics and oral bioavailability of EPI in rats
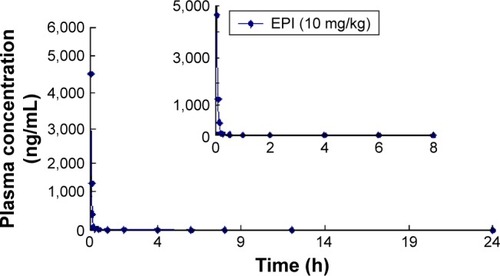
The mean concentration–time curves for EPI in rat plasma following oral and intravenous administration are shown in and , respectively. Selected pharmacokinetic parameters are presented in . summarizes that for three oral doses of EPI, the parameters for the mean time to peak concentration (Tmax), half-life (T1/2) and residence time (mean residence time, MRT) were 0.37–0.42, 0.49–2.73 and 0.38–4.39 h, respectively.
Table 5 Pharmacokinetic parameters of EPI after oral and intravenous administration to rats and oral bioavailability (, n=6)
Figure 2 Mean plasma concentration–time curves of EPI after oral administration in rats (n=6).
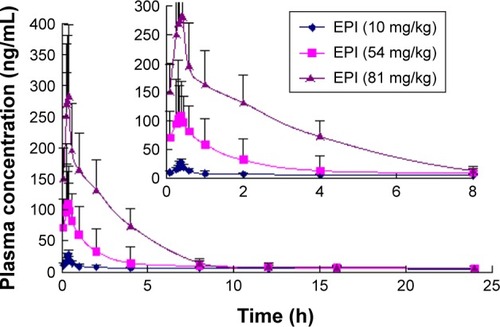
Figure 3 Mean plasma concentration–time curves of EPI after intravenous injection in rats (n=6).
Urinary, fecal and biliary excretion kinetics of EPI in rats
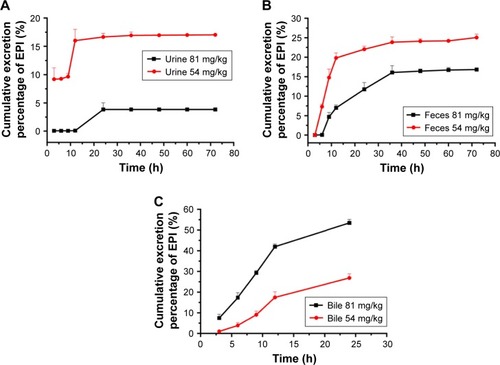
The cumulative excretion rates of EPI in rat urine and feces within 72 h and bile within 24 h following 54 or 81 mg/kg oral administration are illustrated in . The total cumulative excretion percentages of EPI within 72 h at 54 and 81 mg/kg were 17.03% and 3.84% in urine and 25.04% and 16.83% in feces, respectively. The cumulative percentages of EPI excreted in bile at two dosages were 34.51% and 53.42% within 24 h. In addition, shows that the oral administration of lower doses results in a higher cumulative percentage of EPI in urine and feces.
Figure 4 Mean cumulative excretion percentage–time profiles of EPI in rat urine (A), feces (B) and bile (C) following oral administration (n=6).
The effect of EPI on CYP450 in RLM and HLM
The cocktail method was used to simultaneously determine the substrate content of CYP2D6, CYP3A4, CYP1A2, CYP2E1 and CYP2C9 for evaluating the activity of CYP isoforms at different concentrations of EPI in RLM and HLM. The half-maximal inhibitory concentration (IC50) values () were estimated from the inhibition curves as shown in Figure S7.
Table 6 IC50 values for EPI on CYP450 isoforms in liver microsomes
The results suggest that EPI has no obvious inhibitory effect on CYP3A4, CYP1A2, CYP2E1 and CYP2C9 but exhibits significant inhibition of CYP2D6 in RLM, with an IC50 value of 19.45 μM. However, in HLM, EPI significantly inhibited CYP2D6, CYP2C9, CYP3A4 and CYP2E1 but not CYP1A2, and the IC50 values were 11.86, 8.18, 81.50 and 66.28 μM.
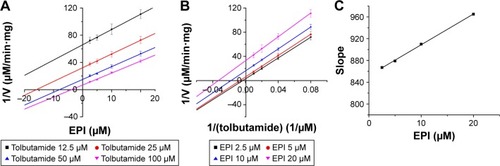
To further characterize the inhibition of CYP2D6 and CYP2C9 by EPI, enzyme inhibition kinetic experiments were conducted. Based on nonlinear regression analysis of the inhibition data and the Dixon plots as shown in –, EPI exhibited anticompetitive inhibition against CYP2D6 activity in RLM, with Ki values of 55.26 μM (). However, in HLM, EPI exhibited anticompetitive inhibition against the activity of CYP2D6 and CYP2C9 with Ki values of 25.44 μM () and 5.64 μM ().
Figure 5 Inhibition kinetic analysis of EPI toward CYP2D6-catalyzed metoprolol hydroxylation in RLM.
Abbreviations: EPI, epiberberine; RLM, rat liver microsome.
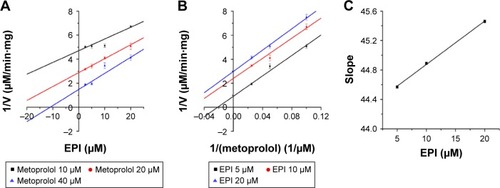
Figure 6 Inhibition kinetic analysis of EPI toward CYP2D6-catalyzed metoprolol hydroxylation in HLM.
Abbreviations: EPI, epiberberine; HLM, human liver microsome.
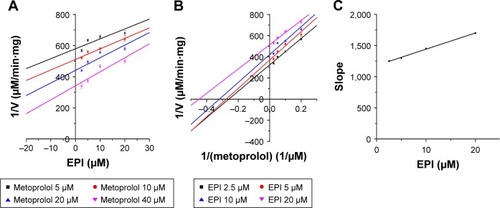
Figure 7 Inhibition kinetic analysis of EPI toward CYP2C9-catalyzed tolbutamide hydroxylation in HLM.
Abbreviations: EPI, epiberberine; HLM, human liver microsome.
Discussion
The LC-MS/MS methods for the bioanalysis of EPI have been previously reported.Citation23,Citation24 However, gradient elution chromatography was applied to determine multicomponents of Chinese medicines including EPI. The analysis times for one run were 20.0 and 22.0 min. It is the time-consuming analysis for pure EPI. The method with isocratic elution in this study, which consumed only 8.0 min to complete one run analysis, greatly reduced the sample analysis time and promoted analysis efficiency.
In the current experiments, we used LC-MS/MS to measure the pharmacokinetics of EPI following its oral and intravenous administration in rats. The area under the curve (AUC0−t) and Cmax of EPI displayed significant dose dependence. In addition, EPI exhibited the properties of rapid absorption and moderate elimination with a Tmax of 0.37–0.42 h, a T1/2 of 0.49–0.53 (2.73) h and an MRT of 3.87–4.39 h at different doses, respectively. The result showed that the T1/2 (2.73 h) of EPI at intragastric (ig) (81 mg/kg) dose is much longer than that at doses of ig (10 mg/kg) and ig (54 mg/kg). The possible reason may relate to physicochemical property of EPI. According to the preliminary study of our laboratory, the equilibrium solubility of EPI was 0.981±0.017 mg/mL in pH 7.4 phosphate-buffered saline. The apparent oil–water partition coefficient (log P) of EPI was 0.080±0.032 (<1.00) in pH 7.4 n-octanol–buffer system. In addition, the apparent permeability coefficients (Papp) of EPI in duodenum, jejunum, ileum and colon were 0.17×10⁻⁵, 0.17×10⁻⁵, 0.19×10⁻⁵ and 0.15×10⁻⁵ cm/s, respectively. Based on the abovementioned results, it is concluded that EPI belongs to the class of poor solubility and permeability compounds. This might lead to accumulation and retention in the gastrointestinal tract due to poor dis-solution and uneven dispersion, which can then slow down the elimination rate after oral administration at a high dose. Furthermore, the pharmacokinetic parameters of EPI were similar to those of berberine. However, the oral bioavailability of EPI (14.46%) was much higher than that of berberine (<1%).Citation25,Citation26 These results illuminate that EPI possesses better biopharmaceutical properties and is more suitable for future drug development.
We determined the fecal and biliary excretion of EPI accounts for at least 60% of the dosage administered within 24 h, while urinary excretion comprises only 16% and is even less at high dosages. This result indicated that the major route of elimination of EPI is biliary excretion, which is different from the result of a previous study indicating the renal elimination of berberine as the main excretory pathway.Citation27 Previous studies have indicated that coptis alkaloids were the substrates and inhibitors of some drug transporters, such as P-glycoproteinCitation28 and OCTs.Citation29 This phenomenon could be attributed to differences between compounds in terms of lipophilicity or interaction with transporters.Citation30
Statistically, more than 90% of the drug–drug interactions were mediated by the CYP450 enzyme, of whicĥ70% were caused by enzyme inhibition and about 23% were induced by enzymes.Citation31,Citation32 Therefore, it is key to elucidate the mechanism of EPI inhibition on CYP450 isoforms and identification of the inhibition type. Our study showed that EPI had obvious inhibitory effects on CYP2C9 and CYP2D6, similar to previous results.Citation33 A comparison of the current IC50 and Ki values showed that the inhibitory effect of EPI on CYP2D6 and CYP2C9 was stronger in HLM than that in RLM and the inhibition was entirely noncompetitive. In addition, the Cmax of EPI in rat was reported to be 109.0 ng/mL (0.32 μM) at medium dose and the Cmax/Ki was calculated to be 0.013 and 0.057 for CYP2D6 and CYP2C9, respectively. These in vitro–in vivo extrapolation (IV-IVE) results indicated low possibility of in vivo inhibition. However, many factors, such as processing of herbs and environmental complexity, might influence the IV-IVE results that could possibly strengthen the in vivo inhibition effect.Citation34 Based on the results of this study and previous results for HLM, combining EPI or Rhizoma Coptidis with CYP2D6 or CYP2C9 substrates might result in clinical metabolism-mediated EPI–drug interactions.
Conclusion
As a coptis alkaloid, EPI has a shorter T1/2 and higher oral bioavailability in rats than its isomer berberine. EPI is excreted primarily through bile and feces and eliminated predominantly by the kidneys; in addition, EPI may exit via enterohepatic circulation. In RLM and HLM, EPI showed different degrees of CYP enzyme inhibition.
Acknowledgments
This work was financially supported by the National Nature Science Foundation of China (81673680, 81274177). We thank Dr Ma for revising the article critically for important intellectual content.
Disclosure
The authors report no conflicts of interest in this work.
References
- JiangXFWangLJLiXGZhaoZQZhuJYIsolation of jatrorrhizine and epiberberine in Coptis Chinensis and their in vitro hypoglycemic effectGuizhou Agric Sci20113994446
- MaHHuYRZouZYFengMYeXLLiXGAntihyperglycemia and antihyperlipidemia effect of protoberberine alkaloids from Rhizoma Coptidis in HepG2 Cell and diabetic KK-Ay miceDrug Dev Res201677416317027045983
- ZouZYHuYRMaHFengMLiXGYeXLEpiberberine reduces serum cholesterol in diet-induced dyslipidemia Syrian golden hamsters via network pathways involving cholesterol metabolismEur J Pharmacol20167741926593426
- ChoiJSKimJHAliMYAnti-adipogenic effect of epiberberine is mediated by regulation of the Raf/MEK1/2/ERK1/2 and AMPKα/Akt pathwaysArch Pharm Res201538122153216226119076
- HeKKouSMZouZYHypolipidemic effects of alkaloids from Rhizoma Coptidis in diet-induced hyperlipidemic hamstersPlanta Med201682869069726848702
- KouSHanBWangYSynergetic cholesterol-lowering effects of main alkaloids from Rhizoma Coptidis in HepG2 cells and hypercholesterolemia hamstersLife Sci2016151506026876917
- JungHAYoonNYBaeHJMinBSChoiJSInhibitory activities of the alkaloids from Coptidis Rhizoma against aldose reductaseArch Pharm Res200831111405141219023536
- WangJLFangDCEffect of epiberberine on alpha-adrenoceptorsActa Pharm Sin1990254289292
- ChoiJSAliMYJungHAOhSHChoiRJKimEJProtein tyrosine phosphatase 1B inhibitory activity of alkaloids from Rhizoma Coptidis and their molecular docking studiesJ Ethnopharmacol20151711283626027757
- GeAHBaiYLiJAn activity-integrated strategy involving ultra-high-performance liquid chromatography/quadrupole-time-of-flight mass spectrometry and fraction collector for rapid screening and characterization of the α-glucosidase inhibitors in Coptis chinensis Franch. (Huanglian)J Pharm Biomed Anal2014100798725137652
- ChenHYYeXLCuiXLCytotoxicity and antihyperglycemic effect of minor constituents from Rhizoma Coptis in HepG2 cellsFitoterapia2012831677321968062
- KwonOJKimMYShinSHAntioxidant and anti-inflammatory effects of Rhei Rhizoma and Coptidis Rhizoma mixture on Reflux Esophagitis in ratsEvid Based Complement Alternat Med201620166113
- LiJYWangXBLuoJGKongYLSeasonal variation of alkaloid contents and anti-inflammatory activity of Rhizoma Coptidis based on fingerprints combined with chemometrics methodsJ Chromatogr Sci20155371131113925540292
- JungHAMinBSYokozawaTLeeJHKimYSChoiJSAnti-Alzheimer and antioxidant activities of Coptidis Rhizoma alkaloidsBiol Pharm Bull20093281433143819652386
- TanLLiCChenHEpiberberine, a natural protoberberine alkaloid, inhibits urease of Helicobacter pylori and jack bean: susceptibility and mechanismEur J Pharm Sci2017110778628167234
- LiLSunSWengYInteraction of six protoberberine alkaloids with human organic cation transporters 1, 2 and 3Xenobiotica201646217518326134304
- HanYLYuHLLiDIn vitro inhibition of Huanglian [Rhizoma coptidis (L.)] and its six active alkaloids on six cytochrome P450 isoforms in human liver microsomesPhytother Res201125111660166521425377
- ZhangLLiuHShaoYSelective lighting up of epiberberine alkaloid fluorescence by fluorophore-switching aptamer and stoichiometric targeting of human telomeric DNA G-quadruplex multimerAnal Chem201587173073725429435
- YiJYeXWangDSafety evaluation of main alkaloids from Rhizoma CoptidisJ Ethnopharmacol2013145130331023159469
- LuoJYYanDYangMHStudy of the anti-MRSA activity of Rhizoma coptidis by chemical fingerprinting and broth microdilution methodsChin J Nat Med201412539340024856764
- WeiLYZhangYJWeiBHEffect of comparability of Coptis chinensis and Scutellaria baicalensis on five sub enzymatic activities of liver microsomes in ratsChin J Chin Mater Med201338914261429
- GuoSLiuYLinZTaiSYinSLiuGEffects of eleutheroside B and eleutheroside E on activity of cytochrome P450 in rat liver microsomesBMC Complement Altern Med20141411724383621
- WuYLiuRJGuPHighly sensitive method for simultaneous determination of nine alkaloids of Shuanghua Baihe tablets in human plasma by LC-MS/MS and its applicationJ Chromatogr201510078192
- ChengMLLiuRJWuYLC-MS/MS determination and urinary excretion study of seven alkaloids in healthy Chinese volunteers after oral administration of Shuanghua Baihe tabletsJ Pharm Biomed Anal2015118899526519688
- LiuYTHaoHPXieHGExtensive intestinal first-pass elimination and predominant hepatic distribution of berberine explain its low plasma levels in ratsDrug Metab Dispos201038101779178420634337
- KheirMMWangYHuaLAcute toxicity of berberine and its correlation with the blood concentration in miceFood Chem Toxicol20104841105111020138204
- MaJYFengRTanXSExcretion of berberine and its metabolites in oral administration in ratsJ Pharm Sci2013102114181419224006193
- PanGYWangGJLiuXDFawcettJPXieYYThe involvement of P-glycoprotein in berberine absorptionPharmacol Toxicol200291419319712530470
- SunSWangKLeiHInhibition of organic cation transporter 2 and 3 may be involved in the mechanism of the antidepressant-like action of berberineProg Neuropsychopharmacol Biol Psychiatry20144914371624246570
- YuSYuYLiuLIncreased plasma exposures of five protoberberine alkaloids from Coptidis Rhizoma in streptozotocin-induced diabetic rats: is P-GP involved?Planta Med201076987688120108175
- PergolizziJVJrLabhsetwarSAPuenpatomRAJooSBen-JosephRHSummersKHPrevalence of exposure to potential CYP450 pharmacokinetic drug-drug interactions among patients with chronic low back pain taking opioidsPain Pract201111323023920807350
- LiuYFlynnTJXiaMWiesenfeldPLFergusonMSEvaluation of CYP3A4 inhibition and hepatotoxicity using DMSO-treated human hepatoma HuH-7 cellsCell Biol Toxicol2015314–522123026377104
- YangXYYeJSunGXIdentification of metabolites of epiberberine in rat liver microsomes and its inhibiting effects on CYP2D6Chin J Chin Mater Med2014391938553859
- LuHFangZZCaoYFIsoliquiritigenin showed strong inhibitory effects towards multiple UDP-glucuronosyltransferase (UGT) isoform-catalyzed 4-methylumbelliferone (4-MU) glucuronidationFitoterapia201384120821223237733