
Abstract
Background
Nonalcoholic fatty liver disease (NAFLD) has been considered the most commonly occurring chronic hepatopathy in the world. Ghrelin o-acyltransferase (GOAT) is an acylation enzyme which has an acylated position 3 serine on ghrelin. Recent investigation revealed that activated autophagy could attenuate liver steatosis. The aim of this study was to explore therapeutic roles that inhibit GOAT exerted in NAFLD, and its potential association with autophagy.
Materials and methods
Human LO2 cells were pretreated with siRNA-GOAT to induce liver steatosis using free fatty acids (FFAs). A chronic NAFLD model was established by feeding male mice C57bl/6 with high-fat diet (HFD) for 56 days with GO-CoA-Tat administrated subcutaneously. Lipid droplets were identified by Oil Red O stains. Body weight (BW) of mice was measured every week. Autophagy, tumor necrosis factor-α (TNF-α), interleukin-6 (IL-6), serum biochemical indicators (glucose [Glu], total cholesterol [TC], triglyceride [TG], aspartate aminotransferase [AST], alanine aminotransferase [ALT]) and signaling pathway proteins of phosphorylated AMPK–mTOR were measured.
Results
The TG contents of the FFA and HFD groups were decreased by the inhibition of GOAT. Among mice treated with GO-CoA-Tat and siRNA-GOAT, IL-6 and TNF-α concentrations were remarkably decreased. Indicators of liver injury such as ALT and AST were also remarkably decreased among mice treated with GO-CoA-Tat. Likewise, GO-CoA-Tat significantly reduced the BW of mice and serum TG, TC and Glu. Autophagy was induced along with reduced lipids in the cells of the FFA and HFD groups. The inhibition of GOAT upregulated autophagy via AMPK–mTOR restoration.
Conclusion
These results indicate that the inhibition of GOAT attenuates lipotoxicity by autophagy stimulation via AMPK–mTOR restoration and offers innovative evidence for using GO-CoA-Tat or siRNA-GOAT in NAFLD clinically.
Introduction
Nonalcoholic fatty liver disease (NAFLD) is the most prevalent chronic liver disease worldwide and is an important risk factor for the development of liver fibrosis and cirrhosis.Citation1 Currently, it is estimated that more than 46% of adults in the US are suffering from liver steatosis.Citation2 Liver steatosis is closely associated with a group of metabolic disorders, including, type 2 diabetes and obesity.Citation3 Increased lipids is not offset by increased secretion of lipoproteins or by mitochondrial oxidation.Citation4 Human fatty liver results from reduced turnover of liver fat granules.Citation5 In addition, currently, NAFLD cannot be cured effectively by any one therapy alone if the patients do not modify their lifestyles.Citation6 Consequently, innovative and effective therapies need to be developed urgently.
Ghrelin o-acyltransferase (GOAT), a member of membrane-bound O-acyltransferases family, is essential for octanoylation of ghrelin, which is required for active ghrelin to bind to and activate its receptor.Citation7 GOAT inhibitor GO-CoA-Tat, a peptide-based bisubstrate analog, can reduce weight gain and improve glucose (Glu) tolerance in wild-type mice or reduce food intake.Citation8,Citation9 Several other effects of GOAT have been reported, including an involvement in Glu homeostasis, bile acid reabsorption and altered responsiveness to salt and lipid taste.Citation10–Citation12 GOAT may be involved in insulin resistance (IR), inflammatory reaction and lipid metabolism disorders. Each of these aspects exerts an essential role in pathogenic process and mechanism of NAFLD.Citation13,Citation14 Consequently, further investigation of the role exerted by GOAT in NAFLD as well as the mechanism of this process, are urgently needed.
Autophagy, known as a degrading process in lysosomes, can regulate cellular lipid metabolism, ameliorate the state of IR and mediate overactive innate immunoreaction.Citation15 Recently, a few studies revealed its roles in pathogenic process of NAFLD.Citation15,Citation16 The association between NAFLD and autophagy was further uncovered by progress made on autophagy. Lipid metabolism was probably stimulated by autophagy which exhibited potential in the development of innovative therapies.Citation16 It is reported by many studies that autophagy was extremely likely to be associated with variations in pathology and physiology during NAFLD and autophagic activity was decreased by high-fat diet (HFD) or chronically accumulated lipids.Citation15–Citation17
However, how GOAT regulates metabolisms of lipids is unclear. Related studies on NAFLD models of rodents are rare. Whether GOAT is related to autophagic process which ameliorates hepatic damage resulting from NAFLD is still unrevealed. The current study is aimed at investigating whether the inhibition of GOAT decreased triglyceride (TG) levels and inflammatory damage to the liver during NAFLD and whether autophagy participated in this physiological activity via AMPK–mTOR pathway.
Our results showed that the inhibition of GOAT increased lipid droplet turnover of hepatocytes via pathway mediated by autophagy. It was demonstrated by a mouse NAFLD model in the current study that autophagy was related to the inhibition of lipid removal in the liver induced by GOAT, which explained that the inhibition of GOAT was capable of relieving steatosis. Furthermore, autophagy induced by the inhibition of GOAT was proved to be immediately linked to in vivo and in vitro metabolisms of lipids by utilizing pharmacological and genetic inhibitors of autophagy. In the end, it was found that AMPK–mTOR signaling pathway revealed the possible mechanism of the inhibition of GOAT promoting autophagy.
Materials and methods
Reagents
GO-CoA-Tat was provided by Phoenix Biotech (Beijing, China). Rapamycin, 3-methyladenine (3-MA), palmitic acid (PA), oleic acid (OA) and bovine serum albumin (BSA) were purchased from Sigma-Aldrich Co. (St Louis, MO, USA). The antibodies provided by Kaiji (Nanjing, China) included the following: mTOR, phosphorylated mTOR (p-mTOR), total AMPK, phosphorylated AMPK (p-AMPK) at Thr172, GOAT, Beclin-1 and LC3.
Cell culture and treatment
Human LO2 cells (obtained from Chinese Academy of Science Committee Type Culture Collection Cell Bank, Shanghai, China) were kept in Dulbecco’s Modified Eagle’s Medium (DMEM; Thermo Fisher Scientific, Waltham, MA, USA) containing 1% of penicillin–streptomycin (Thermo Fisher Scientific) and 10% of fetal bovine serum (Thermo Fisher Scientific) under the condition of 5% CO2 at 37°C. LO2 cells were exposed to 1 mM free fatty acid (FFA) mixture (oleate: palmitate, 2:1) for 24 hours to induce steatosis.
siRNA-GOAT was utilized to pretreat the cells with a final concentration of 10 nM for 1 hour, and then the cells were stimulated by FFA. The cells were grouped as follows: 1) normal control (NC) group, exclusive phosphate buffer saline (PBS) treatment as vehicle; 2) siRNA-GOAT group, treatment containing PBS dilution of siRNA-GOAT under the final concentration of 10 nm; 3) FFA group, 24 hours of treatment using 1 mM mixed FFA and 10 nm siRNA-GOAT.
Animals and treatment
Male mice C57bl/6 (8–10 weeks old, 23.0±2.0 g) were purchased from Shanghai Lingchang Biology Technology Co. Ltd. (Shanghai, China). HFD (D12492) (Shanghai QF Biosciences, Shanghai, China) was utilized with the aim of inducing steatohepatitis and obesity. The experimental animals were kept under the condition of 23°C, 50% humidity and a 12-hour cycle of light and dark. The approval of the Animal Care and Use Committee of Shanghai Fudan University was obtained for all protocols involved in animals and according to the “Guidelines for the Care and Use of Laboratory Animals” published by the National Academy Press (NIH Publication No 85-23, revised 1996).
A total of 24 mice were grouped equally at random as follows: 1) saline solution group, the animals received normal mice diet and intraperitoneal injection of saline solution every day from the third to fourth week; 2) GO-CoA-Tat group, the animals received normal mice diet throughout the 8 weeks and intraperitoneal injection of GO-CoA-Tat with the dosage of 96 µg/kg from the third to the fourth week; 3) HFD group, the animals received HFD throughout the 8 weeks; 4) HFD+GO-CoA-Tat group, the animals received HFD throughout the 8 weeks and intraperitoneal injection of GO-CoA-Tat with the dosage of 96 µg/kg from the third to fourth week. On the eighth week, all subject animals were subjected to euthanasia with blood and liver specimens collected for molecular, serum and histological analyses and tissues for TG and histological estimations and reverse transcriptase polymerase chain reaction (RT-PCR), Western blot and electron microscope analyses.
Biochemical assays
The serous levels of Glu, total cholesterol (TC), aspartate aminotransferase (AST) and alanine aminotransferase (ALT) were determined using kits for microplate tests from Jiancheng (Nanjing, China). Enzyme-linked immunosorbent assay (ELISA) kits (R&D Systems, Inc., Minneapolis, MN, USA) were applied for the detection of proinflammatory factors including interleukin-6 (IL-6) and tumor necrosis factor-α (TNF-α) of LO2 cells. Kits for microplate tests from Jiancheng were used to determine TG levels of LO2 cells and mice livers.
Histopathological sections
In each subject animal, the intermediate part of the left lobe of the liver was collected and sliced before perfusion using 4% paraformaldehyde for 24 hours at least. Subsequently, paraffin was used to embed the fixed tissues, and Oil Red O (Sigma-Aldrich Co.) was used to stain the slices with the thickness of 5 µm to observe the intracellular lipid droplets with a light microscope.
Oil Red O stains
The levels of lipids were assessed by Oil Red O stains on cells. Initially, 4% paraformaldehyde was used to fix the cells for 20 minutes. Subsequently, Oil Red O was utilized to stain them for 15 minutes under ambient temperature, and then the cells were washed twice with PBS. Finally, an optical microscope was utilized to observe the lipid droplets inside cells.
Immunofluorescence stains
Cells were fixed with 4% paraformaldehyde for 20 minutes. About 5% of BSA was utilized to block nonspecific sites, and anti-LC3II antibody with the dilution ratio of 1:50 was applied to the cell incubation for 12 hours under the temperature of 4°C. After that, PBS was utilized to wash the cells thrice for 5 minutes, and anti-rabbit secondary antibody was used to incubate them for 30 minutes. Subsequently, nuclei of the cells were stained by 4′,6-diamidino-2-phenylindole (DAPI; Thermo Fisher Scientific).
RNA isolation and real-time quantitative reverse transcriptase polymerase chain reaction (qRT-PCR)
After isolation of total RNAs, QuantiTect SYBR Green PCR Kit (Qiagen NV, Venlo, the Netherlands) was utilized to perform qRT-PCR based on the manufacturer’s instruction. qRT-PCR was utilized to evaluate the expression profiles of LO2 cells and liver tissues. TRIzol reagent (Tiangen Biotech, Beijing, China) was applied to total RNA extraction from cells and frozen liver tissue specimens, and a 7900HT Fast Real-Time PCR system (Thermo Fisher Scientific) was used to perform qPCR using SYBR Green Quantitative RT-PCR to profile the expressions of relevant genes based on the instructions of SYBR Premix EX Taq (TaKaRa Biotechnology, Dalian, China). Sequences of primers are available on request. The primer sequences are summarized in .
Table 1 The primer sequences of the related genes
siRNA transfection
Specific siRNAs against objective genes or negative control siRNAs (AllStars Negative Control siRNA; Qiagen NV) with no silencing activity to any anthropic genes were used to treat the LO2 cells. In the current study, to characterize the role of siRNA-targeting GOAT in LO2 cells, we designed three siRNA-GOATs based on the sequence deposited in Shanghai GenePharma Co., Ltd (Shanghai, China) () and synthesized three DNA fragments encoding the siRNA. All three siRNA-GOATs were shown to cause a significant decrease in GOAT mRNA and protein expression (data shown behind), so, we used the mixture of the three siRNA-GOATs to treat LO2 cells.
Table 2 Sequences of siRNA molecules used in this study
siRNAs were transfected according to the manufacturer’s protocol (Santa Cruz Biotechnology Inc., Dallas, TX, USA). The transfection medium was utilized to dilute all the siRNAs till the final concentration of 10 nM. Subsequently, 5 µL of Lipofectamine 2000 transfection reagent was added into the siRNA dilution for 20 minutes of incubation under the ambient temperature. After being washed by PBS twice, the cells were treated by siRNA mixture for 8 hours without penicillin or streptomycin. Subsequently, the treatment medium was switched into growth medium again, and the cells were cultured for 48 hours before the treatment of NaHs and fat emulsion.
Western blot
RIPA containing protease inhibitor was used to lyse the collection of LO2 cells and liver tissue specimens, and bicinchoninic acid (BCA) protocol was applied to measure protein concentrations. Initially, 8%–12% of sodium dodecyl sulfate (SDS)-polyacrylamide gel was utilized to isolate protein mixture. Subsequently, the protein spots in gel were transferred onto polyvinylidene difluoride (PVDF) membranes (ISEQ00010 0.22 mm; EMD Millipore, Billerica, MA, USA), which were successively incubated using relevant first antibody (LC3 [1:500], Beclin-1 [1:1,000], total AMPK [1:500], mTOR [1:500], p-AMPK [1:500]) and secondary antibody. In the end, the Odyssey two-color infrared laser imaging system (LI-COR Biosciences, Lincoln, NE, USA) was utilized to detect the protein levels.
Electron microscopy
LO2 cells were treated as described above. A transmission electron microscope (Tecnai; FEI, Portland, OR, USA) was used to examine the cell sections under the voltage of 160 kV, and an Electron Microscopy Film 4489 (Kodak, New York, NY, USA, ESTAR thick base) was used to obtain the electronic micrographs and print them on photographic paper.
Statistical analyses
The expression pattern of all data are mean ± SD. Kruskal–Wallis test was used to compare multiple groups with non-normal distribution. Mann–Whitney U-test was used to compare two groups with non-normal distribution. Student’s t-test was used to assess the differences between two groups, and one-way analysis of variance (ANOVA) and Tukey’s t-test were utilized to perform multiple comparison to normal distribution. Graphpad Prism 6.0 software (GraphPad Software, La Jolla, CA, USA) was applied to the conduction of statistical analyses. A P-value of <0.05 was considered statistically significant.
Results
siRNA-GOAT decreased GOAT mRNA and protein expression in LO2 cells
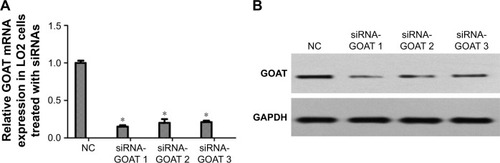
LO2 cells were subjected to the treatment of negative control siRNA or siRNAs specific for GOAT genes. RT-PCR was used to quantify the GOAT mRNA 48 hours after the cells were transfected with respective reagents. We found that siRNAs caused a significant decrease in GOAT mRNA expression (). It was very important whether relevant protein expressions were also significantly decreased after their genes were silenced by siRNA treatment. Therefore, we measured GOAT protein levels in LO2 cells transfected with siRNAs. The proteins isolated from cells in tests were measured using Western blot with specific GOAT antibody. We found that levels of GOAT protein were reduced remarkably among cells subjected to siRNA-GOAT treatment (). Consequently, it was concluded that siRNA-GOAT resulted in decreased mRNA transcription accompanied by GOAT protein.
Figure 1 Effect of siRNAs on reducing GOAT expression in mRNA and protein levels.
Abbreviations: GAPDH, glyceraldehyde phosphate dehydrogenase; GOAT, ghrelin o-acyltransferase; NC, normal control.
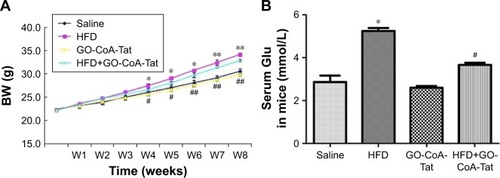
Inhibition of GOAT reduced body weight (BW) of mice and maintained Glu homeostasis
C57bl/6 mice fed with HFD exhibited markedly higher BW than those fed with normal diet during the fourth to eighth week (). After 4 weeks of treatment with GO-CoA-Tat, BW of mice started decreasing remarkably in comparison to animals fed with HFD, and this tendency sustained throughout the rest of intervention (). The fasting blood Glu among animals subjected to HFD detected at week 8 was higher than that of the saline solution group. Animals subjected to GO-CoA-Tat exhibited markedly better tolerance to Glu than HFD-fed mice ().
Figure 2 Effect of GO-CoA-Tat on reducing BW and maintaining Glu homeostasis in C57bl/6 mice.
Abbreviations: BW, body weight; HFD, high-fat diet; Glu, glucose; W, week.
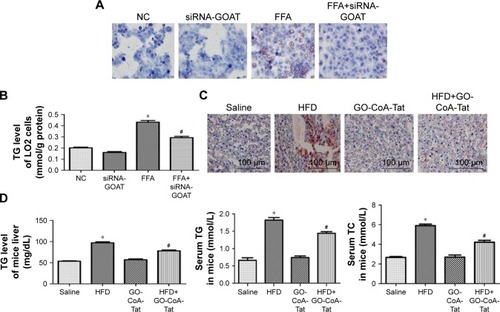
Inhibition of GOAT resulted in reduction in accumulated lipids
It was revealed by Oil Red O stains and determined quantitatively by TG test kits as well as mice liver tissues that the accumulated lipids inside the cells were remarkably decreased by siRNA-GOAT before the stimulation with FFA (). In fact, animals fed with HFD were subjected to two dosages of GO-CoA-Tat treatment (32 µg/kg, 96 µg/kg) in pre-experiment, and the results revealed that animals subjected to higher dosage exhibited more significant effects. Consequently, the dosage of 96 µg/kg GO-CoA-Tat was utilized during the next experiment. HFD led to a higher liver TG level, higher serum TC and TG level in comparison to those of animals subjected to saline treatment, which were remarkably decreased due to GO-CoA-Tat treatment ().
Figure 3 Inhibition of GOAT reduced lipid accumulation in vitro and in vivo.
Abbreviations: FFA, free fatty acid; GOAT, ghrelin o-acyltransferase; HFD, high-fat diet; NC, normal control; OA, oleic acid; PA, palmitic acid; TC, total cholesterol; TG, triglyceride.
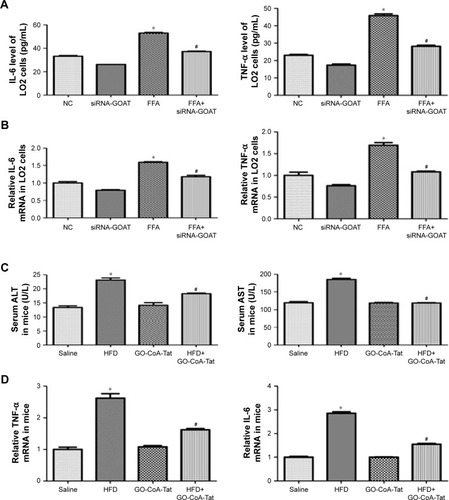
Inhibition of GOAT relieved the livers inflammatory reaction resulting from the toxicity of lipids
Results of RT-PCR and ELISA showed that, after FFA treatment, proinflammatory cytokine transcriptions and expressions (IL-6 and TNF-α) were remarkably elevated. The quantities of protein and mRNA were both decreased after siRNA-GOAT treatment (). Among animals in the HFD group, the increased serous ALT and AST levels indicated that hepatic damages were remarkably decreased by the treatment of GO-CoA-Tat (). It was revealed that mRNA quantities of IL-6 and TNF-α were remarkably elevated among animals fed with HFD and decreased among those subjected to HFD and GO-CoA-Tat ().
Figure 4 Inhibition of GOAT attenuated hepatic inflammation induced by lipotoxicity.
Abbreviations: ALT, alanine aminotransferase; AST, aspartate aminotransferase; ELISA, enzyme-linked immunosorbent assay; FFA, free fatty acid; GOAT, ghrelin o-acyltransferase; HFD, high-fat diet; IL-6, interleukin-6; NC, normal control; RT-PCR, reverse transcriptase polymerase chain reaction; TNF-α, tumor necrosis factor-α.
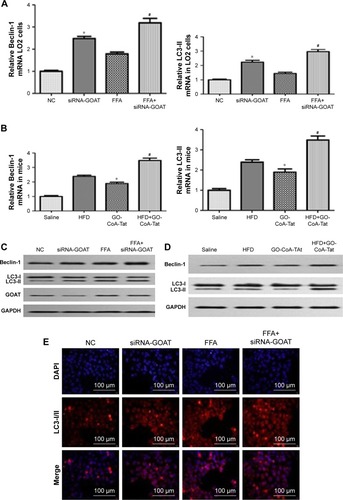
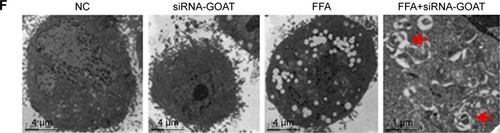
Clearance of lipids resulting from inhibited GOAT was accompanied by enhanced autophagic activity
The association between autophagic activity and clearance of lipids was examined in four ways: electron microscopy, immunofluorescence, RT-PCR and Western blot. Elevated mRNA transcription level of Beclin-1 and LC3-II existed in animals treated by FFA or HFD, which were subsequently induced by siRNA-GOAT in vitro or GO-CoA-Tat in vivo (). The protein levels of Beclin-1 and LC3-II were similar to the results of their mRNA transcription level (). Immunofluorescence of LC3-II revealed elevated autophagic flux among the FFA group, and siRNA-GOAT in vitro treatment further activated it (). It was revealed by electron microscopy that cells subjected to siRNA-GOAT co-treatment in vitro exhibited increasing autophagosome quantity ().
Figure 5 GOAT inhibition-induced lipid clearance is associated with a concomitant increase in autophagy in LO2 cells or mice livers.
Abbreviations: DAPI, 4′,6-diamidino-2-phenylindole; FFA, free fatty acid; GAPDH, glyceraldehyde phosphate dehydrogenase; GOAT, ghrelin o-acyltransferase; HFD, high-fat diet; LC3, microtubule-associated protein 1 light chain 3; NC, normal control; RT-PCR, reverse transcriptase polymerase chain reaction.
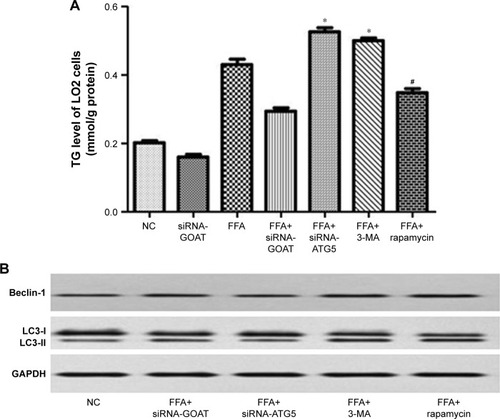
The decrease in lipid droplet quantity was reversed by inhibited autophagy
With the aim of investigating whether TG reduction in cells due to siRNA-GOAT was reversed by autophagy inhibition, LO2 cells were subjected to treatment of 1 µM rapamycin (autophagic enhancer), 10 mM 3-MA (autophagic inhibitor) and 10 nM siRNA-ATG5. The intracellular lipid levels in the FFA+siRNA-ATG5 and FFA+3-MA groups were superior to those in the FFA+siRNA-GOAT group in spite of the significant reduction in accumulated lipids in LO2 cells due to rapamycin (). In comparison to the FFA+siRNA-GOAT group, the FFA+siRNA-ATG5 and FFA+3-MA groups exhibited decreased LC3-II levels. Conversely, the FFA+rapamycin group exhibited an increase in LC3-II level, which indicated that the enhanced autophagic activity resulting from siRNA-GOAT was restrained by siRNA-ATG5 or 3-MA and augmented by rapamycin stimulation ().
Figure 6 Autophagy inhibition reversed the reduction in intracellular lipid droplets.
Abbreviations: ATG, autophagy-associated gene; FFA, free fatty acid; GAPDH, glyceraldehyde phosphate dehydrogenase; GOAT, ghrelin o-acyltransferase; LC3, microtubule-associated protein 1 light chain 3; MA, methyladenine; NC, normal control; TG, triglyceride.
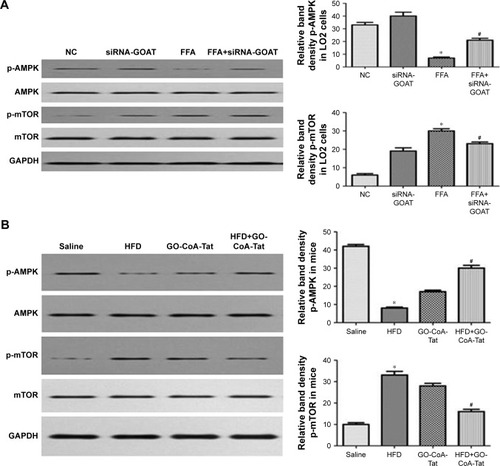
GO-CoA-Tat or siRNA-GOAT enhanced autophagic activity partially through restoring AMPK–mTOR signaling pathway
It was revealed previously that autophagy was impaired by activated mTOR and induced by pharmacological mTOR inhibitors in most models. In the current study, p-AMPK was significantly inhibited by FFA or HFD and reconstructed by GO-CoA-Tat or siRNA-GOAT with unaffected entire AMPK level. According to , mTOR that acted as one of the AMPK downstream molecules, accompanied by its phosphorylated form (p-mTOR), was found in LO2 cells or subject mice. The phosphorylation in subject animals and cells was restrained by GO-CoA-Tat or siRNA-GOAT. Consequently, it was verified that the toxicity of lipids was alleviated by GO-CoA-Tat or siRNA-GOAT which enhanced autophagic activity through reconstructing AMPK–mTOR signaling pathway.
Figure 7 siRNA-GOAT or GO-CoA-Tat promoted autophagy partly via the restoration of AMPK–mTOR signaling pathway both in vitro and in vivo.
Abbreviations: AMPK, AMP-activated protein kinase; FFA, free fatty acid; GAPDH, glyceraldehyde phosphate dehydrogenase; GOAT, ghrelin o-acyltransferase; HFD, high-fat diet; mTOR, mammalian target of rapamycin; NC, normal control; p-AMPK, phosphorylated AMPK; p-mTOR, phosphorylated mTOR.
Discussion
Since obesity is becoming increasingly common, NAFLD has drawn much attention worldwide, and the risk of NAFLD increases with older age.Citation18 NAFLD is initially quiet hepatopathy, which gradually turns into inflammatory reaction, fibrosis and liver cancer in the end. In addition, NAFLD exhibits close association with risk factors of coronary artery disease (CAD), for example, metabolic syndrome, diabetes and dyslipidemia, which are regarded as the major causes of death.Citation19 Nevertheless, efficient approaches for preventing and attenuating NAFLD are extremely rare.
Our study found that intraperitoneal administration of GO-CoA-Tat could significantly reduce weight gain in HFD mice, and maintain Glu homeostasis (). GOAT inhibitor GO-CoA-Tat, which was introduced by Barnett et al,Citation8 showed GOAT was inhibited in cell lines stably expressing GOAT and preproghrelin as well as in vivo in mice. GO-CoA-Tat resulted in reduction of weight gain and improvement in Glu tolerance among wild-type mice, and it could reduce food intake.Citation9 GOAT seems to be involved in NAFLD progression and fatty degeneration. The GOAT-ghrelin system was probably related to inflammatory reaction, dysfunction of lipid metabolism and IR, and all of which entirely exert essential roles in NAFLD pathogenic property.Citation13,Citation14 However, the principle of GO-CoA-Tat valued in NAFLD treatment was mostly unrevealed, particularly the effect of reducing accumulated lipids. In the current study the inhibition of GOAT was initially demonstrated to reduce accumulated lipids by promoting autophagic activity, partially through restoring the AMPK–mTOR signaling pathway.
This study verified that GO-CoA-Tat or siRNA-GOAT effectively decreased intracellular lipids () and increased autophagic flux () in LO2 cells and in mice livers. Elevated serum ALT and AST levels among HFD animals were effectively reduced after the administration of GO-CoA-Tat, indicating that the GO-CoA-Tat alleviated the chronic hepatic injury. Taking the improved analyses of histology into consideration (), obviously, the hepatic injury resulting from NAFLD was alleviated by GO-CoA-Tat at least in regard to histology and biochemistry. The miRNA and protein quantities of IL-6 and TNF-α induced by GO-CoA-Tat were both significantly decreased while NAFLD was developing (). The “obvious” property of GO-CoA-Tat inhibiting hepatic inflammation partially resulted from the fact that GO-CoA-Tat not only directly inhibited liver inflammatory reactions but also induced more variations in metabolism under HFD.
However, whether the inhibition of GOAT was related to autophagy when hepatic injuries induced by NAFLD were amelior not revealed. siRNA-GOAT reduced accumulated lipids in cells, while autophagy was increased accordingly both in vivo and in vitro (). LO2 cells were subjected to pretreatment using siRNA-GOAT with gradient concentrations ranged from 5 to 20 nM, and then stimulated by mixed FFA during pre-experiments. The levels of LC3-II protein and TG inside the cells were determined although the results revealed that cells subjected to the treatment of 10 nM siR-NA-GOAT exhibited lowest lipid and highest LC3-II protein levels (data not shown). Consequently, it was speculated that the induction of autophagy and reduced lipids were partially associated with siRNA-GOAT concentrations.
The mildly increased LC3-II expression among animals fed with HFD and cells treated by FFA was remarkably promoted by co-treatment of GO-CoA-Tat or siRNA-GOAT. Autophagy was promoted among cells treated by FFA and animals fed with HFD for a short period, by which the lipids were digested partially through mTOR complex. Conversely, autophagy was inhibited among cells treated by FFA and animals fed with HFD for a long period, and the accumulation of lipids was accelerated meanwhile.Citation20 The lipid accumulation due to alcoholic fatty liver and NAFLD was reduced by autophagy.Citation16,Citation21,Citation22 Autophagic vacuoles took up cholesterol and TG and transferred it to lysosomes which subsequently degraded these molecules into FFA in the lipophagic process. The redundant lipids were accumulated due to impairment of lipophagic activity.Citation23 In the current study, it was revealed that autophagy was induced when the accumulated lipids in cells were reduced. Autophagy inhibitor and stimulator (3-MA and rapamycin, respectively) were used to demonstrate that autophagy is essential for reduction of intracellular fat accumulation (). In accordance with expectations, TG level was elevated and autophagy was restrained by 3-MA and siRNA-ATG5. Conversely, autophagy was induced and TG quantity was obviously reduced due to rapamycin. The newly observed phenomenon that autophagy regulated the storage of lipids in cells was named as macrolipophagy which existed exclusively in the liver. The storage of lipids in cells was increased by 3-MA which inhibited autophagy pharmacologically and knocking down of ATG genetically.Citation21 Lipids were accumulated excessively, and sequentially NAFLD developed due to ablative macrolipophagy.Citation24 To sum up, it was demonstrated by the abovementioned literature that autophagy exerted an essential role in maintaining intra-hepatic lipid homeostasis.
AMPK pathway was subjected to the inhibition of fat accumulation and oxidative stress resulting from NAFLD,Citation25,Citation26 which was shown to play important roles in the initiation and progression of NAFLD. Furthermore, AMPK acts in the regulation of autophagy, which is activated by the elevation of the AMP/ATP ratio,Citation27 according to the upregulation of autophagy under conditions of starvation, which activates autophagy. Since GOAT is an energy regulator which stimulates appetite, we hypothesized that AMPK may be the connection mechanism between GO-CoA-Tat and autophagy. In the current study, p-AMPK was significantly decreased due to NAFLD, while GO-CoA-Tat or siRNA-GOAT reestablished the quantity of phosphorylated kinases without disturbing its total form, which was in accordance with previous studies.Citation25,Citation28 HFD or FFA dramatically reduced p-AMPK, while GO-CoA-Tat or siRNA-GOAT recovered it without any effect on the quantity of total AMPK. As shown in , mTOR that acted as one of the AMPK downstream molecules, accompanied by its phosphorylated form (p-mTOR), was found in LO2 cells or subject mice livers. The phosphorylation of mTOR was inhibited in vitro as well as in vivo by GO-CoA-Tat or siRNA-GOAT. It was verified that the toxicity of lipids was alleviated by GO-CoA-Tat or siRNA-GOAT which enhanced autophagic activity through reconstructing AMPK–mTOR signaling pathway.
Li et alCitation29 have shown that ghrelin increases hepatosteatosis by increasing lipogenesis. As mentioned earlier, the inhibition of GOAT would decrease ghrelin. Our study showed that the inhibition of GOAT decreased hepatic lipotoxicity. However, other studies demonstrated that ghrelin increased lipophagy and reduced hepatic lipogenesis.Citation25,Citation30 We have to take into account the differences among these reports. Therefore, more studies are needed for further investigating the effect of ghrelin GOAT system on NAFLD. There are limitations in the current study. The products of oxidative reactions in mouse liver specimens and LO2 cells were not detected. Lipid dyes commonly applied to immuno-fluorescence experiments were probably more appropriate for manifesting the association between lipid droplets and autophagy. Other ways of inhibiting autophagy, for example, knocking out relevant genes, were probably more convincing. It is particularly worth noting that NAFLDCitation34–Citation37 was possibly treated by stimulating autophagy pharmacologicallyCitation31,Citation32 and hormonally.Citation33
Conclusion
We have demonstrated that GO-CoA-Tat or siRNA-GOAT alleviated hepatic steatosis and inflammation induced by NAFLD through restoring AMPK–mTOR signaling pathway. Due to the fact that no drugs have been proved as effective in NAFLD (eg, chemicals that regulate energy metabolisms), the inhibition of GOAT, exhibit a very promising prospect in preventing and treating NAFLD.
Acknowledgments
The study was supported by research grants from the following: Outstanding Young Talent Training Program of Jinshan District Health and Family Planning Commission, Shanghai, China (no JSYQ201606); Youth Research Project of Shanghai Municipality Health and Family Planning Commission, China (no 20154Y0096); Surface Research Project of Jinshan District Health and Family Planning Commission, Shanghai, China (no JSKJ-KTMS-2015-02); and Key Clinical Discipline Construction of Jinshan District, Shanghai, China (no JSZK2015A06).
Disclosure
The authors report no conflicts of interest in this work.
References
- AdamsLALympJFSt SauverJThe natural history of nonalcoholic fatty liver disease: a population-based cohort studyGastroenterology2005129111312116012941
- WilliamsCDStengelJAsikeMIPrevalence of nonalcoholic fatty liver disease and nonalcoholic steatohepatitis among a largely middle-aged population utilizing ultrasound and liver biopsy: a prospective studyGastroenterology2011140112413120858492
- BerlangaAGuiu-JuradoEPorrasJAAuguetTMolecular pathways in non-alcoholic fatty liver diseaseClin Exp Gastroenterol2014722123925045276
- KawanoYCohenDEMechanisms of hepatic triglyceride accumulation in non-alcoholic fatty liver diseaseJ Gastroenterol201348443444123397118
- GreenbergASColemanRAKraemerFBThe role of lipid droplets in metabolic disease in rodents and humansJ Clin Invest201112162102211021633178
- FerrePFoufelleFHepatic steatosis: a role for de novo lipogenesis and the transcription factor SREBP-1cDiabetes Obes Metab201012suppl 2839221029304
- InuiAAsakawaABowersCYGhrelin, appetite, and gastric motility: the emerging role of the stomach as an endocrine organFASEB J200418343945615003990
- BarnettBPHwangYTaylorMSGlucose and weight control in mice with a designed ghrelin O-acyltransferase inhibitorScience201033060111689169221097901
- TeuffelPWangLPrinzPTreatment with the ghrelin-O-acyltransferase (GOAT) inhibitor GO-CoA-Tat reduces food intake by reducing meal frequency in ratsJ Physiol Pharmacol201566449350326348074
- ZhaoTJLiangGLiRLGhrelin O-acyltransferase (GOAT) is essential for growth hormone-mediated survival of calorie-restricted miceProc Natl Acad Sci U S A2010107167467747220231469
- KangKSchmahlJLeeJMMouse ghrelin-O acyltransferase (GOAT) plays a critical role in bile acid reabsorptionFASEB J201226125927121965605
- CaiHCongWNDaimonCMAltered lipid and salt taste responsivity in ghrelin and GOAT null micePLoS One2013810e7655324124572
- YangJBrownMSLiangGGrishinNVGoldsteinJLIdentification of the acyltransferase that octanoylates ghrelin, an appetite-stimulating peptide hormoneCell2008132338739618267071
- GualilloOLagoFDieguezCIntroducing GOAT: a target for obesity and anti-diabetic drugs?Trends Pharmacol Sci200829839840118606462
- AmirMCzajaMJAutophagy in nonalcoholic steatohepatitisExpert Rev Gastroenterol Hepatol20115215916621476911
- SinhaRAFarahBLSinghBKCaffeine stimulates hepatic lipid metabolism by the autophagy-lysosomal pathway in miceHepatology20145941366138023929677
- ParkHWLeeJHCalcium channel blockers as potential therapeutics for obesity-associated autophagy defects and fatty liver pathologiesAutophagy201410122385238625484079
- NoureddinMYatesKPVaughnIAClinical and histological determinants of nonalcoholic steatohepatitis and advanced fibrosis in elderly patientsHepatology20135851644165423686698
- KimDChoiSYParkEHNonalcoholic fatty liver disease is associated with coronary artery calcificationHepatology201256260561322271511
- LiuHYHanJCaoSYHepatic autophagy is suppressed in the presence of insulin resistance and hyperinsulinemia: inhibition of FoxO1-dependent expression of key autophagy genes by insulinJ Biol Chem200928445314843149219758991
- SinghRKaushikSWangYAutophagy regulates lipid metabolismNature200945872421131113519339967
- DingWXLiMChenXAutophagy reduces acute ethanol-induced hepatotoxicity and steatosis in miceGastroenterology201013951740175220659474
- LiuKCzajaMJRegulation of lipid stores and metabolism by lipophagyCell Death Differ201320131122595754
- SinghRAutophagy and regulation of lipid metabolismResults Probl Cell Differ201052354620865370
- LiYHaiJLiLAdministration of ghrelin improves inflammation, oxidative stress, and apoptosis during and after non-alcoholic fatty liver disease developmentEndocrine201343237638622843123
- WinderWWHardieDGAMP-activated protein kinase, a metabolic master switch: possible roles in type 2 diabetesAm J Physiol19992771 pt 1E1E1010409121
- YinXMDingWXGaoWAutophagy in the liverHepatology20084751773178518393362
- BarazzoniRSemolicACattinMRZanettiMGuarnieriGAcylated ghrelin limits fat accumulation and improves redox state and inflammation markers in the liver of high-fat-fed ratsObesity (Silver Spring)201422117017723512916
- LiZRXuGYQinYGhrelin promotes hepatic lipogenesis by activation of mTOR-PPARγ signaling pathwayProc Natl Acad Sci U S A201411136131631316825157160
- MaoYQChengJYuFJLiHQGuoCYFanXMGhrelin attenuated lipotoxicity via autophagy induction and nuclear factor-κB inhibitionCell Physiol Biochem201537256357626329041
- Shoji-KawataSSumpterRLevenoMIdentification of a candidate therapeutic autophagy-inducing peptideNature2013494743620120623364696
- LinCWZhangHLiMPharmacological promotion of autophagy alleviates steatosis and injury in alcoholic and non-alcoholic fatty liver conditions in miceJ Hepatol201358599399923339953
- SinhaRAYouSHZhouJThyroid hormone stimulates hepatic lipid catabolism via activation of autophagyJ Clin Invest201212272428243822684107
- NiHMWilliamsJAYangHShiYHFanJDingWXTargeting autophagy for the treatment of liver diseasesPharmacol Res201266646347422871337
- CodognoPMeijerAJAutophagy in the liverJ Hepatol201359238939123669287
- DingWXInduction of autophagy, a promising approach for treating liver injuryHepatology201459134034323775596
- LomonacoRSunnyNEBrilFCusiKNonalcoholic fatty liver disease. current issues and novel treatment approachesDrugs201373111423329465