
Abstract
The reverse phase protein array (RPPA) data platform provides expression data for a prespecified set of proteins, across a set of tissue or cell line samples. Being able to measure either total proteins or posttranslationally modified proteins, even ones present at lower abundances, RPPA represents an excellent way to capture the state of key signaling transduction pathways in normal or diseased cells. RPPA data can be combined with those of other molecular profiling platforms, in order to obtain a more complete molecular picture of the cell. This review offers perspective on the use of RPPA as a component of integrative molecular analysis, using recent case examples from The Cancer Genome Altas consortium, showing how RPPA may provide additional insight into cancer besides what other data platforms may provide. There also exists a clear need for effective visualization approaches to RPPA-based proteomic results; this was highlighted by the recent challenge, put forth by the HPN-DREAM consortium, to develop visualization methods for a highly complex RPPA dataset involving many cancer cell lines, stimuli, and inhibitors applied over time course. In this review, we put forth a number of general guidelines for effective visualization of complex molecular datasets, namely, showing the data, ordering data elements deliberately, enabling generalization, focusing on relevant specifics, and putting things into context. We give examples of how these principles can be utilized in visualizing the intrinsic subtypes of breast cancer and in meaningfully displaying the entire HPN-DREAM RPPA dataset within a single page.
Introduction
Human diseases such as cancer can be incredibly complex at the molecular level, where a good understanding is needed for the signaling pathways involved. Cancer itself may initiate from DNA damage or aberrant DNA methylation affecting a key gene or set of genes, but the end result is cells showing widespread deregulation of signaling pathways and gene transcription. By incorporating multiple levels of molecular data on the diseased state of the cell, a more complete picture may emerge. With the advent of DNA microarray technologies,Citation1 it became possible for us to profile the mRNA expression of thousands of genes in a single experiment.Citation2 However, it quickly became apparent that gene transcriptional changes would represent just one level of the overall picture, as these are one step removed from signal transduction pathways.Citation3 Proteomic profiling would therefore provide another important level. In particular, the reverse phase protein array (RPPA) data platform provides relative abundances for a set of key proteins (either total proteins or posttranslationally modified proteins),Citation4 and this platform is establishing itself as a valuable research tool in human diseases.
The RPPA technology is a type of protein microarray which is the derivative of two technological advances: gene expression microarrays,Citation1 which print DNA molecules on a glass slide, and immunoassays,Citation5,Citation6 which enable the detection of protein expression through antibody and antigen interaction. MacBeath and SchireiberCitation7 were the first to develop protein microarray. They used a high-precision robot to print recombinant proteins on to glass slides, and used them for high-throughput detection of protein–protein interaction. In 2001, Brown and colleagues who invented the gene expression microarray,Citation1 reported another protein array, an antibody microarrayCitation8 that contained hundreds of antibodies printed onto glass slides for measuring the abundance of many specific proteins in complex biological samples.
In 2001, Paweletz et alCitation9 reported a new variation of protein microarray, in which tissue lysates, rather than recombinant proteins or antibodies, were spotted onto slides. They named this array “reverse phase protein microarray” in contrast to the “forward phase” antibody arrays which spot antibodies onto a slide. Other names in the literature include “lysate microarray”,Citation10 “reverse-phase lysate microarray”,Citation11 “reverse phase protein lysate microarrays”,Citation4 and “reverse phase protein array”.Citation12 Since 2011, annual RPPA workshops/conferences have been held to provide a platform for scientific communications and exchanging ideas about technical developments.Citation13 In its annual meeting in Paris, France, in October 2014, the standardized nomenclature “RPPA” was recognized. Therefore, in this review, we will use the current term “RPPA”.
The purpose of this review is to shed light on the important role that RPPA data may play in integrative molecular analyses. Here, integrative analysis may involve effective combination of results from multiple data platforms including RPPA, as well as incorporating our prior knowledge of biological systems into the interpretation of molecular-based results. For examples, we will focus here on recent cancer-related studies and datasets, in particular those initiated by The Cancer Genome Altas (TCGA).Citation14–Citation21 In addition, overall approaches for more effectively visualizing RPPA results will be discussed.
Profiling of signaling pathway using the RPPA platform
The RPPA platform involves micro-blots of protein lysates from multiple samples of tissues, cell lines, or bodily fluids (such as serum, cerebrospinal fluid, urine, saliva) on a single array, with each sample represented by at least one spot.Citation4,Citation22 Each array is then incubated with one specific antibody, in order to detect the relative expression of the corresponding protein across many samples simultaneously. Multiplexing using different antibodies on multiple arrays of the same set of lysates can be carried out to measure many proteins in a high-throughput manner. This platform has the capacity to allow hundreds and thousands of samples to be assayed. However, it requires highly specific antibodies (ie, a single specific band or predominant band to be observed by Western blot analysis) and the corresponding RPPA validation (ie, RPPA expression level correlating with Western blot).Citation12 Due to the stringent validation process, currently, most RPPA datasets often include on the order of 150–300 antibodies for total or various modified proteins. For a specific study, the set of proteins profiled can be tailored to focus on particular pathways (eg, the PI3K pathway involving multiple signaling components) or cell functions (eg, apoptosis or invasion), but RPPA also allows for more exploratory analysis leading to unexpected pathway associations.
Developing antibodies and validating them for use with RPPA are laborious processes and are currently the bottleneck of this technology. Usually, the antibody validation workflow starts with obtaining a commercially available antibody that shows a specific band or bands, followed by Western blot performed in RPPA laboratories to confirm its specificity using proper positive and negative control lysates. Antibodies with multiple nonspecific bands are excluded from further testing, while antibodies showing specificity by Western blot will then be tested further by RPPA profiling of cell lines and other types of samples. Antibodies against phosphorylated proteins need to show specificity against samples stimulated (eg, using growth factors) or inhibited (eg, using targeted inhibition) to generate phosphorylated or non-phosphorylated forms of a protein.Citation12 Antibodies for both Western blot and RPPA usually need titration for optimal results; one may typically start with the company’s recommended dilution for Western blot and adjust for better results if necessary. For RPPA, an antibody concentration four times higher than what would be required for Western blot is often used. For antibodies that require longer incubation or exposure times for Western blot, even higher concentrations would be needed for RPPA. We and others have found that ~50% of the commercially available antibodies (those showing a single band by Western blot according to the company’s data sheets) can be validated to generate reliable RPPA data.Citation4
Through DNA microarrays and (more recently) RNA sequencing, it has long been possible to comprehensively profile all mRNAs in a single experiment, where the number of data points in an mRNA expression profile (~20 K genes) would be far greater than that for an RPPA proteomic profile (usually fewer than 300 proteins). However, in terms of actual information, RPPA data and mRNA data would be highly complementary to each other. Multiple studies have shown that mRNA levels do not necessarily correlate with their corresponding protein levels.Citation23,Citation24 In principle, pathways work by protein signaling transduction events that eventually lead to changes in gene transcription.Citation3 Posttranslational modifications may not be reflected at the gene transcription level. Gene transcription data may therefore inform on the downstream effects of deregulated signaling, but the pathways occurring upstream of an observed transcriptional pattern may best be discerned using proteomics. There are analytical techniques for defining gene transcriptional signatures of deregulated pathways, but the caveat with these analyses is that they can represent indirect targets of aberrant pathway signaling, where different pathways may converge on a similar set of transcriptional targets.Citation25
The RPPA platform offers a number of unique benefits compared to other proteomics approaches.Citation22 The use of a highly specific antibody in its optimal reaction condition ensures high specificity and sensitivity. Sample handling and preparations are straightforward and simple. Rapid protein extraction and denaturation prevent degradation and preserve proteins and phosphorylated proteins, which are often labile. Large numbers of samples spotted on the same slides allow for easier and more reliable normalization, comparison, and data analyses. In addition, RPPA allows for the identification and profiling of target proteins and signaling pathways in small amounts of samples, such as biopsy specimens, tissues from laser capture microdissection (LCM), and fluorescence-activated cell sorting (FACS)-sorted minor cell populations, such as stem cells or cancer stem cells. For assaying 200–300 proteins with different abundance levels, 4–35 μg total protein would be standard when using a volume range from 20–35 μL at a concentration of 0.2–1.0 μg/μL. (The required volume needed is mostly due to evaporation rather than protein deposition on to slides, though even lower amounts of starting material may be accommodated in some cases.) The amount of protein needed per spot is very small, at the level of nanograms, where for specific proteins, the detection is at picograms to femtograms levels per spot.Citation26
In contrast to RPPA (which profiles a smaller, predefined set of proteins), there are other proteomic technologies that are more global in nature, seeking to profile as many proteins as possible.Citation27 Mass spectrometry-based approaches can potentially profile larger numbers of proteins (up to thousands of proteins in practice), including those representing potentially unanticipated proteins that may not be represented in RPPA datasets. However, one main challenge with mass spectrometry is resolving all the proteins within one sample. In whole proteomic profiling, the most abundant proteins – often uninteresting from the standpoint of the biological questions at hand, eg, actins – will compete for detection with less abundant, but more interesting, proteins, such as signaling molecules.Citation28 In addition, mass spectrometry can be resource-intensive from an informatics standpoint.Citation29 In contrast, the RPPA platform is higher throughput in terms of numbers of samples and can be analyzed with smaller sample aliquots.
RPPA requires only one primary antibody for each target protein or its modified form, in comparison to some other immunoassays such as sandwich enzyme-linked immunosorbent assay (ELISA), which requires two primary antibodies against the same proteins.Citation9 Therefore, RPPA does not have an unusually high demand for specific antibodies for a given protein or phosphorylated protein. Its quantitation, sensitivity, and multiplexing capacity also largely exceeds what can be typically achieved by Western blotting and immunohistochemistry.Citation9 Initiatives such as the Human Protein Atlas provide lists of validated antibodies for screening studies.Citation30
RPPA as a clinical proteomic platform
Conventional characterizations of cancer (including histology, tumor size, tumor grade, tumor differentiation, invasion, status of local and distant metastasis, cytogenetic analysis, and immunohistochemical staining of protein markers) do not usually detect the oncogenic signaling pathways that drive cancer growth and thus fail to identify the prime targets for intervention. The earlier-discussed benefits of RPPA, especially the ability to quantify multiple phosphorylated proteins and to probe pathway activity in very small amounts of tissue samples, make RPPA a suitable platform for patient-tailored therapy or precision medicine. For example, while standard clinical assays (immunohistochemistry and fluorescence in situ hybridization) can detect HER2 total proteins or their gene copy numbers in breast cancer, these assays do not measure HER2 protein activity and the activity of the HER2-regulated signaling pathways, which are the better indicator of the likelihood that anti-HER2 therapeutics may be effective. In 2013, the first commercial RPPA assay – the Ther-aLink HER Family Assay – was introduced by Theranostics HealthCitation31 to quantify not only the HER2 total protein and its two heterodimerizing partners and family members (EGFR and HER3), but also the specific autophorylation sites on these receptor tyrosine kinases that are indicators of activation levels. Importantly, this assay also monitors the levels of their key downstream pathways including the Akt/mTOR pathway (p-AKT, p-mTOR, p-S6, and p-4E-BP1), the MAPK pathway (p-Mek1/2, and p-Erk1/2), and the Jak/Stat pathway (p-Jak2 and p-Stat3), against which there are also US Food and Drug Administration (FDA)-approved therapeutics. This assay is now allowed by some insurance companies. Using this assay, some of the triple-negative breast cancers, which are generally not treated with targeted therapy, have been found to show enhanced activity of EGFR and HER3 as well as the PI3K-Akt pathway,Citation32 and to respond to combinatorial therapy targeting these three components in a preclinical setting. Therefore, an RPPA assay may provide actionable information for therapeutic selections.
RPPA, coupled with LCM,Citation33 has the potential to survey oncogenic pathways in selected cell compartments of clinical samples.Citation22 This is very important since cancer tissue is often an admixture of different and interacting cell sub populations (different subsets and subclones of tumor cells and the admixed stromal cells), and the cell subpopulation of therapeutic interest – such as cancer stem cells for some cancers – may constitute only a minor fraction of the cancer mass. For example, Wulfkuhle et alCitation34 used LCM-coupled RPPA and found metastasis-specific changes that occurred within a new microenvironment, but this change was not detected when whole section lysates were assayed.Citation35 Therefore, LCM-RPPA may further advance personalized therapy.
Added value of RPPA to integrative, multi-platform analysis
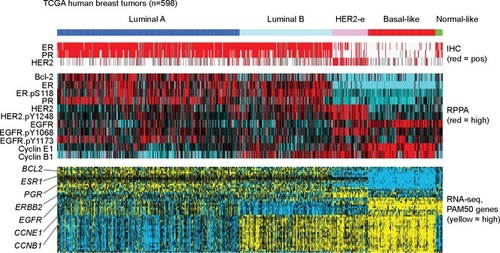
In studying diseases such as cancer, the value of integrative molecular analysis, incorporating multiple levels of data, has been well established. One well-known example involving data integration included one of the first studies (by Perou et al)Citation36 to profile breast cancers at the mRNA expression level, where mRNA data were integrated with data from immunohistochemical staining for key molecular markers of treatment response (namely, ER and HER2). This integrative analysis resulted in intrinsic molecular subtypes of human breast cancer being defined – these being eventually known as Luminal A, Luminal B, HER2-enriched, basal-like, and normal-like. Subsequent studies have defined a core set of 50 mRNAs, also known as the “PAM50” gene set,Citation37 which can be used to distinguish these intrinsic subtypes. Here, we represent these breast tumor subtypes and associated PAM50 genes in , using data generated by TCGA, including data from RPPA and from RNA sequencing. As the RPPA dataset for TCGA includes on the order of 180 protein features, not all of these would be represented in the original PAM50 gene set, though a number of key proteins are (including ER, PR, HER2, EGFR, Bcl-2, CCNE1, and CCNB1). As indicated in , RPPA features may include phosphorylated as well as total forms of a given protein. In general, shows good correlations between these select proteins and the genes, where the proteins also appear differentially expressed among the tumor subtypes originally defined using mRNA data.
Figure 1 Proteomic and transcriptomic patterns associated with the intrinsic molecular subtypes of human breast cancer.
Abbreviations: TCGA, The Cancer Genome Altas; RPPA, reverse phase protein array; HER2-e, HER2-enriched; IHC, immunohistochemistry; pos, positive; ER, estrogen receptor; PR, progesterone receptor; EGFR, epidermal growth factor receptor; RNA-seq, RNA sequencing.
Over the last decade, the development of additional data platforms to globally profile the cell at various molecular levels – including DNA mutation, DNA copy, DNA methylation, microRNAs, and proteins – has offered us challenges and opportunities to integrate these various data types in meaningful ways. TCGA is an ambitious project currently ongoing to comprehensively profile more than 10,000 cancers of various histological subtypes, using all of the above platforms. In recent years, TCGA consortium members have carried out numerous comprehensive molecular analysis studies focusing on a specific disease,Citation15–Citation17,Citation21,Citation38 as well as numerous “pan-cancer” studies that make observations that cut across different diseases.Citation14,Citation18,Citation19 TCGA datasets include an extensive RPPA dataset, the most recently published version being comprised of 3,467 patient samples from eleven tumor subtypes, using 181 high-quality antibody features targeting 128 total proteins and 53 post translationally modified proteins.Citation19 Additional RPPA data generation is ongoing, for additional cancer subtypes currently under study by TCGA.
In a number of these TCGA-initiated studies, the inclusion of RPPA data into multi-platform analyses has led to key insights, just a few examples of which are noted here (these examples involving analysis work by this review’s leading author). In breast cancer,Citation15 a set of proteins with core roles in the PI3K pathway were examined by RPPA (including phosphoprotein levels of Akt, mTOR, GSK3, S6K, and S6, and total levels of pathway inhibitors PTEN and INPP4B), and it was found that the pathway as a whole appeared more active in the basal-like subtype of breast cancer; this finding was corroborated in the corresponding mRNA data, by examining PI3K-associated transcriptional signatures. In clear cell renal cell carcinoma,Citation16 molecular correlates of patient survival were defined for each of four different data platforms (RPPA, RNA-sequencing, microRNA-sequencing, and DNA methylation arrays). By RPPA, top survival correlates included AMPK and ACC, which were oppositely correlated to each other, thereby suggesting a metabolic shift of the cell from oxidative phosphorylation to aerobic glycolysis. The RPPA-based observations led to a focused analysis of metabolism involving all platforms, which further supported a type of glycolytic shift being associated with more aggressive kidney cancer.
In TCGA’s recent lung adenocarcinoma study,Citation17 lung tumors could be separated into three main groups on the basis of RPPA and mutation data: 1) those tumors with the PI3K-Akt branch of mTOR pathway appearing activated (either PIK3CA activating mutation or high p-Akt), 2) those tumors with LKB1-AMPK branch inactivated (either STK11 mutation or low combined levels of LKB1/p-AMPK), and 3) those tumors unaligned with the above. The RPPA data were also used to define an mTOR pathway proteomic signature, which was the average of the phosphor-proteomic forms of 4E-BP1, 70S6K, and S6. In principle, mTOR signaling may be activated, by either Akt (eg, via PI3K) or inactivation of AMPK (eg, via STK11/LKB1 loss), and in fact those tumors that showed alterations in either mTOR-associated pathway branches, as defined earlier, did show increased mTOR pathway activity by RPPA. This finding illustrates the need for incorporating prior biological knowledge into pathway analysis of RPPA data, where pathways may not always behave in a linear fashion. In addition, the analysis demonstrated many cases that showed aberrant phospho-Akt or loss of LKB1 at the protein level, without an associated genetic driver, illustrating that RPPA data hold additional information on pathway activities that may not be fully captured by mutation analysis alone or by our current understanding of potential driver alterations for these key pathways.
Need for effective visualization approaches to RPPA data
As molecular datasets become more rich and complex, a challenge that presents itself is that of making results from integrative analyses understandable to everyone, of which effective data visualization would be a key component. While statisticians and computer scientists may often express results in terms of statistical P-values, statistical significance may not necessarily translate into biological significance. Almost any pattern that is of biological significance could be shown as such by some visual presentation of the data, thereby allowing the results to be even more apparent and more readily accepted by others. With RPPA and other molecular data platforms, there is an obvious need for better software tools to allow researchers, who may not have the benefit of a strong computational background, to be able to access and visualize multidimensional molecular datasets (OncomineCitation39 or CBioPortalCitation40 being good examples of these types of tools). At the same time, we can also seek to better utilize the printed page, which represents a static view of the data but one that can also be readily digested and shared with others.
In our own analysis work, we have formulated for ourselves some general guidelines for effective data visualization of genomic datasets as follows: 1) Show the data: the visualization should strive to show the actual data underlying a pattern of interest; the more people can “see” the associated patterns for themselves, the more the reported trends in the data may become more concrete in people’s minds and readily accepted. 2) Order elements deliberately: the ordering of the data elements should be deliberate, to provide optimal viewing of the primary pattern meant to be visualized. 3) Enable generalizations: the visualization should provide a global view of the data, allowing one to make generalizations about the system under study. 4) Focus on relevant specifics: as well as allowing one to follow the overall trends, the visualization should put emphasis on specific data features of particular relevance. 5) Put things in context: as much as possible, the data elements should be annotated, in order to put them into some meaningful context for the benefit of viewers having knowledge of the domain. In the following, we illustrate these guidelines, using concrete examples.
In the seminal paper by Perou et alCitation36 who first identified the intrinsic molecular subtypes of breast cancer, a key figure presented the results of unsupervised clustering of gene expression profiling with associated heat map. These subtypes are represented in , using heat maps of TCGA data from human breast tumors. While our above visualization guidelines were not explicitly stated in the Perou et al paper, these guidelines were in fact put to good use in Perou et al’s presentation of the unsupervised clustering heat map.
Show the data: while real data are never perfect and can even be somewhat “messy” (which could be considered the case for the earlier cDNA microarrays in particular), showing a heat map of the differentially expressed genes further reinforces the notion of distinct subtypes of breast cancer (as is also the case for ).
Order elements deliberately: for the Perou et al paper, a computer algorithm grouped the samples and genes based on distinctive patterns, thereby defining the breast cancer subtypes and the genes that underlie these subtypes.
Enable generalizations: from all of the individual data points derived from all of the samples and the thousands of genes profiled, Perou et al arrive at four or five basic subtypes of breast cancer, which represents a powerful generalization for this disease.
Focus on relevant specifics: two proteins, ER and HER2 (these genes being noted both in Perou et al’s figure and in our ), are of particular relevance to the intrinsic subtypes, as these represent known biomarkers of treatment response, thereby grounding these subtypes in reality.
Put things in context: ER and HER2 received particular focus in the Perou study, due to their previously established roles in the biology of breast cancer, thereby providing meaningful context as to the biology underlying the intrinsic subtypes.
Developing effective data visualization approaches for molecular profiling datasets continues to be an active area of research, one notable example being the recent visualization “sub-challenge” put forth by the HPN-DREAM consortium,Citation41 as part of its overarching challenge of network inference in breast cancer using RPPA data. The goal of HPN-DREAM’s visualization sub-challenge was for participants to devise novel approaches to represent a complex RPPA dataset, involvinĝ45 phosphoproteins being profiled for four different breast cancer cell lines, grown under conditions of eight different ligand stimuli, which stimuli groups were further divided into treatments by either one of three inhibitors or dimethyl sulfoxide (DMSO) vehicle control, with profiles taken for each treatment over seven different time points. In all, this RPPA dataset represented over 48,000 data points over multiple cell lines, stimuli conditions, inhibitor treatments and times, and the obvious challenge here was to find ways to meaningfully present all of these data.
provides a visualization of the above RPPA dataset, which was originally submitted by this review’s lead author, as part of the HPN-DREAM challenge. This visualization makes use of our above guidelines for present complex molecular datasets.
Figure 2 Example of how RPPA data representing multiple cell types, treatment conditions, and time points may be visually presented.
Abbreviations: RPPA, reverse phase protein array; PBS, phosphate buffered saline; DMSO, dimethyl sulfoxide; EGF, epidermal growth factor; FGF1, fibroblast growth factor 1; HGF, hepatocyte growth factor; NRG1, neuregulin 1.
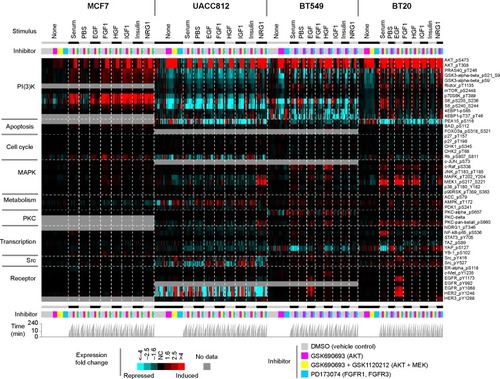
Show the data: using a heat map to display the protein expression patterns allows for compact presentation of all the individual data points.
Order elements deliberately: the ordering of protein features in the heat map is deliberately chosen, grouping them by biologically meaningful protein class (PI3K, apoptosis, cell cycle, MAPK, etc). The ordering of sample profiles in the heat map is likewise deliberate; this would represent a critical step in our defining what patterns might be readily viewed. The sample profiles are grouped first by cell line, then by stimulus, then by inhibitor, then by time; in this way, the viewer can readily look up how a particular stimulus and inhibitor treatment impacted protein expression.
Enable generalizations: the single page presentation provides a global view of all the data, allowing the viewer to observe overall trends and to make generalizations. Overall trends that are apparent in the figure include AKT inhibitors activating p-Akt in all cell lines, while suppressing PI(3)K activity (as measured by downstream effectors S6K, S6, and 4EBP1) in the UACC812 and BT549 cell lines. Other patterns are discernible here, such as HGF-induced MET, or EGF- induced EGFR/Her2, in both BT549 and BT20 cell lines.
Focus on relevant specifics: the visualization allows one to readily look up patterns for specific stimulus–inhibitor combinations. While all of the proteins represented in the dataset could be presented here, another dataset with a larger number of features might require one to focus on the features most relevant to the question at hand.
Put things in context: pathway knowledge provides the context that guides the ordering of the protein features, allowing the viewer to scan for a particular pathway or functional group.
The visualization guidelines described earlier are meant to be generalizable and not necessarily limited to heat maps. For example, many of the TCGA studies (eg, the clear cell kidney cancer study mentioned earlier, highlighting the role of glycolytic shift in more aggressive cancers) have made effective use of pathway diagrams. A pathway diagram, eg, one where the nodes may represent genes or proteins and would provide information on genomic alteration or differential expression, can also illustrate our general guidelines.
Show the data: all of the relevant components of the pathway should be considered (eg, not limiting ourselves to only components that would appear altered in a preconceived direction).
Order elements deliberately: the ordering of elements in the diagram is dictated by our prior knowledge of the pathway flow.
Enable generalizations: when considering the entire pathway, sub-pathways within the larger pathway may be shown to broadly change in a given direction.
Focus on relevant specifics: critically altered nodes in the pathway may also be identifiable.
Put things in context: our prior knowledge of the pathway, a product of decades of cumulative research, provides a meaningful context and framework for the data. In addition to what would be represented with the examples discussed here, other visualization approaches could be explored as well. In fact, there were many other creative entries submitted by others to the HPN-DREAM visualization challenge,Citation42 some of which may not be able to be fully captured on the static page and may require the development of new software tools, but which can help stimulate additional thinking in this important area.
Conclusion and future perspective
The recent explosion of molecular data, made possible by the wider availability of new technologies to comprehensively profile the cell, has enabled us to live in interesting times. Rather than being daunted by all these data, we should be excited at the potential for discovery. More and more, RPPA is establishing itself as a core data platform, which may be used in conjunction with other data platforms, for examining signaling pathways as they may change between diseased and healthy cells. Integration with other data platforms will be important in our maximizing the potential of RPPA as a research tool, along with the importance of having good knowledge of molecular biology and an effective grasp of effective visualization techniques. In addition, one area that holds great potential is the clinical use of RPPA, eg, for personalizing therapeutics, clinical diagnosis, and drug discovery,Citation43,Citation44 which can extend to human diseases beyond cancer.
Additional efforts are needed to facilitate more widespread use of RPPA, in both areas of research and clinical practice. Technical improvements regarding the reagents used in RPPA data generation would be of great potential benefit, including improvements in labeling chemistry to allow for higher sensitivity, as well as an expansion of validated antibodies for use with the platform. Improved software tools for automated image analysis could save considerable technician time and thereby lower the costs of implementation. With regard to the clinical setting, automation of an analysis workflow to integrate genomics data and RPPA would greatly aid future applications in personalized medicine.
Acknowledgments
The authors are supported in part by NIH/NCI grants P30CA125123 (CJC and SH) and U24CA143843 (CJC) and CPRIT grants RP120092 (SH) and RP120713 (CJC). We thank Dean Edwards for commenting on the manuscript.
Disclosure
The authors report no conflicts of interest in this work.
References
- SchenaMShalonDDavisRWBrownPOQuantitative monitoring of gene expression patterns with a complementary DNA microarrayScience199527052354674707569999
- LashkariDADeRisiJLMcCuskerJHYeast microarrays for genome wide parallel genetic and gene expression analysisProc Natl Acad Sci U S A1997942413057130629371799
- HanahanDWeinbergRAThe hallmarks of cancerCell20001001577010647931
- SpurrierBRamalingamSNishizukaSReverse-phase protein lysate microarrays for cell signaling analysisNat Protoc20083111796180818974738
- EkinsRPMulti-analyte immunoassayJ Pharm Biomed Anal1989721551682488616
- EkinsRPChuFWMultianalyte microspot immunoassay – microanalytical “compact disk” of the futureClin Chem19913711195519671934470
- MacBeathGSchreiberSLPrinting proteins as microarrays for high-throughput function determinationScience200028954851760176310976071
- HaabBBDunhamMJBrownPOProtein microarrays for highly parallel detection and quantitation of specific proteins and antibodies in complex solutionsGenome Biol200122 RESEARCH0004
- PaweletzCPCharboneauLBichselVEReverse phase protein microarrays which capture disease progression show activation of pro-survival pathways at the cancer invasion frontOncogene200120161981198911360182
- MirceanCShmulevichICogdellDRobust estimation of protein expression ratios with lysate microarray technologyBioinformatics20052191935194215647295
- RomeoMJWunderlichJNgoLRosenbergSASteinbergSMBermanDMMeasuring tissue-based biomarkers by immunochromatography coupled with reverse-phase lysate microarrayClin Cancer Res20061282463246716638853
- TibesRQiuYLuYReverse phase protein array: validation of a novel proteomic technology and utility for analysis of primary leukemia specimens and hematopoietic stem cellsMol Cancer Ther20065102512252117041095
- AkbaniRBeckerKFCarragherNRealizing the promise of reverse phase protein arrays for clinical, translational, and basic research: a workshop report: the RPPA (Reverse Phase Protein Array) societyMol Cell Proteomics20141371625164324777629
- Cancer Genome Atlas Research NetworkWeinsteinJNCollissonEAThe Cancer Genome Atlas Pan-Cancer analysis projectNat Genet201345101113112024071849
- The Cancer Genome Atlas NetworkComprehensive molecular portraits of human breast tumoursNature20124907418617023000897
- The Cancer Genome Atlas Research NetworkComprehensive molecular characterization of clear cell renal cell carcinomaNature20134997456434923792563
- The Cancer Genome Atlas Research NetworkComprehensive molecular profiling of lung adenocarcinomaNature2014511751154355025079552
- HoadleyKAYauCWolfDMMultiplatform analysis of 12 cancer types reveals molecular classification within and across tissues of originCell2014158492994425109877
- AkbaniRNgPKWernerHMA pan-cancer proteomic perspective on The Cancer Genome AtlasNat Commun20145388724871328
- BrennanCWVerhaakRGMcKennaAThe somatic genomic landscape of glioblastomaCell2013155246247724120142
- Cancer Genome Atlas Research NetworkKandothCSchultzNCherniackADIntegrated genomic characterization of endometrial carcinomaNature20134977447677323636398
- MuellerCLiottaLAEspinaVReverse phase protein microarrays advance to use in clinical trialsMol Oncol20104646148120974554
- ChenGGharibTGHuangCCDiscordant protein and mRNA expression in lung adenocarcinomasMol Cell Proteomics20021530431312096112
- RogersSGirolamiMKolchWInvestigating the correspondence between transcriptomic and proteomic expression profiles using coupled cluster modelsBioinformatics200824242894290018974169
- CreightonCJMultiple oncogenic pathway signatures show coordinate expression patterns in human prostate tumorsPloS One200833e181618350153
- SheehanKMCalvertVSKayEWUse of reverse phase protein microarrays and reference standard development for molecular network analysis of metastatic ovarian carcinomaMol Cell Proteomics20054434635515671044
- WestonADHoodLSystems biology, proteomics, and the future of health care: toward predictive, preventative, and personalized medicineJ Proteome Res20043217919615113093
- GuoSZouJWangGAdvances in the proteomic discovery of novel therapeutic targets in cancerDrug Des Devel Ther2013712591271
- LiYFRadivojacPComputational approaches to protein inference in shotgun proteomicsBMC Bioinformatics201213Suppl 16S4
- UhlenMOksvoldPFagerbergLTowards a knowledge-based Human Protein AtlasNat Biotechnol201028121248125021139605
- Theranostics Health [webpage on the Internet] Available from: http://www.theranosticshealth.comAccessed May 1, 2015
- TaoJJCastelPRadosevic-RobinNAntagonism of EGFR and HER3 enhances the response to inhibitors of the PI3K-Akt pathway in triple-negative breast cancerSci Signal20147318ra2924667376
- Emmert-BuckMRBonnerRFSmithPDLaser capture microdis-sectionScience1996274528999810018875945
- WulfkuhleJDSpeerRPierobonMMultiplexed cell signaling analysis of human breast cancer applications for personalized therapyJ Proteome Res2008741508151718257519
- MuellerCdeCarvalhoACMikkelsenTGlioblastoma cell enrichment is critical for analysis of phosphorylated drug targets and proteomic-genomic correlationsCancer Res201474381882824346432
- PerouCMSørlieTEisenMBMolecular portraits of human breast tumoursNature2000406679774775210963602
- ParkerJSMullinsMCheangMCSupervised risk predictor of breast cancer based on intrinsic subtypesJ Clin Oncol20092781160116719204204
- Cancer Genome Atlas Research NetworkComprehensive molecular characterization of urothelial bladder carcinomaNature2014507749231532224476821
- RhodesDRYuJShankerKONCOMINE: a cancer microarray database and integrated data-mining platformNeoplasia2004611615068665
- CeramiEGaoJDogrusozUThe cBio cancer genomics portal: an open platform for exploring multidimensional cancer genomics dataCancer Discov20122540140422588877
- Synapse [homepage on the Internet]HPN-DREAM breast cancer network inference challengeSynapse Available from: https://www.synapse.org/#!Synapse:syn1720047Accessed September 11, 2014
- Synapse [homepage on the Internet]HPN-DREAM visualization challengeSynapse Available from: https://www.synapse.org/#!Synapse:syn2274074Accessed May 1, 2015
- GallagherRIEspinaVReverse phase protein arrays: mapping the path towards personalized medicineMol Diagn Ther201418661963025358623
- MasudaMYamadaTSignaling pathway profiling by reverse-phase protein array for personalized cancer medicineBiochim Biophys Acta20151845665165725448010
- SaldanhaAJJava Treeview – extensible visualization of microarray dataBioinformatics200420173246324815180930