 ?Mathematical formulae have been encoded as MathML and are displayed in this HTML version using MathJax in order to improve their display. Uncheck the box to turn MathJax off. This feature requires Javascript. Click on a formula to zoom.
Abstract
Background
Imatinib mesylate has been a breakthrough treatment for chronic myeloid leukemia. It has become the ideal tyrosine kinase inhibitor and the standard treatment for chronic-phase leukemia. Striking results have recently been reported, but intolerance to imatinib and noncompliance with treatment remain to be solved. Molecular monitoring by quantitative real-time polymerase chain reaction is the gold standard for monitoring patients, and imatinib blood levels have also become an important tool for monitoring.
Methods
A fast and cheap method was developed and validated using high-performance liquid chromatography-mass spectrometry for quantification of imatinib in human serum and tamsulosin as the internal standard. Remarkable advantages of the method includes use of serum instead of plasma, less time spent on processing and analysis, simpler procedures, and requiring reduced amounts of biological material, solvents, and reagents. Stability of the analyte was also studied. This research also intended to drive the validation scheme in clinical centers. The method was validated according to the requirements of the US Food and Drug Administration and Brazilian National Health Surveillance Agency within the range of 0.500–10.0 μg/mL with a limit of detection of 0.155 μg/mL. Stability data for the analyte are also presented.
Conclusion
Given that the validated method has proved to be linear, accurate, precise, and robust, it is suitable for pharmacokinetic assays, such as bioavailability and bioequivalence, and is being successfully applied in routine therapeutic drug monitoring in the hospital service.
Introduction
Chronic myeloid leukemia is characterized by the presence of the Philadelphia chromosome, and is the first disease to be treated with a specific drug, which was initially named STI571. STI571 is a potent inhibitor of the tyrosine kinase activity produced from the chimeric gene BCR-ABL1 of the Philadelphia chromosome. This unusual enzyme activity is responsible for uncontrolled cell proliferation and inhibition of apoptosis. Several studies have reported the striking results of imatinib mesylate in patients with newly diagnosed, chronic-phase chronic myeloid leukemia, and this treatment was cited as being the most important in the IRIS (International Randomized Study of Interferon Versus STI571) study, with up to 87% of patients achieving a complete cytogenetic response and up to 84% survival free of progression to advanced phases after 5 years of treatment.Citation1 Complete cytogenetic response is defined as 0% positive Philadelphia chromosome metaphase cells out of at least 20 examined.Citation1
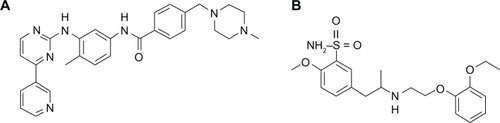
Imatinib, shown in and chemically designated as 4-[(4-methyl-1-piperazinyl)methyl]-N-(4-methyl-3-{[4-(3-pyridinyl)-2-pyrimidinyl]amino}phenyl)benzamide, is also known commercially as CGP57148B, Gleevec®, or Glivec® in the mesylate form (Novartis Pharmaceuticals Corporation, Hanover, NJ, USA). This drug is a powerful tyrosine kinase inhibitor, and is currently the first-line choice for treatment of chronic myeloid leukemia.Citation1–Citation4
Figure 1 Chemical structures of imatinib (A) and tamsulosin (B) used as internal standard.
Evaluation of blood imatinib levels in patients with chronic myeloid leukemia has become a useful tool for achieving the optimum therapeutic level for patients who have experienced drug interactions or adverse side effects and for those who require dose adjustment.Citation4–Citation6 Several recently published studies have reported the validation of analytical methods for quantification of imatinib in human blood using chromatographic techniques coupled with ultraviolet or mass spectrometry detection.Citation7–Citation10
In the current work, we aimed to develop and validate a simple and fast method for quantitative determination of imatinib in human serum using high-performance liquid chromatography (HPLC) coupled with single quadrupole mass spectrometry (MS). The validation was carried out in compliance with international rules and regulations adopted by the US Food and Drug Administration (FDA) and the Brazilian National Health Surveillance Agency (ANVISA). The method was developed to reduce the amount of reagents and biological materials needed for other published methods.Citation2,Citation5,Citation7,Citation11–Citation13
Rules and regulations
All of the procedures used in this study were conducted in accordance with the recommendations of bioanalytical method validation guides released by the FDA in 2001Citation14 and by ANVISA in 2003Citation15 and its current revision in 2012,Citation16 following the principles of Good Laboratory Practices. The procedures adopted to validate the method were the simplest ones that guarantee validation parameters and method performance with reliability, and could be applied in clinical centers with minimum analytical resources.
Experimental conditions
Chemicals, reagents, and human specimens
The imatinib mesylate reference standard (lot 50325) was obtained from Biovision (Milpitas, CA, USA). Tamsulosin hydrochloride (see ) reference standard (lot F0H375) was obtained from the United States Pharmacopeia (Rockville, MD, USA). All of the solvents used were HPLC grade and provided by JT Baker Chemicals (Phillipsburg, NJ, USA). Ultrapure water (type I) was obtained from a Direct-Q3 UV water purification system (Millipore, Molsheim, France). Blank, normal, hemolyzed, and hyperlipemic human serum were provided by Fundação Pró-Sangue do Hemocentro de São Paulo (São Paulo, Brazil) from healthy and drug-free subjects. The choice of serum instead of plasma (the most widely used matrix) took into account the easiest collection procedure and whole blood availability in clinical centers during routine evaluation of patients.
Equipment
Automatic micropipettes (models P1000, P200, and P20, Gilson Inc, Villiers-le Bel, France) with disposable plastic tips provided by Axygen (MA, USA) as well as the Multipipette Plus® with combitips (Eppendorf, Hamburg, Germany) were used. Weights were measured using an AY220 balance (Shimadzu Philippines Corporation, Rosario, Philippines), and the centrifuge used was an Eppendorf 5424. The analytical instrumentation included a Prominence UFLC® ultra-fast liquid chromatographic system (Shimadzu Company, Kyoto, Japan), composed of two LC-20 AD pumps, a DGU-20A3 degasser, an SIL-20AC HT autosampler, a CTO-20A column oven, an SPD-20A ultraviolet-visible detector, and a CBM-20A system controller. The chromatographic system was coupled to a Shimadzu LCMS-2020 MS with an electrospray ionization interface.
Preparation of calibration standards and quality controls
Standard stock solutions of imatinib and tamsulosin were prepared in pure methanol by dissolving a specified amount of material, weighed with a precision of 0.1 mg, in a suitable volume of solvent to provide a 1 mg/mL base equivalent clear solution after sonication. Working solutions were prepared by serial dilutions of the stock solutions to obtain final concentrations of 10, 20, 30, 40, 60, 80, 90, 120, 160, 162, and 200 μg/mL for imatinib and 5 μg/mL for tamsulosin. All stock solutions were stored at −20°C, and working solutions were stored at 2°C–8°C until use. Serum calibrators and quality controls were prepared as 20-fold dilutions of the working solutions in blank (drug-free) serum to obtain a calibration curve at concentrations of 0.500, 1.00, 2.00, 3.00, 4.00, 6.00, 8.00, and 10.0 μg/mL. The quality controls were prepared at concentrations of 0.500 μg/mL for the lower limit of quantification (LLOQ), 1.50 μg/mL for the low level quality control, 4.50 μg/mL for the medium level quality control, and 8.1 μg/mL for the high level quality control. The highest concentration of the calibration curve, 10 μg/mL, also denominated the upper limit of quantification. Spiked serum for use as a calibrator and quality controls was freshly prepared prior to use. Analysis of calibrators was carried out in duplicate for the first and last levels, and unique replicates were prepared for the other levels. For quality control, at least three replicates for each concentration were used in every batch.
Sample preparation
Blank serum samples were thawed at room temperature (22°C) and centrifuged at 14,000 × g for one minute prior to use as blank or spiked samples. An aliquot of 100 μL was transferred to 1.5 mL polypropylene centrifuge microtubes, and 50 μL of the internal standard solution was added. Next, 400 μL of cold methanol was added for protein precipitation. Cold methanol was obtained by immersing a cup of methanol in an ethanol/dry ice bath until the temperature reached −80°C. Closed microtubes were manually shaken for 20 seconds and positioned on plastic plates. After mixing by shaking, the samples were centrifuged at 14,000 × g for 15 minutes, and the clear supernatant was transferred to a 1 mL borosilicate vial with a plastic cap and placed into an autosampler tray at 8°C until injection.
Chromatographic conditions
After protein precipitation, 2 μL was injected into a 50 mm × 20 mm Luna C18 100 Å, 3 μm chromatography column preceded by a 4 × 2 mm Security Guard Cartridge C18 (Phenomenex, Torrance, CA, USA). The column was operated at 40°C, and a gradient elution was carried out as shown in . The solvents pumped into the column consisted of methanol or water, each containing 10 mM of ammonium acetate and 0.1% formic acid.
Table 1 Chromatographic linear gradient scheme. Both methanol and water contain 10 mM of ammonium acetate and 0.1% of formic acid
Mass spectrometer conditions
Calibration of the mass accuracy and optimized tuning parameters was performed using the auto tune function with a polyethylene glycol standard solution. Mass spectrometry detection was performed in positive electrospray ionization mode with the total eluent from the chromatographic system, ie, without splitting. The adjusted parameters were: drying gas flow, 15.00 L per minute; nebulizing gas flow, 1.5 L per minute; Desolvation Line (DL) temperature, 250°C; heat block, 250°C; and detector voltage, +1.50 kV The mass spectrometer was adjusted to monitor the ionized species formed in the ion source with a mass charge ratio (m/z) of 494 for imatinib [M+H]+ and 404 for tamsulosin [M+H]+.
Validation
In accordance with FDA and ANVISA directives, bioanalytical method validation refers to a set of procedures demonstrating that a particular method used for quantitative measurement of analytes in a given biological matrix is reliable and reproducible for the intended use.Citation14,Citation15 The present validation report represents the results of an analytical investigation of validation parameters, demonstrating that the performance characteristics of the method are suitable and reliable for the intended analytical application, ie, therapeutic monitoring and pharmacokinetic analyses. The acceptability of the analytical data in the analytical routine corresponds to the criteria used to validate the method and its ability to meet the acceptance criteria recommended by the cited regulatory agencies. The validated parameters include selectivity, recovery, linearity, accuracy, precision, sensitivity, and stability.
Acceptance criteria
All statistical results of the method performance were obtained from concentration values. Accuracy was reported as a percentage, and precision was reported as the relative standard deviation as a percentage. Measured variations, eg, stability tests, were reported in percentages and calculated with concentration values. Recovery was calculated with the chromatographic peak areas.
The elected standard criteria for the method comply with FDA bioanalytical method validation and ANVISA requirements for bioassays.Citation14,Citation15 One of the most important criteria was the accepted range for variations (±15% for regular concentrations, ie, >LLOQ and ≤upper limit of quantification, and ±20% for LLOQ) from a nominal value. The accuracy was measured as a percentage of the nominal concentration within the limits of acceptance of 85%–115% for regular concentrations and 80%–120% for LLOQ. For selectivity, a discrimination level of 20% for LLOQ was used as the criterion.
Selectivity
Selectivity refers to the extent to which a method can measure particular analytes in mixtures or matrices without interference from other substances present in the sample.Citation17 To verify the selectivity of the method, the analyte was analyzed in six different lots of blank serum samples (from six distinct individuals), including four lots of normal, one of hemolyzed, and one of hyperlipemic serum. Carry over was investigated by running a blank solvent sample immediately after the highest concentration sample. Cross talk was analyzed by running the analytes and internal standards separately. All results were compared with a sample prepared in solvent (neat solution) at the concentration of the LLOQ.
Recovery
The recovery of an analyte in an assay refers to the detector response obtained when a specified amount of the analyte is added to and recovered from the biological matrix (human plasma) compared with the detector response obtained for the neat solution standard.Citation14,Citation18 The extraction procedure was evaluated by comparing the peak area of each analyte and the internal standard extract from serum to the unextracted samples: (1) without matrix components (prepared only in solvent, ie neat solution) and (2) with matrix components (spiked after extraction, into a blank extracted sample). The first represents absolute recovery and does not take into account the effect of matrix constituents present in the injected solution. The second approach gives a true recovery by considering the effect of matrix constituents present in the solution.Citation19 Therefore, the matrix effect represents the response of the analytical method to the matrix constituents.
Absolute recovery was calculated by the expression:
The true recovery was calculated by the expression:
Matrix effect was calculated by the expression:
Linearity
The linearity of an analytical procedure is its ability (within a given range) to obtain test results that are directly proportional to the concentration (amount) of the analyte in the sample.Citation14,Citation18 The analytical instruments use a response function of a bioanalytical method that defines, within a range, the existing relationship between the response (signal) and concentration (quantity) of the analyte in standard samples. The standard calibration curves were then back-calculated by the least squares method using peak area ratios of analyte and internal standard versus the analyte nominal concentration at eight levels, ie, 0.500, 1.00, 2.00, 3.00, 4.00, 6.00, 8.00, and 10.0 μg/mL. The lower and higher standards were carried out in duplicate, and the others were carried out in single replicate.
Accuracy
The accuracy of the analytical method describes the closeness of the test results obtained by the method to the true value of the analyte. Accuracy was determined by replicate analysis of six samples containing known amounts of analyte at the quality control concentration levels, and this experiment was repeated three times on different days.Citation14 The deviation of the mean from the true value serves as the measure of accuracy and was obtained by the expression:
The relevant mean values were within 15% of the nominal value for the quality controls and within 20% for LLOQ.
Precision
The precision of the analytical method describes the difference of individual measures of an analyte compared with when the procedure is applied repeatedly to multiple aliquots of a single homogeneous volume of a biological matrix. The precision was determined by replicate analysis of six samples containing known amounts of the analyte at the quality control concentration levels, and this experiment was repeated three times on different days.Citation14 Precision (CV%) was calculated by the expression:
which corresponds to the relative standard deviation (also called the coefficient of variability, CV%). Values of CV ≤ 15% for a series of quality controls and ≤ 20% for LLOQ were considered acceptable.
Sensitivity, LLOD, and LLOQ
Sensitivity of the analytical method is the capability of the method to discriminate small differences in concentration of the test analyte, calculated by the quotient of change, which serves as a quality indicator of a measuring system, and the corresponding change in the value of the quantity being measured.Citation20 In other words, method sensitivity can be analyzed as the slope of the calibration curve that is obtained by plotting the response against the analyte concentration and consequently reflects the smallest concentration that may be quantified by the method with precision and accuracy. In practical terms, the lower the concentration that can be quantified, the higher the resolution of the method.Citation21 The LLOQ concentration was determined based on three criteria: the analyte response at this concentration was at least five times greater than the baseline noise; the analyte response at the LLOQ was determined quantitatively with sufficient precision and accuracy, ie, a CV of 20% or less and accuracy within 80%–120%; and the concentration of the LLOQ was suitable for the intended application of the method.
The lower limit of detection (LLOD) was defined as the point at which a measured value is larger than the uncertainty associated with it. It is the lowest concentration of analyte in a sample that can be detected but not necessarily quantified. The LLOD measurement was based on the standard deviation of the intercept obtained from three calibration curves, and represents the lowest detectable amount of analyte or the lowest amount that can be reliably differentiated from background noise at a ratio of 3.Citation14,Citation15 The concentration of the LLOD was calculated as follows:Citation15
Stability
The stability of the analyte in a biological fluid is a function of its chemical properties, the storage conditions, the matrix, and the container system. The stability is relevant only to that matrix and container system and should not be extrapolated to other matrices and container systems.Citation14,Citation15 The conditions used in stability experiments reflect situations likely to be encountered during actual sample handling and analysis. To test stability, a series of samples were prepared at low and high quality control level concentrations and subjected to desired conditions (temperature and time), and then compared with freshly prepared ones. Stability assays evaluate the stability of the analyte after long-term (frozen at −20°C) and short-term (bench top, room temperature of approximately 22°C) storage, after being subjected to freeze and thaw cycles, and after post-processing in an autosampler device. All of the stability tests were assessed in triplicate at low and high quality control concentrations, and spiked samples were compared with freshly prepared ones in the same matrix. All of the stability results were calculated by the following formula:
The results indicate the degree of degradation (negative values) or no degradation (positive values).
Short-term stability was evaluated with samples that were prepared and left on the bench top at 22°C with the laboratory lights on for 18 hours, which exceeds the maximum time expected for routine analysis. Stability was evaluated after three freeze and thaw cycles. In each cycle, frozen samples were thawed at room temperature and refrozen at −20°C. All samples were quantified after the third freeze-thaw cycle.
Post processing stability was evaluated after 88 hours in spiked samples subjected to the extraction protocol and left in the autosampler at 8°C. To evaluate long-term stability, spiked samples were stored at −20°C for 92 days and quantified after this period, exceeding the maximum time expected for sample storage.
Results and discussion
Method development
The mass spectrometer was adjusted to monitor ionized species formed in ion sources with a mass charge ratio (m/z) of 494 for imatinib [M + H]+ and 404 for tamsulosin [M + H]+. These m/z ratios were determined by the most intense signal observed when the full scan of the mass spectrometer was applied with a continuous infusion of a standard solution for each compound at 10 μg/mL, using an electrospray ion source operating in positive mode. Tuning for target compounds was performed by adjusting the ion source parameters, such as probe alignment, temperatures, and nitrogen flow, to produce the most intense and stable signals for the compounds without loss of mass resolution or compromising specificity. After the chromatographic conditions were established, the ion source parameters were further optimized with an infusion of analyte and internal standard combined with HPLC flow with a composition similar to that during elution of the compounds. The desolvation temperature, desolvation gas flow, and probe alignment were manipulated to produce the highest stable signal for each compound. Finally, precision tests with sequential injections of a standard solution were conducted to verify the performance of the adjustments.
The chromatographic conditions are presented in . These conditions were determined after several tests and indicated that: methanol was better than acetonitrile for separation of matrix interferences, the analyte, and the internal standard; through gradient elution, the presence of formic acid increased the mass spectrometer response; ammonium acetate was the best modifier to increase the peak shape and resolution without loss of intensity of the signal; and all of the reagents are inexpensive and widely available. The best resolution was achieved using a Phenomenex Luna 3 μm C18 column. The short column length of 50 mm provides a short run time with a relatively low back pressure during gradient solvent changing. Typical retention times were 0.9 of a minute for tamsulosin and 1.8 minutes for imatinib, and the total run time was 4 minutes, including for re-equilibration of the column.
The extraction parameters were chosen based on the parameters that avoided matrix interferences during instrumental analyses and consumed small quantities of material.
Results of the validated parameters
Selectivity
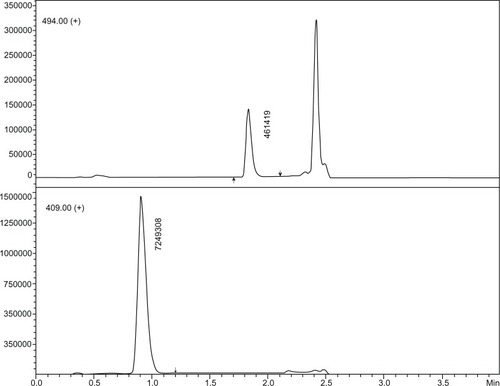
No significant interference was found for the same retention time of the analyte or internal standard in a set of six individual matrices, including four normal samples, one hyperlipemic sample, and one hemolyzed serum sample. No carry over or cross talk effects were observed. Blank samples of each type are shown in . shows typical chromatograms of the analyte at the LLOQ level in an extracted sample with an internal standard.
Figure 2 Chromatograms of (A) sample at lower limit of quantification level plus internal standard prepared in solvent. Extracted blank serum samples, (B) normal, (C) hemolyzed, and (D) hyperlipemic. Responses (vertical axes) are normalized to highest peak.
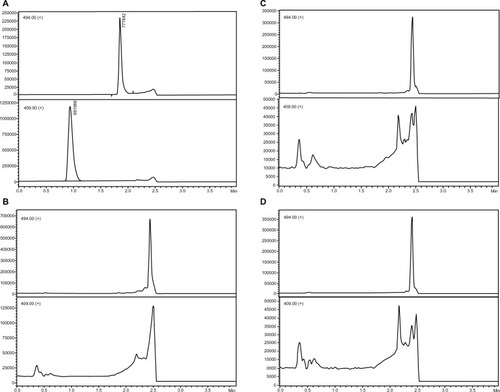
Figure 3 Chromatograms of sample at lower limit of quantification level plus internal standard extracted as per the protocol.
Recovery
As shown in , recovery calculations determined similar recovery values within the range, which demonstrates that there was no bias during the extraction procedure or during the instrumental analysis. The absolute and relative recoveries were in agreement with the matrix effect results. With respect to the analyte and internal standard we found mean absolute recoveries of 95.4% and 82.8%, relative recoveries of 98.5% and 90.9%, and matrix effects of −3.1% and −9.0%.
Table 2 Recovery and matrix effect results for analyte and internal standard
Linearity
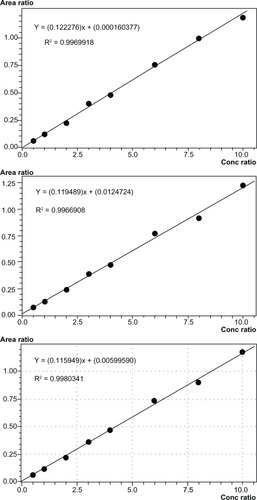
Three calibration curves that were prepared independently were compared to assess linearity. The simplest regression method for the calibration curves of imatinib was y = a + bx (1/x weighted) from 0.500 to 10.0 μg/mL, with the coefficient of correlation ranging from 0.9966908 to 0.9980341. shows the three calibration curves and the respective equations and coefficients of correlation (R^2), which were independently calculated.
Figure 4 Calibration curves of first, second, and third batches of linearity test from top to bottom, with respective equations and coefficients of correlation (R^2).
Accuracy and precision
shows the results for accuracy and precision obtained with three batches that were prepared and performed on different days. The intrabatch results for accuracy and precision ranged from 88.0% to 106.9% and from 1.0% to 4.3%, respectively, and for the interbatch tests, the results for accuracy and precision ranged from 91.7% to 104.6% and 3.7% to 5.8%, respectively.
Table 3 Results of precision and accuracy experiments, intrabatch and interbatch
Sensitivity
The LLOQ was 0.500 μg/mL with a signal-to-noise ratio >10, precision thresholds set at CV% ≤ 15%, and accuracy within 80% and 120%. This value is suitable for pharmacokinetic analyses or therapeutic drug monitoring, representing approximately three half-lives. The LLOD concentration was calculated as 0.155 μg/mL based on calibration curves.
Stability
As shown briefly in and in detail in , samples subjected to the 18-hour short-term room temperature treatment showed some variation, ranging from −1.7% to 0.2%. The variation after three freeze and thaw cycles ranged from −6.9% to −0.8%, the 88-hour post processing stability in the autosampler ranged from −11.1% to −3.6%, and the 92-day long-term stability ranged from 5.6% to 13.3%.
Table 4 Limits of stability approved for imatinib
Table 5 Stability test results for imatinib
Results of method robustness
Accuracy and precision in reinjected samples
Because of the possibility of instrument failure or abnormal analytical results, we validated our technique through a reinjection process without a new extraction. The experiment consisted of reinjecting a set of quality control solutions from an accuracy and precision batch and comparing the reinjected samples with the original injection samples. The reinjected samples did not show values over 2.5% of the original injection.
Chromatographic profile and system maintenance
After analysis of approximately 1,500 samples carried out for method development and analysis of samples, the chromatographic profile was similar to that at the beginning of the validation, without significant changes in retention time or loss of resolution or linearity. The analytical column was flushed after each day of assays with at least 20 column volumes of methanol/water solution without additives. The mass spectrometer ion source was cleaned when loss of sensitivity was detected.
Choice of internal standard
Use of an isotopically-labeled analog of the analyte is generally regarded as the best choice in bioanalysis by HPLC-MS, due to the great similarity of the physicochemical properties of the two substances, leading to very similar behavior of both substances during sample preparation, chromatography, and ionization in the mass spectrometer. The use of deuterium-labeled imatinib was our choice in another method previously reportedCitation22 to quantitate imatinib and its main metabolite, CGP74588.
However, due to the high cost of the deuterium-labeled reference material and the difficulty in obtaining or purchasing it, we sought an alternative substance which meets the criteria of physicochemical characteristics in order to have similar behavior to the analyte, both in sample preparation, in chromatography, and detection by MS. Tamsulosin was chosen as the internal standard because it meets the most important criteria, ie, similar logP and logD, solubility in methanol, polarity of ionization in MS (positive), and stability in experimental conditions. Use of tamsulosin brings considerable savings in terms of money and time (with regard to purchasing the reference material).
Development of a high throughput method
The current method was developed to save money and time for analysis, searching for the simplest and efficient sample cleanup during preparation, the best chromatographic separation without accumulation of sample residues in the column, and more sensitive and robust adjustment of the mass spectrometer, avoiding contamination of the ion source with accumulation of nonionizable substances, salts, and large molecules, such as proteins, phospholipids, and lipids.
The strategy adopted to develop the method was the classical optimization of chromatographic parameters converging to the desired condition, starting with the choice of the analytical column and solvents to achieve the best selectivity (α), find the solvent proportions to obtain high retention (k′), and improvement of separation (resolution). The optimization method consisted of achieving the chromatographic conditions with better balanced parameters within the shortest run time. Thus, the column length was shortened and the flow rate and column temperature were increased, reducing the time to elution with low system pressures.
As shown in , an organic solvent step was applied to the column (methanol plus additives) after elution of the compounds of interest (between 1.8 and 2.5 minutes), eluting unwanted compounds, and cleaning the column. During this stage of development, this step was monitored with an ultraviolet detector, until no remaining substance elutes were producing a chromatographic peak after the flush, and blank injections were also monitored to confirm the cleanness of the column after the organic step.
The cleanness, and consequently the performance of the mass spectrometer, was successful due to precise adjustment of the ion source parameters, ie, desolvation gas flow and distance between the probe capilar and the sample cone, which were adjusted to maximum flow and distance without significant loss of response. This adjustment was performed while a neat solution of analyte plus internal standard was continuously infused post-column and was mixed with the HPLC column effluent through a T connection before entering the electrospray interface.Citation23 With this same assembly, HPLC injection of extracted serum samples was analyzed with the purpose of verifying the matrix effect, and it was found that there was no ion suppression effect at the same compound elution times. Ion suppression and the matrix effect play an important role in the development in order to achieve good performance of the mass spectrometer, observed as high precision in sample analysis. Cleanness also contributes to robust analysis with high precision.
Comparison with previous method
The previous methodCitation22 mentioned above has similar performance and costs when compared with other published methods, but sample preparation is easier. Considering the enhancements of the current method, one can estimate that an analysis would be 3.2 times more rapid, requiring 3.4 times less solvent, and a 5.8-fold saving in internal standard costs. The validation parameters show equivalent performance. illustrates these comparisons, including the individual values for precision and accuracy.
Table 6 Method enhancements and performance compared with a previous validated method
Therapeutic drug monitoring and application of method
Past studies have monitored imatinib blood levels and related them to treatment efficacy, suggesting that administration of an initial imatinib dose of 800 mg/day, titrated to the standard dose of 400 mg/day, might be more effective for patients in the chronic phase of chronic myeloid leukemia.Citation24,Citation25
The main advantage of decreasing the treatment dose of imatinib is diminishing the incidence of side effects, as demonstrated by the randomized Phase III open-label TOPS (Tyrosine Kinase Inhibitor Optimization and Selectivity) trial of imatinib, which compared doses of 400 mg/day against 800 mg/day in newly diagnosed patients. This study also showed that both the complete cytogenetic response and major molecular response occurred faster in patients randomly assigned to a group receiving 800 mg/day of imatinib compared with those receiving 400 mg/day, although the complete cytogenetic response and major molecular response rates 12 months later were not significantly different.Citation24,Citation25 Major molecular response is defined as a standardized ratio of BCR-ABL to control a gene ratio of ≤0.1% by real-time quantitative polymerase chain reaction in peripheral blood.Citation4
Thus, it seems reasonable that the relationship between dose exposure and efficacy, measured by major molecular response and complete cytogenetic response, may be a way to gauge dose adjustments in patients to reduce side effects and the cost of treatment. A recently published work shows that imatinib trough levels (Cmin in steady state) were relatively stable over time and proportional to the dose administered. Patients with an imatinib Cmin above 1,165 ng/mL at the end of the first month of treatment achieved a major molecular response faster and had higher major molecular response and complete cytogenetic response rates at 12 months.Citation4 Based on these results, validated analytical methods in oncology treatment centers are necessary to monitor blood levels and allow more individualized treatment for patients, especially those who present side effects or abnormal major molecular response and complete cytogenetic response rates.Citation4,Citation6
Pharmacokinetic applications, such as bioavailability and bioequivalence, are reliable with an LLOQ of 0.100 μg/mL, and because of this limit, this method may be sufficient to quantify imatinib within 3–5 half-lives or approximately 5% of the expected peak levels when administered at a dose of 400 mg.Citation26,Citation27
Conclusion
We succeeded in developing a fast (four minutes analytical run), sensitive (0.155 μg/mL LLOD, 0.500 μg/mL LLOQ) and selective HPLC–MS method for the quantitation of imatinib in human serum with tamsulosin as an internal standard, using UFLC® (Ultra Fast Liquid Chromatography) system coupled to a single quadrupole mass spectrometer detector, both from Shimadzu, Japan. After optimization of the chromatographic conditions, the analyte and internal standard could be separated from endogenous sources of interference, providing narrow peaks with good peak symmetry and reproducibility. The method was fully validated according to FDA and ANVISA regulations, including selectivity, linearity, accuracy, precision, LLOD, LLOQ, recovery, and stability.
Given that the validation parameters meet the criteria recommended by regulatory agencies, particularly the FDA and ANVISA, the method may be applied for routine quantitative determination of imatinib. The proposed method is sufficiently robust, accurate, precise, and selective for quantitative bioanalyses of imatinib in human serum, therapeutic drug monitoring, or pharmacokinetic assays in which serum imatinib levels range from 0.155 μg/mL to 10.0 μg/mL. Stability tests have demonstrated that imatinib is stable in actual conditions. The simplicity, rapid nature, and low cost of this method allow laboratories to implement routine analysis of imatinib using HPLC-MS instrumentation in clinical centers with at least three-fold cost savings.
Considering the results of the clinical studies mentioned above, evaluation of blood imatinib levels in patients with chronic myeloid leukemia has become a useful tool to achieve the optimum therapeutic level for those patients who experience drug interactions or adverse effects or those who require dose adjustment. The characteristics and performance of this validated method make it suitable for this clinical purpose. This method may also be suitable for pharmacokinetic analyses because the LLOQ is suitable to quantify imatinib over three half-lives, which is sufficient for single-dose or steady-state monitoring.
Acknowledgments
VMR and IB were supported by Fundação Maria Cecília Souto Vidigal. The authors acknowledge the support given.
Disclosure
The authors report no conflicts of interest in this work.
References
- Druker BJ Guilhot FO O’Brien SG IRIS Investigators Five-year follow-up of patients receiving imatinib for chronic myeloid leukemia N Engl J Med 2006 355 23 2408 2417 17151364
- Titier K Picard S Ducint D Quantification of imatinib in human plasma by high-performance liquid chromatography-tandem mass spectrometry Ther Drug Monit 2005 27 5 634 640 16175138
- Kantarjian HM Talpaz M Imatinib mesylate: clinical results in Philadelphia chromosome-positive leukemias Semin Oncol 2001 28 5 Suppl 7 9 18 11740802
- Guilhot F Hughes T Cortes J Plasma exposure of imatinib and its correlation with clinical response in the Tyrosine Kinase Inhibitor Optimization and Selectivity Trial Haematologica 2012 97 5 731 738 22315495
- Awidi A Salem II Najib N Mefleh R Tarawneh B Determination of imatinib plasma levels in patients with chronic myeloid leukemia by high performance liquid chromatography-ultraviolet detection and liquid chromatography-tandem mass spectrometry: methods comparison Leuk Res 2010 34 6 714 717 19744707
- Guilhot F Roy L Tomowiak C Current treatment strategies in chronic myeloid leukemia Curr Opin Hematol 2012 19 2 102 109 22227529
- Parise RA Ramanathan RK Hayes MJ Egorin MJ Liquid chromatographic-mass spectrometric assay for quantitation of imatinib and its main metabolite (CGP 74588) in plasma J Chromatogr B Analyt Technol Biomed Life Sci 2003 791 1–2 39 44
- Mičová K Friedecký D Faber E Polýnková A Adam T Flow injection analysis vs ultra high performance liquid chromatography coupled with tandem mass spectrometry for determination of imatinib in human plasma Clin Chim Acta 2010 411 23–24 1957 1962 20713033
- Roth O Spreux-Varoquaux O Bouchet S Imatinib assay by HPLC with photodiode-array UV detection in plasma from patients with chronic myeloid leukemia: comparison with LC-MS/MS Clin Chim Acta 2010 411 3–4 140 146 19853594
- Davies A Hayes AK Knight K Watmough SJ Pirmohamed M Clark RE Simultaneous determination of nilotinib, imatinib and its main metabolite (CGP-74588) in human plasma by ultra-violet high performance liquid chromatography Leuk Res 2010 34 6 702 707 20004471
- Solassol I Bressolle F Philibert L Charasson V Astre C Pinguet F Liquid chromatography-electrospray mass spectrometry determination of imatinib and its main metabolite, N-desmethyl-imatinib in human plasma J Liq Chromatogr Relat Technol 2006 29 2957 2974
- Bakhtiar R Khemani L Hayes M Bedman T Tse F Quantification of the anti-leukemia drug STI571 (Gleevec) and its metabolite (CGP 74588) in monkey plasma using a semi-automated solid phase extraction procedure and liquid chromatography-tandem mass spectrometry J Pharm Biomed Anal 2002 28 6 1183 1194 12049982
- Miura M Takahashi N Sawada KI Quantitative determination of imatinib in human plasma with high-performance liquid chromatography and ultraviolet detection J Chromatogr Sci 2011 49 5 412 415 21549035
- US Food and Drug Administration Guidance for industry: bioanalytical method validation Rockville, MD Department of Health and Human Services, Food and Drug Administration, Center for Drug Evaluation and Research 2001 Available from: http://www.fda.gov/downloads/Drugs/Guidances/ucm070107.pdf Accessed June 6, 2013
- ANVISA Resolution RE No. 899, of May 29, 2003. Brazil, Brazilian National Surveillance Agency (ANVISA); Diário Oficial da União 02/jun/2003 Available on line: http://www.in.gov.br/visualiza/index.jsp?jornal=1&pagina=56&data=02/06/2003 Accessed June 2, 2013
- ANVISA Resolution RDC No. 27, of May 27, 2012. Brazil, Brazilian National Surveillance Agency (ANVISA); Diário Oficial da União 22/may/2012 Available from: http://www.in.gov.br/visualiza/index.jsp?data=22/05/2012&jornal=1&pagina=93&totalArquivos=192 Accessed June 2, 2013
- Vessman J Stefan RI Staden JF Selectivity in analytical chemistry (IUPAC Recommendations 2001) Pure Appl Chem 2001 73 8 1381 1386
- Hubert P Chiap P Crommen J The SFSTP guide on the validation of chromatographic methods for drug bioanalysis: from the Washington Conference to the laboratory Anal Chim Acta 1999 391 2 135 148
- Matuszewski BK Constanzer ML Chavez-Eng CM Strategies for the assessment of matrix effect in quantitative bioanalytical methods based on HPLC-MS/MS Anal Chem 2003 75 13 3019 3030 12964746
- BIPM Joint Committee for Guides in Metrology (JCGM) Bureau of Weights and Measures (BIPM) International vocabulary of metrology — Basic and general concepts and associated terms (VIM) JCGM 200 2012 Joint Committee for Guides in Metrology, Bureau of Weights and Measures (BIPM) 2012 Available from: http://www.bipm.org/utils/common/documents/jcgm/JCGM_200_2012.pdf Accessed June 2, 2013
- Currie LA Nomenclature in evaluation of analytical methods including detection and quantification capabilities (IUPAC Recommendations 1995) Pure Appl Chem 1995 67 10 1699 1723
- Rezende VM Rivellis AJ Gomes MM Determination of serum imatinib mesylate in chronic myeloid leukemia patients: validation and application of a new analytical method to control therapy adherence Rev Bras Hematol Hemoter 2013 35 2 103 108 23741187
- Annesley TM Ion suppression in mass spectrometry Clin Chem 2003 49 7 1041 1044 12816898
- Cortes J Giles F O’Brien S Result of high-dose imatinib mesylate in patients with Philadelphia chromosome-positive chronic myeloid leukemia after failure of interferon-alpha Blood 2003 102 1 83 86 12637317
- Cortes JE Baccarani M Guilhot FO Phase III, randomized, open-label study of daily imatinib mesylate 400 mg versus 800 mg in patients with newly diagnosed, previously untreated chronic myeloid leukemia in chronic phase using molecular end points: tyrosine kinase inhibitor optimization and selectivity study J Clin Oncol 2010 28 3 424 430 20008622
- Parrillo-Campiglia S Ercoli MC Umpierrez O Bioequivalence of two film-coated tablets of imatinib mesylate 400 mg: a randomized, open-label, single-dose, fasting, two-period, two-sequence crossover comparison in healthy male South American volunteers Clin Ther 2009 31 10 2224 2232 19922893
- Larson RA Druker BJ Guilhot F Imatinib pharmacokinetics and its correlation with response and safety in chronic-phase chronic myeloid leukemia: a subanalysis of the IRIS study Blood 2008 111 8 4022 4028 18256322