 ?Mathematical formulae have been encoded as MathML and are displayed in this HTML version using MathJax in order to improve their display. Uncheck the box to turn MathJax off. This feature requires Javascript. Click on a formula to zoom.
Abstract
S-Nitroso-N-acetylcysteine (SNAC) is a water soluble primary S-nitrosothiol capable of transferring and releasing nitric oxide and inducing several biochemical activities, including modulation of hepatic stellate cell activation. In this study, we evaluated the antifibrotic activity of SNAC in an animal model of nonalcoholic steatohepatitis (NASH) induced in Sprague-Dawley rats fed with a choline-deficient, high trans fat diet and exposed to diethylnitrosamine for 8 weeks. The rats were divided into three groups: SNAC, which received oral SNAC solution daily; NASH, which received the vehicle; and control, which received standard diet and vehicle. Genes related to fibrosis (matrix metalloproteinases [MMP]-13, -9, and -2), transforming growth factor β-1 [TGFβ-1], collagen-1α, and tissue inhibitors of metalloproteinase [TIMP-1 and -2] and oxidative stress (heat-shock proteins [HSP]-60 and -90) were evaluated. SNAC led to a 34.4% reduction in the collagen occupied area associated with upregulation of MMP-13 and -9 and downregulation of HSP-60, TIMP-2, TGFβ-1, and collagen-1α. These results indicate that oral SNAC administration may represent a potential antifibrotic treatment for NASH.
Introduction
Liver fibrosis is one of the main outcomes of chronic nonalcoholic fatty liver disease (NAFLD), which usually precedes hepatocarcinogenesis.Citation1 The combined pathophysiological features of NAFLD and fibrosis associated hepatocarcinoma have stimulated studies for understanding the basic molecular and cellular mechanisms associated with chronic liver inflammation. Among the central inflammatory signaling pathways driving the transition from chronic liver injury to fibrosis and hepatocarcinoma, oxidative stress is considered to be involved in the onset and progression of NAFLD.Citation2,Citation3 Reactive oxygen species are known to activate hepatic stellate cells (HSCs), which leads to hepatic collagen deposition and fibrosis.Citation4 In addition, changes in the extracellular matrix composition are accompanied by an imbalance between the rates of matrix synthesis and degradation which, in healthy livers, is maintained by a permanent turnover driven by matrix metalloproteinases (MMPs) and their corresponding tissue inhibitors of metalloproteinases (TIMPs).Citation4,Citation5 Chronic liver injury and activation of HSCs lead to upregulation of TIMP-1 and transforming growth factor β-1 (TGFβ-1) expression, with inhibition of MMP activity, stimulation of collagen I synthesis, and accumulation of matrix proteins in the extracellular space.Citation6,Citation7 Therefore, evaluating the changes in the expression of genes involved in fibrogenesis with antioxidant based treatments in vivo may bring fundamental information regarding the role of oxidative injury in nonalcoholic steatohepatitis (NASH) and liver fibrosis.
Among its many biological actions, endogenous nitric oxide (NO) may be a protective species in inflammatory diseases associated with oxidative injury. Under oxidative stress conditions promoted by superoxide (O2
•−) production, NO is capable of exerting a protective action if it is in molar excess relative to O2
•−.Citation8 One of the strategies for restoring the balance between NO and O2
•− in favor of NO under inflammatory conditions is to supplement NO from an exogenous source. Several NO donor drugs have already been used for this purpose in experimental studies, including metal-nitrosyl complexes, organic nitrites and nitrates, and S-nitrosothiols (RSNOs), which possess the -S-NO moietyCitation9 One of the main synthetic RSNOs described in the literature as an exogenous NO source is S-nitroso-N-acetylpenicillamine (SNAP), which is a tertiary RSNO (where the S-NO moiety is bound to a tertiary carbon atom). SNAP offers the advantage of increased stabilityCitation10 due to steric hindrance exerted by the substituent groups of the tertiary carbon atom, complicating the approach of two molecules to form a dimer in the NO release reaction. However, SNAP has low solubility in water, limiting its potential pharmaceutical application as an NO donor in humans. Conversely, several primary RSNOs (where the S-NO moiety is bound to a primary carbon atom) such as S-nitrosoglutathione (GSNO) and S-nitrosoalbumin are water soluble and are endogenously found in mammals with low toxicity. A simpler analog of GSNO is S-nitroso-N-acetylcysteine (SNAC), whose precursor molecule is N-acetylcysteine (NAC), a drug amply used as a mucolytic agent.Citation11 SNAC can be readily obtained from the S-nitrosation of NAC in aqueous media and can spontaneously release NO through homolytic S-N bond cleavage followed by dimerization through the reaction between thiyl radicals (EquationEquation 1(1) ).
where R = C5H6NO3. SNAC has been shown to exert hypotensive action following intravenous administrationCitation10,Citation12 and to be protective against liver injury in different animal models of NAFLD and NASH.Citation13–Citation18 Therefore, we chose SNAC as a potential antifibrinogenic NO donor drug for treating fibrosis in an animal model of NASH. We used diethylnitrosamine (DEN), a well known alkylating agent with carcinogenic and mutagenic properties, in combination with a choline-deficient high fat diet, to induce NASH and liver fibrosis in Sprague-Dawley rats. The results obtained indicate that oral administration of SNAC may be a potential new antifibrotic therapy for patients with NASH.
Materials and methods
Materials
N-acetyl-L-cysteine (2-acetamido-3-sulfanylpropanoic acid, NAC), sodium nitrite, hydrochloric acid, sodium chloride, phosphate buffered saline (PBS) solution (pH 7.4), and DEN were purchased from Sigma-Aldrich Chemical Co (Milwaukee, WI, USA). Chloroform, isopropanol, and ethanol were obtained from Merck (Darmstadt, Germany). Reagents were used as received.
SNAC synthesis
SNAC was synthesized through S-nitrosation of NAC (40 mM) in an equimolar acidified sodium nitrite solution at pH 4.5. SNAC formation was monitored by ultraviolet-visible (UV-Vis) spectrophotometry based on the formation of its characteristic absorption bands with maxima at 336 and 545 nm using a diode array spectrophotometer (Hewlett-Packard, Model 8453, Palo Alto, CA, USA) referenced against air. A kinetic plot of the absorption at 545 nm in time intervals of 1 minute at 25°C was used for evaluating the time necessary for a complete reaction under stoichiometric conditions. Stock SNAC solutions were prepared at a concentration of 40 mM, and then further diluted to 1 mM in PBS (pH 7.4) for oral administration to the animals. Only freshly prepared SNAC solutions were used in this study.
Thermal decomposition of SNAC solution in simulated gastric fluid
Simulated gastric fluid (SGF) was prepared by dissolving of 2 grams of sodium chloride and 7 mL of 37% hydrochloric acid in a final volume of 1 L of distilled water. The pH of this solution was 1.5. Decomposition of 1.0 mM SNAC incubated in SGF at 37°C was spectrophotometrically characterized over 8 hours by monitoring the spectral changes in the range 220–1100 nm at time intervals of 15 minutes in the dark as described above. Kinetic curves of the decomposition of 1 mM SNAC in SGF were obtained from the absorption changes at 336 nm.
Animals
Adult Sprague-Dawley rats, each weighing 250–300 g, were housed in temperature and humidity controlled rooms under 12 hour light/dark cycles with food and water ad libitum. All procedures for animal experimentation were followed in accordance with the local Animal Experimentation Ethics Committee Guidelines for the Care and Use of Laboratory Animals at the School of Medicine of the University of São Paulo.
NASH induction
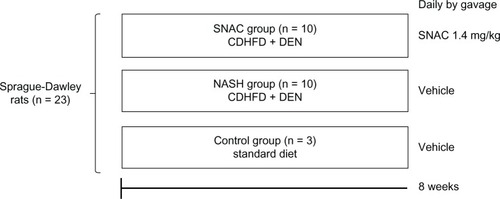
NASH with fibrosis was induced in animals with a choline-deficient, high fat diet (35% total fat, 54% trans fatty enriched; Rhoster Ltda, Brazil) and the administration of 13–15 mg/day of DEN added in the drinking water at a concentration of 135 mg/L for 8 weeks.Citation19 The animals were randomized and divided into three groups: NASH (n = 10), SNAC (n = 10), and control (n = 3). The NASH and SNAC groups received the choline-deficient, high fat diet and DEN; the SNAC group received SNAC daily by gavage (8.0 μmol/kg = 1.4 mg/kg) and NASH animals received the vehicle (Ringer’s solution). Control animals were fed ad libitum with a standard diet (Nuvilab® Nutrientes Ltda, Colombo, Brazil) and received the vehicle through gavage. After 8 weeks, the animals were anesthetized with intraperitoneal ketamine (0.1 mL/kg) and sacrificed (). Samples of liver tissue were obtained for collagen morphometry, nitrotyrosine immunohistochemistry, and gene expression analysis. The association of DEN with a choline-deficient, high fat diet was intended to promote advanced fibrosis within a relative short time in the context of experimental steatohepatitis, as previously published.Citation19
Figure 1 Scheme of the study design describing the three groups of animals treated over eight weeks with: standard diet and oral vehicle (control group); choline-deficient high fat diet plus diethylnitrosamine (CDHFD + DEN) and oral vehicle (nonalcoholic steatohepatitis group); and CDHFD + DEN and oral S-nitroso-N-acetylcysteine (SNAC) solution (1.4 mg/kg) (SNAC group).
Collagen morphometry
Collagen was quantified in the histological sections using the picrosirius red staining method with sections examined using an optical microscope (Nikon E-800, Shinagawa-Ku, Tokyo, Japan). Quantification was performed in ten different histological fields of greater collagen deposition of the same histological section considering the heterogeneous distribution of injury in the samples and the different damage patterns.Citation20 This criterion was standardized for all animals in a blinded manner. The collagen fiber area was quantified using the Image Pro-Plus 4.5 software (Media Cybernetics Inc, Warrendale, PA , USA), and the means and standard deviations were calculated. The results were expressed as the percentage of the area occupied by collagen in the liver parenchyma of each animal, relative to the total field.
Nitrotyrosine immunohistochemistry
Nitrotyrosine immunohistochemistry was performed to assess whether SNAC administration increased peroxynitrite levels in the liver, since NO released by SNAC, in combination with superoxide might lead to peroxynitrite formation. Liver slides were subjected to the antigen retrieval process in citric buffer (10 mM, pH 6.0) in a pressure cooker for 3.5 minutes. After blockade with 6% H2O2 solution, slides were incubated in a humidifying chamber overnight at 4°C with mouse anti-nitrotyrosine monoclonal antibody (A-21285; Life Technologies, Carlsbad, CA, USA; 1:200). Samples were then incubated with SuperPicture Poly HRP conjugate (Zymed, San Francisco, CA, USA) for 30 minutes at 37°C, developed in diaminobenzidine (DAB) solution (Sigma, St Louis, MO, USA), and counterstained with Harris hematoxylin. Evaluation consisted of counting positive nitrotyrosine immunostaining hepatocytes per mm2 of tissue. The intensity of immunostaining was scored on a 4-tiered scale (0 to 3+), with 0 indicating no staining, 1+ indicating weak staining, 2+ indicating moderate staining, and 3+ indicating strong staining.
Tissue RNA extraction
Liver tissue samples, received in liquid nitrogen, were fragmented in a tissue pulverizer (Mikro-Dismembrenator II, B. Braun, Melsugen, Germany). After the pulverization, 1.0 mL of TRIzol® was added (Life Technologies) to the mixture, which was incubated for 5 minutes at room temperature. Two hundred microliters of chloroform was added to the solution, which was stirred vigorously for 15 seconds, and then incubated for 5 minutes at room temperature. The solution was then centrifuged for 15 minutes at 12,000 rpm at 4°C (Eppendorf 5417-R, Hamburg, Germany). The supernatant was transferred to a new 1.5 mL sterile tube, and RNA was precipitated with 500 μL of isopropanol. The mixture was allowed to stand for 10 minutes and centrifuged for 15 minutes at 12,000 rpm at 4°C. The supernatant was removed and the RNA at the bottom was washed with 1.0 mL of ethanol (70%), centrifuged again, and resuspended in an appropriate volume of sterile water (UltraPure™ DNase/RNase-Free Distilled Water [Life Technologies]).
Real time quantitative reverse transcription polymerase chain reaction (RT-qPCR)
The RT-qPCR reactions for TIMP-1 and -2, MMP-9, and HSP-60 and -90 were performed using the Rotor-Gene RG-3000 (Corbett Research, Sydney, Australia) and the reagent set of the SuperScript™ III Platinum® One-Step Quantitative RT-PCR System (Life Technologies) as recommended by the manufacturer. Gene expression intensities were obtained using threshold cycle (CT) values, in which the signal increase associated with the fragment amplification exponential phase begins to be detected. The reaction for each analyzed gene was carefully standardized to avoid nonspecific amplification. The annealing temperature for amplification of all genes was 60°C. All RT-qPCR reactions were performed in duplicate for each sample of liver tissue for both the target gene and for the control, P-actin. The primers for the genes of TIMP-1, TIMP-2, MMP-9, HSP-60, HSP-90, and P-actin were designed using the Primer3 Input program (http://frodo.wi.mit.edu/). The P-actin gene was used as an endogenous control. The sequences of primers for each gene were as follows: – HSP-60 forward: AGC AAA GGG GCT AAT CCA GT; HSP-60 reverse: TGA CAC CCT TTC TTC CAA CC; – HSP-9 forward: GAT TGA CAT CAT CCC CAA CC; HSP-90 reverse: CTG CTC ATC ATC GTT GTG CT; – TIMP-1 forward: TCC CCA GAA ATC ATC GAG AC; TIMP-1 reverse: TCA GAT TAT GCC AGG GAA CC; – TIMP-2 forward: GCA TCA CCC AGA AGA AGA GC; TIMP-2 reverse: GGG TCC TCG ATG TCA AGA AA; – MMP-9 forward: CAA ACC CTG CGT ATT TCC AT; MMP-9 reverse: AGA GTA CTG CTT GCC CAG GA.
For MMP-2, MMP-13, TGFβ-1, and collagen-1α, total RNA was reverse transcribed to yield cDNA and preamplified using the TaqMan® PreAmp Master Mix Kit (Applied Biosystems, Foster City, CA, USA). Profibrogenic and fibrolytic related genes were analyzed by RT-qPCR (ABI PRISM® 7000, Applied Biosystems). a-Actin gene expression was used as a housekeeping endogenous control. All primers and probes were purchased from Applied Biosystems (Assay ID: β-actin: 4331348; collagen-1a: Rn00801649_q1; TGFβ-1: Rn00572010_m1; MMP-2: Rn01538167_m1; TIMP-1: Rn00587558_m1 and MMP-13: Rn01448191_g1). Analysis of relative gene expression data was performed according to the 2(-Delta Delta C[T]) methodCitation21 and was expressed as fold increase over values obtained from control rats.
Statistical analysis
All data were expressed as the mean or median depending on the variable distribution, with standard deviation (SD) values. For Gaussian distribution variables, t-test, one-way ANOVA, and Newman-Keuls Multiple Comparison Posttest were used. For non Gaussian distribution variables, Mann-Whitney, Kruskal–Wallis, and Dunn’s Multiple Comparison Posttests were used. A P-value less than 0.05 was deemed statistically significant. All calculations and graphics were made using SPSS 17.0 (SPSS Inc, Chicago, IL, USA) and GraphPad Prism v5.0 (GraphPad Software Inc, La Jolla, CA, USA).
Results
Kinetics of SNAC formation and decomposition
show the UV-Vis absorption spectra of SNAC obtained in the S-nitrosation reaction of NAC. The absorption bands at 336 and 545 nm are assigned to the π → π and nN → π electronic transitions of the SNO moiety of the molecule, respectively,Citation22 confirming SNAC formation. shows a representative kinetic curve of SNAC formation during its synthesis from NAC at pH 4.5 and 25°C, based on monitoring of the absorption band at 545 nm. The reaction was observed to be relatively fast under this condition, with a yield of approximately 90% after 3 minutes.
Figure 2 (A and B) Ultraviolet-visible spectral changes associated with the formation of S-nitroso-N-acetylcysteine (SNAC) through the S-nitrosation of N-acetylcysteine (NAC) with nitrous acid showing the two absorption bands characteristic of primary S-nitrosothiols with maxima at 336 and 545 nm. The concentration of the SNAC solution is 1 and 40 mM, respectively. (C) Kinetic curve of SNAC formation during the S-nitrosation of NAC based on the absorption band of SNAC at 545 nm. Inset: SNAC structure. (D) Kinetic curve of SNAC decomposition in simulated gastric fluid at a concentration of 1 mM, pH 1.5 and 37°C over 4 hours based on the absorption band of SNAC at 336 nm.
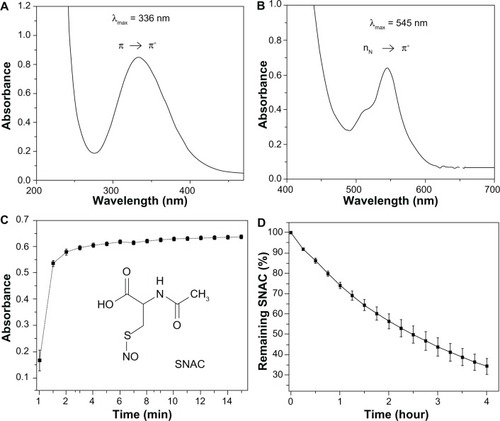
shows the kinetic curve of 1 mM SNAC decomposition in SGF (pH 1.5) at 37°C over 4 hours, based on its absorption band at 336 nm. The disappearance of this band gives a real time measurement of the SNAC decomposition in this medium. The intensity of the band was shown to be decreased by approximately 40% after 2 hours, which represents the time estimated for gastric emptying of approximately 50% of the ingested food.Citation23
Dietary ingestion and weight gain
NASH animals showed a lower median dietary intake when compared with SNAC animals (10.83 mg ± 0.56 versus 11.99 mg ± 1.27, respectively; P = 0.0002), and there was no difference in weight gain (P = 0.393).
Collagen morphometry
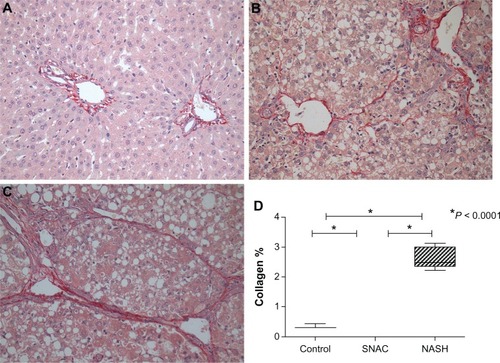
The percentages of the collagen occupied area relative to the total field were 0.33 ± 0.07 for the control group, 1.75 ± 0.27 for the SNAC group, and 2.48 ± 0.34 for the NASH group. The differences in collagen quantification were highly significant between all groups (P < 0.0001), with SNAC treated animals showing a reduction of 34.4% in the collagen occupied area when compared with the NASH group ().
Figure 3 Representative picrosirius red staining images of hepatic histology of (A) control, (B) nonalcoholic steatohepatitis (NASH), and (C) S-nitroso-N-acetylcysteine (SNAC) treated animals. Magnification is × 200. (D) Collagen quantification of the control, SNAC, and NASH groups.
Nitrotyrosine immunohistochemistry
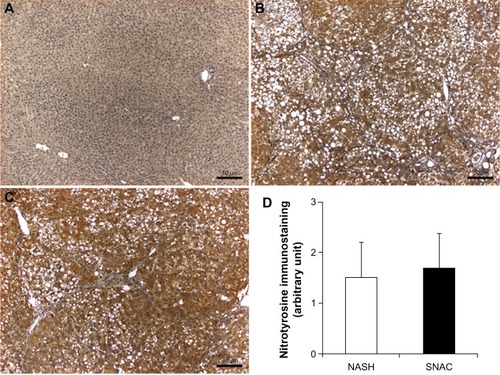
No immunostaining reaction for nitrotyrosine was observed in normal liver sections. In liver sections of the NASH and SNAC groups, nitrotyrosine produced weak to moderate diffuse cytoplasmic immunostaining reactions for nitrotyrosine in all hepatocytes. However, there were no differences between the NASH and SNAC groups ().
Figure 4 Representative nitrotyrosine immunostaining of liver sections.
Expression of genes involved in fibrogenesis
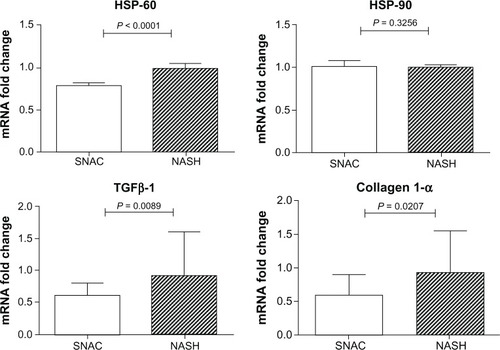
The median expression of MMP-13 was significantly higher in the SNAC group when compared with the NASH group [1.70 (1.15 – 2.82) versus 0.98 (0.71–1.3), respectively; P = 0.0005], and the same was noted regarding MMP-9 expression [1.90 (1.156–2.23) versus 0.81 (0.52–1.05), respectively; P < 0.0001]. In addition, the expression of TIMP-2 was lower in the SNAC group than in the NASH group [0.68 (0.48–0.88) versus 1.04 (0.91–3.78), respectively; P < 0.0001]. No differences were found in the expression of TIMP-1 and MMP-2 between the two groups (P = 0.842 and P = 0.123, respectively). There was a marked reduction in TGFβ-1 expression in SNAC treated animals [0.61 (0.35–0.80) versus 0.92 (0.41–1.60), respectively; P = 0.0089], and the same was noted regarding collagen-1α expression [0.59 (0.28–0.90) versus 0.93 (0.52–1.55), respectively; P = 0.0207] ().
Figure 5 Fold change in matrix metalloproteinase (MMP)-13 and -9, and tissue inhibitor of metalloproteinases (TIMP)-1 and -2 mRNA expression in the nonalcoholic steatohepatitis groups against S-nitroso-N-acetylcysteine groups.
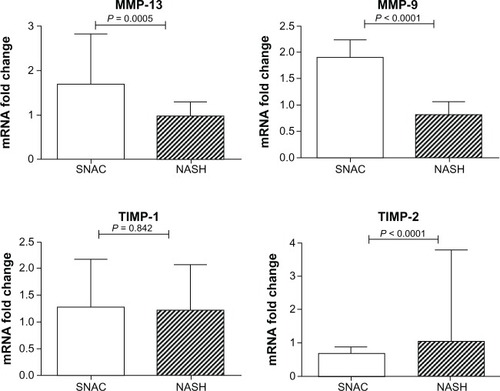
Figure 6 Fold change in heat-shock protein (HSP)-60 and -90, transforming growth factor β-1, and collagen 1α mRNA expression in the nonalcoholic steatohepatitis groups against S-nitroso-N-acetylcysteine groups.
Expression of genes involved in oxidative stress
As shown in , HSP-60 was significantly less expressed in the SNAC group [0.78 (0.75–0.81)] when compared with the NASH group [median: 0.98 (0.95–1.04); P < 0.0001]. However, there was no difference in HSP-90 expression between these groups [1.00 (0.97–1.07) versus 0.99 (0.94–1.02), respectively; P = 0.326].
Discussion
SNAC formation from the S-nitrosation of NAC in aqueous acidic sodium nitrite solution is a fast reaction, allowing the easy preparation of SNAC immediately before use, and this is an important point for therapeutic purposes. The reaction can be written as follows:
where R = C5H6 NO3, and nitrous acid (HONO) is formed from the protonation of nitrite according to EquationEquation 3(3) :
In the SNAC structure, an acetyl group is attached to the nitrogen atom of an S-nitrosated cysteine molecule (, inset). Calculations described elsewhereCitation13 have shown that SNAC may establish an intramolecular hydrogen bond between the hydrogen atom of the amino group and the oxygen atom of the NO group in a seven-membered ring, favored by a second hydrogen bond between the hydrogen of the carboxyl group and the carbonyl oxygen of the acetate group. In this optimized geometry, the SNO group remains sterically unprotected and may undergo oxidation and dimerization reactions. In the last case, spontaneous S-N bond cleavage is favored by the low dissociation energy of the S-N bond (152.9 kJ mol−1)Citation13 and this reaction can be considered the main pathway of NO release by this molecule (EquationEquation 1(1) ). In the particular condition of the stomach medium, SNAC decomposition is expected to lead to the formation of HONO and NAC (a free thiol, RSH):
Both intact SNAC and HONO formed in the acid catalyzed decomposition reaction are nitrosating agents, capable of modifying enzymes through transnitrosation reactions.Citation24 SNAC is also expected to undergo homolytic bond cleavage with release of free NO (EquationEquation 1(1) ), which may cross the gastric epithelium easily to exert a gastric vasodilator effect. Finally, NAC may also exert antioxidant actions.Citation11 Therefore, oral administration of SNAC leads to a mixture of species capable of exerting nitrosating, antioxidant, and vasodilator actions in the gastric mucosa. The decomposition of approximately 40% of SNAC in SGF after 2 hours means that most of its biochemical actions are expected to be maintained during its residence time in the stomach (). Diffusion of intact SNAC through the gastrointestinal mucosa may thus propagate these actions systemically, reaching the liver, where a local reduction of oxidative stress may be achieved.
Previous reports have demonstrated that SNAC can induce the differentiation of myofibroblasts into a lipocyte phenotype in a murine hepatic stellate cell line, with concomitant reduction of profibrogenic molecules and upregulation of MMP-13.Citation25 In the present study, we demonstrate in vivo for the first time that SNAC displays antifibrotic activity in an animal model of DEN induced NASH and that this action is associated with downregulation of profibrogenic molecules and upregulation of MMP-13, the latter of which plays a key role in the degradation of interstitial collagen in liver fibrosis. The smaller dietary intake of animals not receiving SNAC, compared with those receiving SNAC, can be attributed to a worse health condition that developed in NASH during the treatment, considering that these animals had more hepatic collagen deposition at the end of the study.
Collagen quantification by collagen fiber morphometry, which shows a good correlation between the amounts of tissue bound picrosirius red staining quantification,Citation26 demonstrated the beneficial effects of SNAC over fibrogenesis because SNAC treated animals showed a 34.4% reduction in the relative volume occupied by collagen when compared with the NASH group (P < 0.0001, ).
The attenuation of fibrosis promoted by SNAC in this particular experimental model is in accordance with that in previous studies,Citation14,Citation16,Citation18 which showed that SNAC could positively interfere with known triggers of liver fibrosis in NASH/NAFLD pathogenesis.Citation3,Citation6 The beneficial effects of SNAC observed in the present work are also in agreement with results already reported in an experimental biliary cirrhosis model, where the authors demonstrated that SNAC treated animals displayed lower accumulation of histologically detectable fibrosis, accompanied by downregulation of collagen-1α and decreased expression of smooth muscle specific α actin (αSMA).Citation27 More recently, other reports have shown that SNAC can induce differentiation of myofibroblasts into a lipocyte phenotype in the GRX cell line and decrease αSMA gene expression.Citation25 It must be highlighted that SNAC did not negatively interfere with the regulation of TIMP-1 but led to diminished expression of TIMP-2 because a significant reduction in TIMP-2 was also observed in previous reports during fibrosis resolutionCitation28,Citation29 with an associated increase in the overall collagenase activity and extracellular matrix degradation.Citation30,Citation31 Data from chronic toxic liver injury in mice also sets TIMP-2 as an MMP-2 activator, leading to pathological collagen degradation, and consequently, degradation of normal liver matrix.Citation32 Our results are consistent with this concept because SNAC did not upregulate MMP-2 expression and downregulated TIMP-2 expression, leading to an antifibrogenic gene expression profile ().
One of the most intriguing findings reflecting SNAC’s beneficial effect over liver fibrosis was the upregulation of MMP-13 in SNAC treated animals (). MMP-13 has been characterized by its ability to degrade fibrillar collagens, such as collagen type I, the main collagen deposited in liver fibrosis. Previous studies have emphasized the importance of collagen type I initial cleavage for the overall regression of liver fibrosis because mice expressing a mutated, cleavage resistant collagen type I were unable to resolve fibrosis.Citation33,Citation34 Experimental studies have also shown that MMP-13 expression is markedly enhanced during the recovery phase of liver fibrosis.Citation5 It is also noteworthy that SNAC induced downregulation of TGF-β1, the most potent stimulus for collagen I production, and downregulated collagen-1α mRNA expression, two important additional findings of SNAC’s ability to attenuate hepatic fibrosis. The absence of TIMP-1 downregulation associated with upregulation of MMP-13 observed in SNAC treated animals may be justified by SNAC induced downregulation of TIMP-2 and suppression of TGF-β. SNAC treated animals also showed increased expression of MMP-9. This MMP itself exhibits no activity against collagen type I. Nevertheless, an indirect involvement of MMP-9 in fibrolysis has been assumed because MMP-9 expression increases at the beginning of fibrolysis.Citation35–Citation37 A possible mechanism may involve an indirect contribution of MMP-9 to fibrolysis by accelerating HSC apoptosis.Citation38 In line with its known antioxidant effects, we found that SNAC led to decreased expression of HSP-60, an oxidative stress related gene, suggesting a possible protective effect of SNAC in oxidative stress and corroborating the collagen quantification performed in the present study ().Citation39,Citation40 Although these findings, based on mRNA expression levels, show a coherent set of changes associated with the attenuation of liver collagen deposition in the SNAC treated animals, it must be taken into account that mRNA expression levels are not always directly correlated with protein expression levels and that our mRNA level results may be only correlative, instead of causative. Therefore, further studies to measure both mRNA expression levels and protein concentrations are needed to establish the existing correlations between changes in mRNA expression induced by SNAC treatment and protein expression.
The beneficial effects of oral SNAC administration over liver fibrosis may be associated with either direct antioxidant action of SNAC in primary reactions with reactive oxygen species or the secondary reaction of free NO released in a primary enzymatic reduction of SNAC to NAC plus NO (EquationEquation 1(1) ). In the second case, the formed NAC may also exert a protective effect as already described in the literature.Citation39,Citation40 It must be noted that although NAC is a notorious antioxidant, SNAC is already reported to have a more effective antioxidant action than NAC in in vitroCitation15 and in vivo.Citation14 In the last case, oral SNAC administration in an animal model of NAFLD led to a significant decrease in the concentration of hydroperoxides in the liver homogenate when compared with the control group or with the administration of NAC at a dose five times higher. The protective action of SNAC in the present study may be due, in part, to its ability to act as an exogenous source of NO, leading to an increased local or systemic availability of NO. A common concern in the administration of exogenous NO in oxidative stress conditions is that NO may lead to increased peroxynitrite (OONO−) production with a consequent increase in nitrotyrosine formation (a marker of OONO− production). The intense positivity of nitrotyrosine staining for the NASH and SNAC groups observed in is expected, since both groups developed NASH with liver injury. The absence of difference in the nitrotyrosine staining between the NASH and SNAC groups () is evidence that SNAC administration did not lead to a significant increase in OONO− formation due to a possible increase in hepatic NO concentration, as might be expected.
In conclusion, we show for the first time that oral administration of SNAC leads to an antifibrogenic effect in experimental NASH. Because longitudinal outcome studies have shown the prognostic importance of liver fibrosis for the natural history of NAFLD,Citation41,Citation42 these findings may represent a possible strategy to attenuate fibrosis in NASH.
Acknowledgments
This study was supported by grants from FAPESP – Fundação de Amparo à Pesquisa do Estado de São Paulo (project #08/56157-7). DFCM and GFPS received a fellowship from FAPESP (projects #08/52454-7 and #11/50514-5, respectively). MGO acknowledges financial support from Conselho Nacional de Desenvolvimento Científico e Tecnológico, CNPq (projects #309390/2011-7 and 482646/2010-1). We would like to thank Heraldo Possolo de Souza and Francisco Garcia Soriano for technical support and Fabio Marra for critically reading the manuscript.
Disclosure
The authors declare no conflict of interest in this work.
References
- Sherman M Hepatocellular carcinoma: epidemiology, surveillance, and diagnosis Semin Liver Dis 2010 30 1 3 16 20175029
- Byrne CD Olufadi R Bruce KD Cagampang FR Ahmed MH Metabolic disturbances in non-alcoholic fatty liver disease Clin Sci (Lond) 2009 116 7 539 564 19243311
- Lewis JR Mohanty SR Nonalcoholic fatty liver disease: a review and update Dig Dis Sci 2010 55 3 560 578 20101463
- Hernandez-Gea V Friedman SL Pathogenesis of liver fibrosis Annu Rev Pathol 2011 6 425 456 21073339
- Roderfeld M Hemmann S Roeb E Mechanisms of fibrinolysis in chronic liver injury (with special emphasis on MMPs and TIMPs) Z Gastroenterol 2007 45 1 25 33 17236118
- Friedman SL Mechanisms of hepatic fibrogenesis Gastroenterology 2008 134 6 1655 1669 18471545
- Hemmann S Graf J Roderfeld M Roeb E Expression of MMPs and TIMPs in liver fibrosis – a systematic review with special emphasis on anti-fibrotic strategies J Hepatol 2007 46 5 955 975 17383048
- Rubbo H Radi R Trujillo M Nitric oxide regulation of superoxide and peroxynitrite-dependent lipid peroxidation: Formation of novel nitrogen-containing oxidized lipid derivatives J Biol Chem 1994 269 42 26066 26075 7929318
- Ignarro LJ Napoli C Loscalzo J Nitric oxide donors and cardiovascular agents modulating the bioactivity of nitric oxide: an overview Circ Res 2002 90 1 21 28 11786514
- Williams DL A chemist’s view of the nitric oxide story Org Biomol Chem 2003 1 3 441 449 12926240
- Aitio M N-acetylcysteine – passe-partout or much ado about nothing? Br J Clin Pharmacol 2006 61 1 5 15 16390346
- Ricardo KF Shishido SM de Oliveira MG Krieger MH Characterization of the hypotensive effect of S-nitroso-N-acetylcysteine in normotensive and hypertensive conscious rats Nitric Oxide 2002 7 1 57 66 12175821
- de Oliveira MG Shishido SM Seabra AB Morgon NH Thermal stability of primary S-nitrosothiols: roles of autocatalysis and structural effects on the rate of nitric oxide release J Phys Chem A 2002 106 38 8963 8970
- Oliveira CP Simplicio FI de Lima VM Oral administration of S-nitroso-N-acetylcysteine prevents the onset of non alcoholic fatty liver disease in rats World J Gastroenterol 2006 12 12 1905 1911 16609997
- Simplicio FI Seabra AB de Souza GFP de Oliveira MG In vitro inhibition of linoleic acid peroxidation by primary S-nitrosothiols J Braz Chem Soc 2010 10 21 1885 1895
- Oliveira CP de Lima VM Simplicio FI Prevention and reversion of nonalcoholic steatohepatitis in OB/OB mice by S-nitroso-N-acetylcysteine treatment J Am Coll Nutr 2008 27 2 299 305 18689562
- Oliveira CP Alves VA Lima VM Modulation of hepatic microsomal triglyceride transfer protein (MTP) induced by S-nitroso-N-acetylcysteine in ob/ob mice Biochem Pharmacol 2007 74 2 290 297 17524368
- de Oliveira CP Stefano JT de Lima VM Hepatic gene expression profile associated with non-alcoholic steatohepatitis protection by S-nitroso-N-acetylcysteine in ob/ob mice J Hepatol 2006 45 5 725 733 16935387
- de Lima VM Oliveira CP Alves VA A rodent model of NASH with cirrhosis, oval cell proliferation and hepatocellular carcinoma J Hepatol 2008 49 6 1055 1061 18929425
- Cogliati B Pereira Hde M Dagli ML Parra OM Silva JR Hernandez-Blazquez FJ Hepatotrophic factors reduce hepatic fibrosis in rats Arq Gastroenterol 2010 47 1 79 85 20520980
- Livak KJ Schmittgen TD Analysis of relative gene expression data using real-time quantitative PCR and the 2(-Delta Delta C(T)) Method Methods 2001 25 4 402 408 11846609
- Timerghazin QK Peslherbe GH English AM Resonance description of S-nitrosothiols: insights into reactivity Org Lett 2007 9 16 3049 3052 17616141
- Martínez V Wang L Rivier JE Vale W Taché Y Differential actions of peripheral corticotropin-releasing factor (CRF), urocortin II, and urocortin III on gastric emptying and colonic transit in mice: role of CRF receptor subtypes 1 and 2 J Pharmacol Exp Ther 2002 301 2 611 617 11961064
- Gaston B Nitric oxide and thiol groups Biochim Biophys Acta 1999 1411 2 323 333 10320666
- Stefano JT Cogliati B Santos F S-Nitroso-N-acetylcysteine induces de-differentiation of activated hepatic stellate cells and promotes antifibrotic effects in vitro Nitric Oxide 2011 25 3 360 365 21820071
- James J Bosch KS Aronson DC Houtkooper JM Sirius red histophotometry and spectrophotometry of sections in the assessment of the collagen content of liver tissue and its application in growing rat liver Liver 1990 10 1 1 5 2308475
- Vercelino R Crespo I de Souza GF S-nitroso-N-acetylcysteine attenuates liver fibrosis in cirrhotic rats J Mol Med (Berl) 2010 88 4 401 411 20062961
- Iredale JP Benyon RC Pickering J Mechanisms of spontaneous resolution of rat liver fibrosis. Hepatic stellate cell apoptosis and reduced hepatic expression of metalloproteinase inhibitors J Clin Invest 1998 102 3 538 549 9691091
- Issa R Zhou X Constandinou CM Spontaneous recovery from micronodular cirrhosis: evidence for incomplete resolution associated with matrix cross-linking Gastroenterology 2004 126 7 1795 1808 15188175
- Ramachandran P Iredale JP Reversibility of liver fibrosis Ann Hepatol 2009 8 4 283 291 20009126
- Wang Z Juttermann R Soloway PD TIMP-2 is required for efficient activation of proMMP-2 in vivo J Biol Chem 2000 275 34 26411 26415 10827175
- Benyon RC Arthur MJ Extracellular matrix degradation and the role of hepatic stellate cells Semin Liver Dis 2001 21 3 373 384 11586466
- Issa R Zhou X Trim N Mutation in collagen-1 that confers resistance to the action of collagenase results in failure of recovery from CCl4-induced liver fibrosis, persistence of activated hepatic stellate cells, and diminished hepatocyte regeneration FASEB J 2003 17 1 47 49 12475903
- Okazaki I Watanabe T Hozawa S Niioka M Arai M Maruyama K Reversibility of hepatic fibrosis: from the first report of collagenase in the liver to the possibility of gene therapy for recovery Keio J Med 2001 50 2 58 65 11450593
- Ueberham E Löw R Ueberham U Schönig K Bujard H Gebhardt R Conditional tetracycline-regulated expression of TGF-beta1 in liver of transgenic mice leads to reversible intermediary fibrosis Hepatology 2003 37 5 1067 1078 12717387
- Knittel T Mehde M Grundmann A Saile B Scharf JG Ramadori G Expression of matrix metalloproteinases and their inhibitors during hepatic tissue repair in the rat Histochem Cell Biol 2000 113 6 443 453 10933221
- Roderfeld M Weiskirchen R Wagner S Inhibition of hepatic fibrogenesis by matrix metalloproteinase-9 mutants in mice FASEB J 2006 20 3 444 454 16507762
- Zhou X Murphy FR Gehdu N Zhang J Iredale JP Benyon RC Engagement of alphavbeta3 integrin regulates proliferation and apoptosis of hepatic stellate cells J Biol Chem 2004 279 23 23996 234006 15044441
- Galicia-Moreno M Rodríguez-Rivera A Reyes-Gordillo K N-acetylcysteine prevents carbon tetrachloride-induced liver cirrhosis: role of liver transforming growth factor-beta and oxidative stress Eur J Gastroenterol Hepatol 2009 21 8 908 914 19398917
- Baumgardner JN Shankar K Hennings L Albano E Badger TM Ronis MJ N-acetylcysteine attenuates progression of liver pathology in a rat model of nonalcoholic steatohepatitis J Nutr 2008 138 10 1872 1879 18806095
- Ekstedt M Franzén LE Mathiesen UL Long-term follow-up of patients with NAFLD and elevated liver enzymes Hepatology 2006 44 4 865 873 17006923
- Argo CK Caldwell SH Epidemiology and natural history of nonalcoholic steatohepatitis Clin Liver Dis 2009 13 4 511 531 19818302