
Abstract
Background
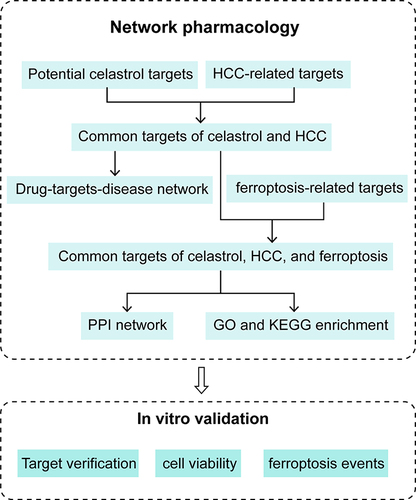
As a traditional Chinese medicine monomer derived from Tripterygium wilfordii Hook.f. with potential anticancer activity, celastrol can induce ferroptosis in hepatic stellate cells and inhibit their activation to alleviate liver fibrosis. Activation of ferroptosis can effectively inhibit Hepatocellular carcinoma (HCC). Whether celastrol inhibits HCC by inducing ferroptosis remains to be studied.
Purpose
To explore the potential targets of celastrol against HCC through ferroptosis based on network pharmacology and to verify the anticancer effect of celastrol on HepG2 cells.
Methods
We collected celastrol targets, HCC, and ferroptosis-related genes through online databases, and got their intersection targets. Subsequently, we obtained a protein-protein interaction (PPI) network, and performed gene ontology (GO) and Kyoto Encyclopedia of Genes and Genomes (KEGG) pathway enrichment analysis to gain key genes for further study. They were verified in vitro and were performed molecular docking. The changes in cell proliferation and ferroptosis characteristics of HepG2 cells after celastrol treatment were detected.
Results
31 core target genes were screened for PPI network and enrichment analysis. The most significantly related KEGG pathway was chemical carcinogenesis-reactive oxygen species. The mRNA and protein levels of GSTM1 were significantly decreased after celastrol treatment. Molecular docking demonstrated the interaction between celastrol and GSTM1. Ferroptosis was induced and cell proliferation was inhibited by celastrol in HCC cells.
Conclusion
Celastrol induces ferroptosis in HCC via regulating GSTM1 expression and may serve as a novel therapeutic compound with clinical potential in HCC treatment.
Graphical Abstract
Introduction
Liver cancer poses a significant challenge to global health, with a yearly incidence surpassing 850,000 individuals worldwide and displaying an uptrend.Citation1 Hepatocellular carcinoma (HCC) represents the predominant form of primary liver tumor, accounting for approximately 90% of cases.Citation2 Mass evidence suggests that activation of ferroptosis may effectively inhibit HCC.Citation3 Copper metabolism MURR1 domain 10 (COMMD10) protein enhanced ferroptosis and increased sensitivity to radiation therapy in HCC.Citation4 This effect was achieved by disrupting the homeostasis of copper and iron and by inhibiting the HIF1α/CP loop. The neutralizing antibody of iron-chelating cytokine LCN2 enhanced the ferroptosis induction and anticancer effect of sorafenib on xenografts derived from HCC patients with high LCN2 expression.Citation5 Glutamine synthase 2 (GLS2) is a tumor suppressor, which can promote ferroptosis by regulating glutamine decomposition to exert tumor suppressor function.Citation6 The findings from these studies indicate that promoting ferroptosis could be a promising approach for treating HCC.
Ferroptosis is a new mode of cell death with dependence on iron and the accumulation of lipid peroxidation.Citation7 It is regulated by a variety of cellular metabolic pathways, including iron metabolism, amino acid, lipid, sugar metabolism, and various signaling pathways associated with diseases.Citation8 Celastrol is an extract extracted from the roots of Chinese medicine Tripterygium wilfordii Hook.f., showing mass biological activities, including anti-obesity, anti-inflammatory, and anti-cancer. However, few studies focused on the potential of celastrol in treating HCC. Studies have shown that celastrol can inhibit HSC (hepatic stellate cell) activation and reduce liver fibrosis by inducing ferroptosis.Citation9 Liu Ming et al reported that ferroptosis inducer, erastin, together with celastrol synergistically induced non-small cell lung cancer cell death. Celastrol treatment in vitro and in vivo can significantly reduce GSH levels and induce ferroptosis in clear cell renal cell carcinoma (ccRCC).Citation10 The above evidence indicates that celastrol has the potential to be an inducer of ferroptosis, and we hence speculate that celastrol-induced ferroptosis may benefit HCC treatment in clinical practice.
Therefore, we aimed to explore the mechanism by which celastrol induces ferroptosis in HCC based on network pharmacology and in vitro experiments. Firstly, network pharmacology was employed to screen the celastrol target genes, HCC-related targets, and ferroptosis-related targets. Secondly, we constructed a relationship diagram among celastrol, HCC, and ferroptosis as well as enrichment analysis. Finally, we identified that celastrol may inhibit HCC cell proliferation by inducing ferroptosis in HepG2 cells. Our results could provide a reference for carrying on further studies for celastrol in the treatment of HCC.
Materials and Methods
Collecting HCC and Celastrol Targets
12199 HCC-related target genes were obtained from the GeneCards (https://www.genecards.org/) databaseCitation11 using “Hepatocellular carcinoma” as the keyword. The 2D structure in the SDF format of celastrol was downloaded from the PubChem (https://pubchem.ncbi.nlm.nih.gov/) database.Citation12 The potential targets of celastrol were acquired by uploading the 2D structure of celastrol to the PharmMapper (http://www.lilab-ecust.cn/pharmmapper/) database.Citation13 The UniProt (https://www.uniprot.org/) databaseCitation14 was used for the annotation of the names of the corresponding targets.
Obtaining Shared Targets Between Celastrol and HCC
We utilized the “Draw Venn Diagram” online tool (http://bioinformatics.psb.ugent.be/webtools/Venn/) to generate Venn diagrams demonstrating the overlapping targets between celastrol and HCC. Visualization of the cross-targets of celastrol and HCC was performed by Cytoscape_v3.9.1.
PPI Network Construction
We obtained 564 ferroptosis-related genes from the FerrDb database (http://www.zhounan.org/ferrdb/index.html).Citation15 By intersecting these genes with the target genes of celastrol and HCC, we obtained 31 candidate genes. The 31 genes were put into the STRING database (https://cn.string-db.org/)Citation16 to create a PPI network. The results were exported as a “tsv” file, which was subsequently imported into the Cytoscape_v3.9.1 software. We utilized the MCODE plugin to refine the network map.
GO and KEGG Pathway Enrichment Analysis
GO and KEGG enrichment analyses were conducted by importing 31 candidate genes into the INPUT database (http://cbcb.cdutcm.edu.cn/INPUT/).Citation17
Survival Analysis
The Kaplan-Meier Plotter (https://kmplot.com/analysis/) database was employed to assess the impact of key genes on the overall survival (OS) of patients with HCC.Citation18 The gene name was entered under the pan-cancer RNA-seq plate in the KM database, and the OS curves and ROC curves were generated based on default parameters.
Molecular Docking
The structure of compound celastrol in the SDF format was obtained from the PubChem database (https://pubchem.ncbi.nlm.nih.gov/). Protein structures in the PDB format were gained from the RCSB database (https://www.rcsb.org/).Citation19 Software MOE 2022 was used for molecular docking. After saving the compound celastrol in the mol register, we load it into MOE (Molecular Operating Environment) software. The default MOE parameters were applied for energy minimization. Energy and 3D protonation of target protein structures were minimized using standard MOE program parameters. For interactions, ligand-protein complexes were examined and their 3D images were visualized using the PyMol software. The visualization of corresponding 2D images was generated by MOE software.
Cell Culture and Transfection
The human HCC cell line HepG2 was purchased from the Cell Bank of the Shanghai Chinese Academy of Sciences (SCSP-510, Shanghai, China). Cells were cultured in minimum essential Medium (MEM) (Hyclone, UT, USA) supplemented with 10% fetal bovine serum (FBS, Gibco, NY, USA), 1% glutamine (Gibco, NY, USA), 1% sodium pyruvate (Gibco, NY, USA), 1% non-essential amino acids (Gibco, NY, USA) in the incubator at 37 °C with 5% CO2. Sangon Biotech (Shanghai, China) synthesized the pcDNA3.1-GSTM1 and empty vector, which was transfected into HepG2 cells using jetPRIME® - Transfection Reagent (Polyplus, Als, France) according to the manufacturer’s instructions.
Cell Viability Analysis
Cells were cultured in 96-well plates (2 × 10⁴ cells per well), with celastrol (C0869, ≥98% (HPLC), MO, USA) of different concentrations, or co-treated with different ferroptosis inhibitors Ferrostatin-1(Fer-1) (SML0583, Sigma, MO, USA), Deferoxamine mesylate (DFO) (HY-B0988, MCE, NJ, USA) or N-acetylcysteine (NAC) (A9165, Sigma, MO, USA). Cells overexpressing GSTM1 were treated with celastrol (4 μM) for 24 h. A CCK8 kit (CK04, Dojindo, Kyushu, Japan) was used to measure cell viability according to the manufacturer’s instructions.
Iron / MDA / GSH-Px Activity Assay
Cells were cultured in 6-well plates (1 × 10⁶ cells per well), with ferroptosis activators (10 µM erastin, HY-115594, and 10µM RSL3, HY-100218A, MCE, NJ, USA), celastrol (2 µM or 4 µM), or co-treated with ferroptosis inhibitors (10 µM Fer-1, 100 µM DFO or 5 mM NAC) for 24 h. Cells overexpressing GSTM1 were treated with celastrol (4 μM) for 24 h. The levels of iron (Iron Assay Kit, A039-2-1, Jiancheng, Nanjing, China), MDA (Malondialdehyde detection Kit, S0131M, Beyotime, Shanghai, China), and total GSH-Px activity (Glutathione peroxidase activity detection Kit, S0058, Beyotime, Shanghai, China) in cell lysates were determined according to the manufacturer’s instructions.
Iron content in lysates was quantified by standard sample. Cell lysates were mixed with an iron chromogenic agent provided by the kit. After incubating the reaction system in a 100°C metal bath for 5 min, all samples were then cooled in running water, centrifuged at 3500 r for 10 min, and the iron content was measured by optical absorption at 520 nm. The concentration calculation of iron was based on the concentration of protein in each sample following the instructions of the manufacturer.
MDA content in cell lysates was quantified by a standard curve. Cell lysates were mixed with thiobarbituric acid and antioxidant reagent provided by the kit. After incubating the reaction system in a 100°C metal bath for 15 min, all samples were then cooled down in water, centrifuged at 1000 g for 10 min, and the MDA content was measured by optical absorption at 532 nm. The accurate calculation of MDA was based on the total amount of protein in each sample following the instructions of the manufacturer.
GSH-Px activity in cell lysates is quantified by the kinetics at 340 nm following the decrease in the concentration of NADPH (the molar extinction coefficient is 6.22 mM−1 cm−1).Citation20 One enzyme activity unit (1 unit) was defined as 1 µmol NADPH converted into NADP+ within 1 min catalyzed by GSH-Pxs in the presence of GSH, GR, and peroxide (Cum-OOH) at 25°C and pH 8.0.Citation21 In experiments, the volume of the total reaction solution was fixed at 100μL. 50μL cell lysates were mixed with 40μL GPx detection working fluid (35 μL Glutathione peroxidase detection buffer, 2 μL 62.5 mM NADPH, 2 μL 75 mM GSH, 1 μL GR provided by the kit). After incubating the reaction system in room temperature for 15 min, all samples were then mixed with 10 μL peroxide (30 mM Cum-OOH). The absorbance change at 340 nm was immediately measured within 5 min (automatically measured every 1 minute, 6 times) using a microplate reader. The calculation of GSH-Px activity was based on the concentration of protein in each sample following the instructions of the manufacturer.
ROS Measurement
Cells were cultured in 6-well plates (1 × 10⁶ cells per well), with ferroptosis activators (10 µM erastin and 10µM RSL3), celastrol (2 µM or 4 µM), or co-treated with ferroptosis inhibitors (10 µM Fer-1, 100 µM DFO or 5 mM NAC) for 24 h. Cells overexpressing GSTM1 were treated with celastrol (4 μM) for 24 h. Cellular ROS levels (Reactive oxygen species detection Kit, S0033S, Beyotime, Shanghai, China) were detected according to the manufacturer’s instructions. The culture medium was removed. Cells were incubated with serum-free medium containing 10μM DCFH-DA in the dark at 37°C for 20 min. Afterward, the cells were washed with serum-free medium thrice and then were imaged using a fluorescence microscope (PRIMOVERT, Zeiss, Germany). ROS raw data is presented in the Supplementary Figure S1.
Colony Formation Assay
Cells were cultured in 6-well plates (1 × 10⁴ cells per well) for 7 d, treated with celastrol (2 µM or 4 µM), or co-treated with ferroptosis inhibitors (10 µM Fer-1, 100 µM DFO or 5 mM NAC) for another 7d. The cells were rinsed twice in PBS, fixed with 4% paraformaldehyde (E672002, Sangon Biotech, Shanghai, China) for 15 min, rinsed thrice with PBS, and stained for 10 minutes with crystal violet (C0121, Beyotime, Shanghai, China). The crystal violet was washed with running water. Then, the plates were photographed and the colonies were counted by ImageJ software. Colony Formation raw data is presented in the Supplementary Figure S2.
EdU Cell Proliferation Assay
Cells were cultured in 6-well plates (1 × 10⁶ cells per well), with celastrol (2 µM or 4 µM), or co-treated with ferroptosis inhibitors (10 µM Fer-1, 100 µM DFO or 5 mM NAC) for 24 h. Cells overexpressing GSTM1 were treated with celastrol (4 μM) for 24 h. The cells of each well were incubated with 2 mL EdU (10 µM) reagent (BeyoClick TM EdU-488 Cell Proliferation Assay Kit, C0071S, Beyotime, Shanghai, China) at 37°C for 2 h. After that, cells were fixed in 4% paraformaldehyde for 15 min, permeabilized with immunostaining penetrating solution (P0097, Beyotime, Shanghai, China) for 10 min, and then incubated with the click-reaction reagent for 30 min at room temperature away from light. 1x Hoechst33342 reagent was used to stain the nucleus. The stained cells were observed with a fluorescence microscope (PRIMOVERT, Zeiss, Germany), and the data were analyzed by ImageJ software. EdU raw data is presented in the Supplementary Figure S3.
RNA Extraction and Quantitative RT-PCR
Total RNA was extracted with an RNA extraction kit (220011, Fastagen, Shanghai, China) and reverse transcribed by ReverTra Ace qPCR RT Master Mix with gDNA remover (FSQ-301, TOYOBO, Osaka, Japan). Quantitative PCR was performed using SYBR®Green Realtime PCR Master Mix (QPK-201, TOYOBO, Osaka, Japan) on a real-time PCR machine (Applied Biosystems 7500, USA). The 2−ΔΔCt method was used to calculate the relative expression levels of target genes compared to β-actin. The primer sequences used are as follows:
HMOX1-F: CCAGGCAGAGAATGCTGAGTTC
HMOX1-R: AAGACTGGGCTCTCCTTGTTGC
MAPK1: ACACCAACCTCTCGTACATCGG
MAPK1: TGGCAGTAGGTCTGGTGCTCAA
GSTM1-F: TGATGTCCTTGACCTCCACCGT
GSTM1-R: GCTGGACTTCATGTAGGCAGAG
NQO1-F: CCTGCCATTCTGAAAGGCTGGT
NQO1-R: GTGGTGATGGAAAGCACTGCCT
ACTB-F: CACCATTGGCAATGAGCGGTTC
ACTB-R: AGGTCTTTGCGGATGTCCACGT
Western Blot
The total proteins were extracted by Western and IP cell lysis buffer (P0013, Beyotime, China) with 100 μM phenylmethylsulfonyl fluoride (PMSF) (ST506, Beyotime, China). Immunoblotting was performed as previously described.Citation22 To detect proteins with different molecular weights, we cut the membrane horizontally. The protein samples were visualized using the Amersham Imager 600 instrument (General Electric Company, USA) and analyzed by ImageJ software. The original bands are shown in Supplementary Figure S4. Antibodies information is presented in the Supplementary Table S1.
Statistical Analysis
All experiments were performed at least five times. Statistical analysis and graphs were processed by GraphPad Prism 10. Data were presented as the means ± standard deviation (SD). The comparison among groups was tested using a one-way analysis of variance (ANOVA). The Student’s t-test was used to analyze the differences between the control group and the Cel 4μM group.The QQ plots were utilised to assess data distribution (normality and lognormality). When the data follows a Gaussian distribution, classic ANOVA tests are employed for homoscedasticity, whereas Brown-Forsythe and Welch-ANOVA tests are utilized for heteroscedasticity. If the data does not adhere to a Gaussian distribution, non-parametric tests (Kruskal–Wallis) are employed. For classic ANOVA, we used Tukey’s Honest Significant Difference (HSD) test to identify which groups differ from each other. For Brown-Forsythe and Welch-ANOVA, we applied the Games-Howell post-hoc test, which is appropriate when equal variances cannot be assumed. For the Kruskal–Wallis test, we performed Dunn’s test with Bonferroni correction to account for multiple comparisons. These selections were based on recommendations from GraphPad software. Statistical significance was approved at p < 0.05.
Results
Establishment of the Celastrol-HCC Interaction Network by Identifying Shared Targets Between Celastrol and HCC
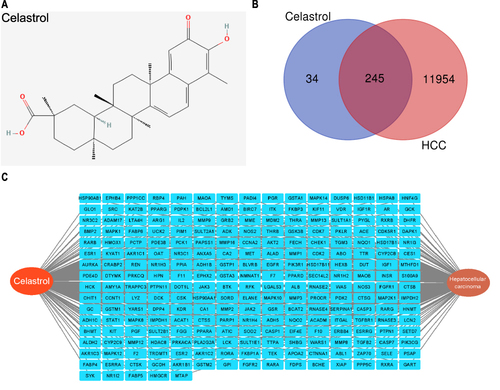
In our study, 280 potential targets of celastrol were identified with the PharmMapper database based on its 2D structure (). 12,199 HCC-related genes were obtained from the GeneCards database. Upon analyzing the targets of celastrol and HCC, 245 common targets were identified (). The network relationship map was constructed by Cytoscape 3.9.1 software (). Among the 280 target genes of celastrol, 245 genes can target HCC, indicating that celastrol has good potential for the treatment of HCC.
Figure 1 Network construction of celastrol targeting HCC. (A) 2D structure of celastrol. (B) Venn diagram illustrating the common targets of celastrol and HCC. (C) The genes targeted by celastrol in HCC.
Establishment of a PPI Network Among Celastrol, HCC, and Ferroptosis Related Genes
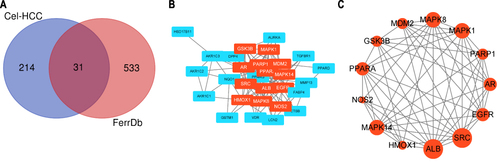
We retrieved 564 genes associated with ferroptosis from the FerrDb database. The shared hub genes among celastrol, HCC, and ferroptosis were identified by taking their intersection (). We obtained 31 candidate genes. Then, we analyzed the expression of these 31 genes in HCC and adjacent normal tissues, as well as their prognostic significance in HCC (Supplementary File1). The PPI network was constructed using the STRING database and was imported into Cytoscape 3.9.1 (). The “MCODE” plug-in of Cytoscape was performed with default parameters to discover the core cluster in the PPI network (). The genes in the cluster including ALB, SRC, MAPK1, MAPK8, MAPK14, PPARA, EGFR, GSK3B, AR, PARP1, MDM2, NOS2, and HMOX1 were considered as hub genes.
Figure 2 PPI network of celastrol-HCC-ferroptosis genes. (A) Venn diagram illustrating the common targets of celastrol (Cel), hepatocellular carcinoma (HCC), and ferroptosis (FerrDb). FerrDb is the world’s first database that is dedicated to ferroptosis regulators and ferroptosis-disease associations. Here, “FerrDb” represents all genes associated with ferroptosis. (B) PPI network generated in Cytoscape 3.9.1 by importing the STRING data for 31 shared targets. (C) Core gene cluster filtered by MCODE plugin in Cytoscape 3.9.1. Blue and red rectangular nodes together represent 31 common targets. The red nodes are the selected core gene cluster. Nodes are marked as corresponding ranks and larger circles indicate more important roles in the network.
GO and KEGG Pathway Enrichment Analysis
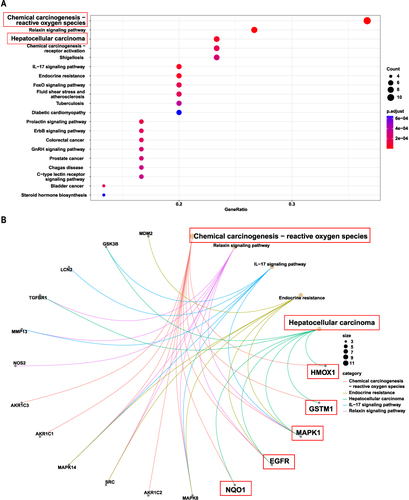
The 31 shared targets underwent GO and KEGG enrichment analysis. The GO enrichment analysis revealed that one of the relevant BPs (biological process, ) was cellular responses to metal ion and cellular response to oxidative stress, indicating that celastrol can mediate ferroptosis. Ferroptosis is a form of cell death driven by iron-dependent lipid peroxidation. Divalent iron ions and ROS-induced oxidative stress promote ferroptosis. Those relevant to MFs (molecular function, ) were related to monocarboxylic acid binding, carboxylic acid binding, and bile acid binding, suggesting that celastrol targeting genes may be involved in the tricarboxylic acid cycle and lipid metabolism process. Tricarboxylic acid cycle-mediated energy metabolism and lipid metabolism are closely related to ferroptosis. The KEGG enrichment analysis revealed the top 20 enriched signaling pathways () and the top 5 KEGG pathway-gene network (). Chemical carcinogenesis-reactive oxygen species is the most significant pathway in the results. ROS is positively correlated with cellular oxidative stress and ferroptosis. GO analysis also showed that the biological process was related to oxidative stress. We consider that ROS is necessary for celastrol-mediated ferroptosis in HCC. Therefore, we selected the genes (HMOX1, GSTM1, MAPK1, EGFR, NQO1) enriched in both chemical carcinogenesis-reactive oxygen species and hepatocellular carcinoma pathway as key genes for further study.
Figure 3 The GO enrichment analysis performed on the genes related to celastrol-induced ferroptosis in HCC. The top 10 significantly enriched terms were identified in both biological processes (A) and molecular functions (B).
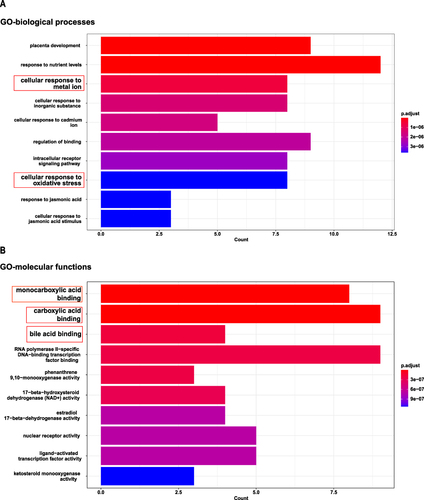
Figure 4 The KEGG analysis performed on the genes associated with celastrol-induced ferroptosis in HCC. (A) The top 20 significantly enriched terms obtained for KEGG. (B) a network of the top 5 KEGG pathways and their corresponding genes.
Survival Analysis
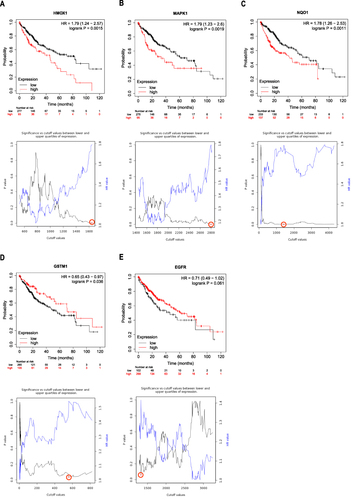
To illustrate the potential role of the above key genes in HCC, the survival analysis of these genes about HCC prognosis was conducted using the Kaplan-Meier Plotter database with default parameters, which include the “Auto select best cutoff” option. This method selects an optimal cutoff for survival analysis by comparing significance and cutoff values between lower and upper quartiles of expression. The high expression of HMOX1, MAPK1, and NQO1 is associated with poor prognosis in HCC, while high expression of GSTM1 is correlated with a favorable prognosis. This suggests that GSTM1 may serve as a protective factor in HCC, whereas HMOX1, MAPK1, and NQO1 may act as risk factors. HMOX1 (), MAPK1 (), NOQ1 (), and GSTM1 () with p-values <0.05 except EGFR () may be involved in HCC survival and their mRNA expressions were validated after HepG2 cells treated with celastrol in vitro.
Figure 5 The survival curve based on the expression of key genes HMOX1 (A), GSTM1 (B), MAPK1 (C), EGFR (D), and NQO1 (E) by applying the Kaplan–Meier plotter database in HCC. A significantly worse survival rate: P < 0.05. The red lines represent patients with high gene expression and the black lines with a low gene expression.
Celastrol Inhibited HCC Cell Proliferation and This Process Can Be Reversed by Ferroptosis Inhibitors
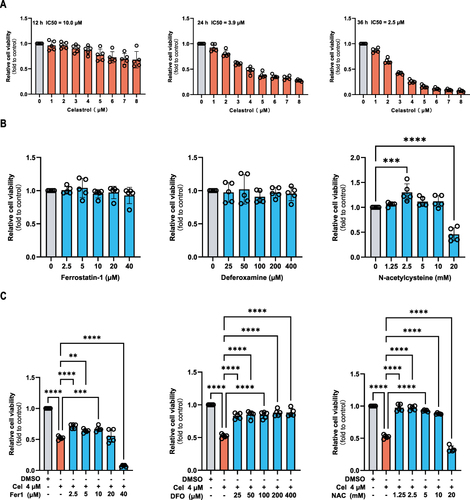
Through the analysis of network pharmacology, we speculated that celastrol may promote ferroptosis in HCC. In our study, HepG2 cells were treated with celastrol at various concentrations (ranging from 1 µM to 8 µM) for different time durations (12, 24, and 36 h). The results showed that celastrol exhibited a dose-dependent and time-dependent inhibition on HepG2 cell proliferation (). Considering that the same concentration of celastrol had an insufficient inhibitory effect on cell viability at 12 h, but caused too much cell death at 36 h, we chose 24 h for subsequent experiments. After 24 h, treatment with celastrol at a concentration of 2 µM led to a notable reduction in cell viability. Additionally, the median lethal dose of celastrol after a 24-hour period was approximately 4 µM. Therefore, celastrol at the dose of 2 or (and) 4 µM was used in the following experiments. Bioinformatics analysis showed that celastrol may inhibit HCC through ferroptosis. To further verify that celastrol-induced HCC cell death is related to ferroptosis, we introduced ferroptosis inhibitors in the following experimental systems to observe whether the effect of celastrol can be impaired. Based on previous reports, the most commonly used concentrations of the typical ferroptosis inhibitors were 10 µM fer-1, 100 µM DFO, and 5 mM NAC. Therefore, based on this, we respectively adjusted several concentration gradients as experimental concentrations. Lower concentrations of Fer-1, DFO, and NAC did not exhibit a notable impact on cell viability (). They were able to partially restore the decrease in cell viability induced by celastrol (). Finally, for the concentration of ferroptosis inhibitors, we chose the commonly used concentration in the literature for the experiment. Celastrol-mediated growth inhibition of HepG2 cells was blocked by Fer-1, DFO, and NAC, indicating celastrol may inhibit cell proliferation partly through ferroptosis.
Figure 6 Celastrol inhibited proliferation and ferroptosis inhibitors interfered with celastrol-induced death in HCC cells. (A) Cell viability of HepG2 cells treated with varying concentrations of celastrol (ranging from 0 to 8 μM) for different periods (12, 24, and 36 h). (B) Cell viability of HepG2 cells treated with different concentrations of Fer-1, DFO, and NAC alone. (C) Cell viability of HepG2 cells cotreated with different concentrations of Fer-1, DFO and NAC with celastrol (4 μM). The CCK8 assay was used to measure cell viability. One-way ANOVA analysis was used to compare the differences among groups. All data are representative of five independent experiments, and the values are expressed as the mean ± SD. **p < 0.01, ***p < 0.001, ****p<0.0001.
Celastrol Induced Ferroptosis in HCC Cells
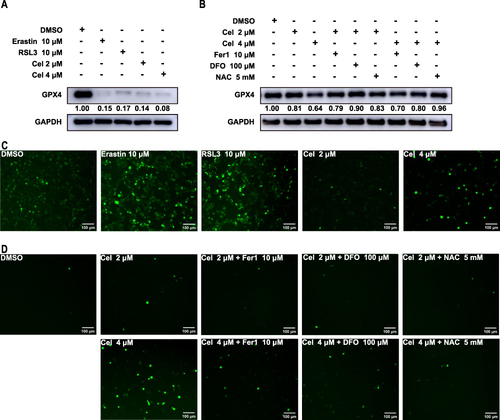
HepG2 cells were subjected to 24-hour treatment with ferroptosis activators or celastrol at concentrations of 2 µM and 4 µM, either with or without ferroptosis inhibitors. As ferroptosis activators, erastin, and RSL3 induced ferroptosis events. The events were also found in celastrol-treated HepG2 cells, which were evidenced by increased lipid peroxidation products ( and ), decreased GSH-Px activity ( and ), increased iron level ( and ), and protein expression of GPX4 is markedly decreased ( and ). GPX4 is a key protein that inhibits ferroptosis, and its expression is significantly reduced when ferroptosis occurs. The above phenomena can be partly reversed by ferroptosis inhibitors (Fer-1, DFO, and NAC). In summary, these results indicate the inhibition of cell proliferation in HepG2 cells by celastrol may involve the activation of ferroptosis.
Figure 7 Celastrol treatment resulted in ferroptosis events in HCC cells. HepG2 cells were treated with ferroptosis activators erastin (10 μM) and RSL3 (10 μM), celastrol (2 or 4 μM) for 24 h respectively, or co-treated with celastrol (2 or 4 μM) along with Fer-1 (10 μM), DFO (100 μM), or NAC (5 mM) for 24 h. The following parameters were evaluated in cell lysates by absorbance detection: (A and B) MDA content, (C and D) GSH-Pxs activity, and (E and F) iron content. One-way ANOVA analysis was used to compare the differences among groups. All data are representative of five independent experiments, and the values are expressed as the mean ± SD. *p < 0.05, **p < 0.01, ***p < 0.001, ****p<0.0001.
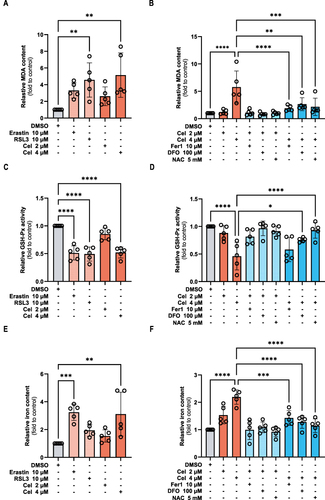
Figure 8 Celastrol treatment induced reactive oxygen species production in HCC cells. HepG2 cells were treated with ferroptosis activator erastin (10 μM) and RSL3 (10 μM), celastrol (2 or 4 μM) for 24 h respectively, or co-treated with celastrol (2 or 4 μM) along with Fer-1 (10 μM), DFO (100 μM), or NAC (5 mM) for 24 h. (A and B) The protein expression of GPX4 was determined by Western blot. (C and D) Intracellular ROS level was measured by immunofluorescence. One-way ANOVA analysis was used to compare the differences among groups. All data are representative of five independent experiments, and the values are expressed as the mean ± SD. Scale bars, 100 μm.
Celastrol Induced ROS Production in HCC Cells
One of the hallmarks of ferroptosis is ROS accumulation,Citation23 and the chemical carcinogenesis-reactive oxygen species signaling pathway was the first enriched pathway in KEGG enrichment analysis according to the results presented above. To examine the impact of celastrol on ROS production, HepG2 cells were treated with celastrol with or without ferroptosis inhibitors and the levels of cytosolic ROS were examined by fluorescence microscope using the fluorescent probes DCFH-DA. We found that celastrol treatment increased cytosolic ROS levels, which was similar to the ferroptosis activator treatment ( and ). Ferroptosis inhibitors could abolish celastrol-induced ROS elevation (). In short, celastrol might positively regulate ferroptosis by increasing ROS production.
Celastrol Inhibited HCC Cell Growth Through Ferroptosis
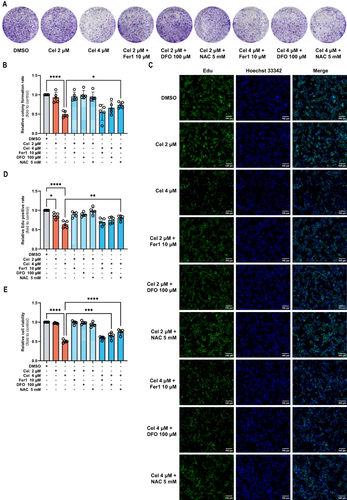
To further elucidate the role of ferroptosis in celastrol-mediated inhibition of HCC cell proliferation, additional investigations are warranted. According to the colony formation assay ( and ), ferroptosis inhibitors partly reversed proliferation inhibition induced by celastrol in HCC cells. EdU cell proliferation assay ( and ) and CCK8 assay () revealed that celastrol suppressed HCC cell growth and viability, which could be rescued by ferroptosis inhibitors. It was revealed that celastrol partly inhibited HCC cell growth by inducing ferroptosis.
Figure 9 Celastrol inhibited HCC cell proliferation by inducing ferroptosis. HepG2 cells were co-treated with celastrol (2 or 4 μM) along with Fer-1 (10 μM), DFO (100 μM), or NAC (5 mM) for 24 h. (A and C) Colony formation and (B and D) EDU assay were used to determine the cell proliferation capacity. (E) Cell viability was evaluated by CCK-8 assay. One-way ANOVA analysis was used to compare the differences among groups. All data are representative of five independent experiments, and the values are expressed as the mean ± SD. Scale bars, 100 μm. *p < 0.05, **p < 0.01, ***p < 0.001, ****p<0.0001.
Celastrol Mediated Core Key Target Expression in HCC Cells
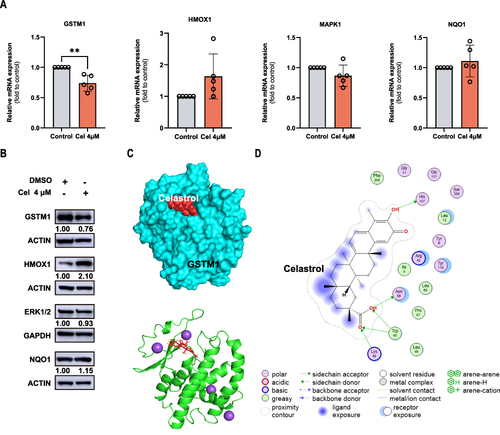
Next, we verified the expression of HMOX1, GSTM1, MAPK1, and NQO1, which was evaluated using RT-qPCR and Western blot. The mRNA level of GSTM1 was decreased in celastrol-treated HepG2 cells but the level of other genes had no change significantly (). Celastrol also can reduce the protein expression of GSTM1 and increase the expression of HMOX1 protein. (). Studies have shown that celastrol could target HMOX1 and upregulate its expression thereby inducing ferroptosis in activated HSCs.Citation9 Therefore, we chose GSTM1 for further study. Molecular docking was conducted to evaluate the interaction between GSTM1 and celastrol. A binding affinity equal to or less than −5 kcal/mol was considered indicative of a strong interaction. The combinations with relatively low free energy and most binding bonds were selected to visualize the binding of celastrol to GSTM1 ( and Supplementary Table S2). GSTM1 interacts with celastrol mainly through sidechain hydrogen bonds (). Celastrol may bind to GSTM1 through hydrogen bonds to affect the protein conformation and stability, but the specific situation needs further study.
Figure 10 Celastrol mediated core target expression in HCC cells. HepG2 cells following celastrol (4 μM) for 24 h. (A) The mRNA expression of GSTM1, HMOX1, MAPK1, NQO1. (B) The protein expression of GSTM1, HMOX1, MAPK1, NQO1. (C) The interaction between celastrol and GSTM1. (D) Celastrol binds to GSTM1 through hydrogen bonds. The Student’s t-test was used to analyze the differences between the control group and the Cel 4μM group. All data are representative of five independent experiments, and the values are expressed as the mean ± SD. **p < 0.01.
Celastrol Promoted Ferroptosis and Inhibited Proliferation Through GSTM1 in HCC
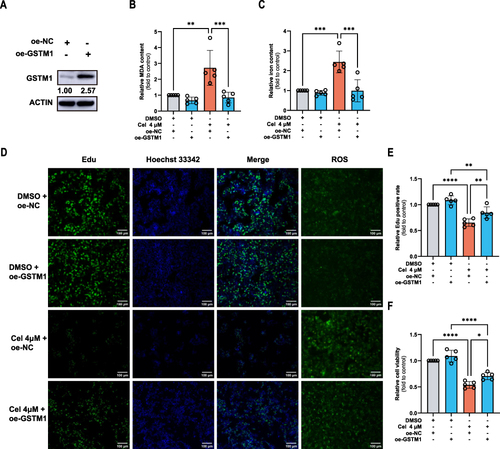
To explore the functions of GSTM1 in HCC, we overexpressed the expression of GSTM1 in HepG2 cells (). Ferroptosis was indicated by MDA (), iron content (), and intracellular ROS level (). Cell proliferation was detected by EDU ( and ) and CCK8 assays (). GSTM1 overexpression attenuated celastrol-induced ferroptosis and cell proliferation inhibition. Our results suggested that celastrol may promote ferroptosis and inhibit proliferation through GSTM1.
Figure 11 Celastrol mediated ferroptosis and inhibited proliferation through GSTM1 in HCC cells. HepG2 cells overexpressing GSTM1 were treated with celastrol (4 μM) for 24 h. (A) The Overexpression of GSTM1 in HCC cells. Ferroptosis was indicated by (B) MDA and (C) iron content in cell lysates, and Intracellular ROS level. Cell proliferation was displayed by (D) Cell viability and (E and F) EDU assay. One-way ANOVA analysis was used to compare the differences among groups. All data are representative of five independent experiments, and the values are expressed as the mean ± SD. Scale bars, 100 μm. *p < 0.05, **p < 0.01, ***p < 0.001, ****p<0.0001.
Discussion
Liver cancer is currently the sixth most prevalent cancer globally. According to the World Health Organization, it is estimated that over 1 million individuals will succumb to liver cancer by 2030.Citation24 HCC predominates among primary liver cancer cases. Celastrol was chosen as the focus of our research, aiming to explore its mechanism of inhibiting HCC cell activity and its potential therapeutic effects on HCC. This was achieved by combining network pharmacology analysis with cell experiments.
We first screened the potential target molecules of celastrol from the PharmMapper database. Subsequently, we gathered genes associated with HCC from the Genecards database and genes related to ferroptosis from the FerrDb database. By conducting an intersection of these gene sets, we identified 31 common genes for further analysis. These genes underwent PPI analysis, as well as GO and KEGG enrichment analysis. The GO analysis results revealed enrichment in biological processes related to cellular response to metal ions and oxidative stress. Then, KEGG analysis showed that it was significantly enriched to chemical carcinogenesis reactive oxygen species. Ferroptosis is iron-dependent programmed cell death and is closely related to oxidative stress.Citation25 Ferroptosis is a potential adaptive process that plays a crucial role in eliminating cancerous cells. It is considered to be one of the mechanisms through which sorafenib may exert its therapeutic effects in treating HCC.Citation26 We speculate that celastrol may trigger ferroptosis through ROS-related oxidative stress pathways, thereby exerting an anti-HCC effect. For further research, we validated the mRNA expression of genes that are simultaneously enriched in chemical carcinogenesis reactive oxygen species and hepatocellular carcinoma and detected ferroptosis events in HepG2 cells after treatment with celastrol.
Sorafenib is widely recognized as the primary treatment option for HCC and is known as an inducer of ferroptosis. Promoting sorafenib-induced ferroptosis is a new way to treat HCC. However, sorafenib is a late-stage drug for liver cancer and is prone to drug resistance. If other drugs can exert the same anticancer effect, it is also a new choice for the treatment of HCC. Studies have demonstrated that celastrol can effectively promote the production of ROS and induce ferroptosis in activated hepatic stellate cells (HSCs), leading to its potential anti-fibrotic effects.Citation9 Besides, Celastrol liposomes may induce ferroptosis and apoptosis by directly targeting VDAC2 in HCC.Citation27 Ferroptosis inducer Erastin made non-small cell lung cancer more sensitive to celastrol.Citation28 Celastrol can induce ferroptosis in vivo and in vitro to treat clear cell renal cell carcinoma.Citation10 Some studies have also shown that celastrol can inhibit ferroptosis. 600 nM celastrol exerted ferroptosis resistance through AKT / GSK3β signaling, thereby alleviating cardiac injury induced by a high-fat diet.Citation29 0.5 μM celastrol can effectively inhibit ferroptosis after spinal cord injury.Citation30 10 nM celastrol could alleviate acute kidney injury by inhibiting ferroptosis through the Nrf2 / GPX4 pathway.Citation31 The above shows that low-dose celastrol can alleviate ferroptosis in non-tumor diseases. However, for tumor diseases, celastrol is used in large doses, which triggers cytotoxicity to kill tumors. In insulin-resistant HepG2 cells, the induction of ferroptosis represents a potential mechanism through which celastrol exerts cytotoxic effects, and this process can be mitigated by the administration of ferroptosis inhibitors.Citation32
In our study, we investigated the effects of celastrol on HepG2 cells by treating them with varying doses of celastrol over different periods. We observed that celastrol exhibited a dose-dependent and time-dependent inhibition of HCC cell activity. Notably, this effect could be partially reversed by ferroptosis inhibitors. After celastrol treatment of cells, we detected ferroptosis-related indicators. The level of MDA and iron content were significantly increased. The activity of GSH-Pxs was inhibited. The protein level of GPX4 was down-regulated. Celastrol nanomedicines can down-regulate GPX4 expression, consume glutathione (GSH) levels, and increase lipid peroxidation levels, thereby triggering ROS-mediated ferroptosis pathways and exerting anti-HCC effects in vitro and in vivo. Our findings are largely in line with research conducted by others.Citation33 The ferroptosis-related events induced by celastrol could be reversed by ferroptosis inhibitors, indicating the occurrence of ferroptosis. Proliferation inhibition induced by celastrol could be also reversed by ferroptosis inhibitors, indicating celastrol may promote HCC cell death through ferroptosis.
Ferroptosis is a regulated cell death process that relies on the presence of iron and ROS. The ferroptosis inhibitor erastin increased ROS production, thereby inducing LC3B transformation and activating autophagy.Citation23 Autophagy induced by ROS leads to elevated levels of intracellular iron, which, in turn, promotes ferroptosis through the regulation of ferritin and transferrin receptors. ROS can initiate ferroptosis.Citation34 We detected the level of ROS in celastrol-treated cells and found that ROS levels were significantly increased and ferroptosis inhibitors (including NAC, the ROS scavenger) could inhibit the increase of ROS levels induced by celastrol, indicating that celastrol may mediate ferroptosis through ROS-related pathways.
To explore the related targets that celastrol may play a role through the ROS pathway, we selected genes that are simultaneously enriched in the chemical carcinogenesis reactive oxygen species and hepatocellular carcinoma signaling pathways. We first evaluated the role of these genes in the overall survival of HCC patients and found that individuals with low expression of HMOX1, MAPK1, NQO1 and high expression of GSTM1 had a better prognosis, and the expression of EGFR had no significant change in the prognosis of patients. In our investigation of the impact of celastrol on the mRNA and protein levels of genes influencing HCC prognosis, there were no significant changes in the mRNA level of HMOX1, MAPK1, and NQO1. We observed that treatment with celastrol specifically decreased the mRNA and protein level of GSTM1, and increased the expression of HMOX1 protein. Studies have shown that celastrol could upregulate HMOX1 expression.Citation35–38 We checked the FerrDb database and found that HMOX1 is both a ferroptosis driver and ferroptosis inhibitor, while GSTM1 is a ferroptosis inhibitor. In addition, studies have shown that celastrol can directly interact with HMOX1 and induce ferroptosis.Citation9 The relationship between celastrol and GSTM1 has not been reported. Therefore, we chose GSTM1 for further study. Molecular docking showed that celastrol was combined with GSTM1. We speculate that celastrol may mediate ferroptosis and cell proliferation by inhibiting GSTM1. We overexpressed GSTM1 in HepG2 cells. The cells overexpressing GSTM1 were treated with celastrol. The results showed that overexpression of GSTM1 could reverse celastrol-induced ferroptosis and cell proliferation inhibition.GSTM1 is a member of the GST superfamily, which is a Phase II antioxidant enzyme regulated by Nrf2. Additionally, a decrease in GSTM1 activity is associated with elevated oxidative stress levels.Citation39 GSTM1 can participate in the scavenging of ROS.Citation40 Although database analysis showed that high expression of GSTM1 can promote patient survival, celastrol may promote ROS production and ferroptosis by suppressing the GSTM1 protein level or enzyme activity, which can also inhibit HCC. GPX4 can interact with GSTM1 and enhance its protein stability.Citation41 Celastrol can down-regulate GPX4 protein, which may be one of the reasons why celastrol can reduce the expression of GSTM1 protein. However, how celastrol down-regulates GSTM1 mRNA remains to be explored.
Our study has several limitations that should be recognized. Firstly, we focused exclusively on the form of ferroptosis in celastrol-induced cell death, overlooking the importance of other forms of death. Secondly, we only verified that celastrol induced ferroptosis by restoring GSTM1 expression. Furthermore, due to technical limitations, we have not yet explored the specific mechanism of celastrol-reducing GSTM1 and the potential relationship between GSTM1 and HMOX1, MAPK1, and NQO1. These limitations should be taken into consideration when interpreting the findings of our research, and efforts are underway to address these issues in future investigations.
In follow-up research, we would introduce inhibitors of other cell death pathways at the same time to investigate their relative contribution alongside ferroptosis induced by celastrol. Meanwhile, it may be more convincing to knock out GSTM1 in HCC cells to further explore whether celastrol can still induce ferroptosis. We are in contact with teams with relevant technical conditions and experience to conduct in-depth research through cooperation with others.
Conclusion
Our study employed a combination of network pharmacology and cell experiments to demonstrate the promising therapeutic potential of celastrol in the treatment of HCC. Celastrol may inhibit ROS clearance and increase ROS levels by inhibiting GSTM1 enzyme activity. High levels of ROS activate oxidative stress or iron autophagy-related pathways, which in turn mediate the occurrence of ferroptosis. Celastrol may inhibit the cell activity of HCC by inducing ferroptosis.
Abbreviations
HSCs, hepatic stellate cell; HCC, hepatocellular carcinoma; GO, gene ontology; KEGG, Kyoto Encyclopedia of Genes and Genomes; GSTM1, Glutathione S-transferase Mu 1; ROS, reactive oxygen species; MDA, malondialdehyde; GSH-Px, glutathione peroxidase, GPX4, glutathione peroxidase 4; COMMD10, Copper metabolism MURR1 domain 10; HIF1α, Hypoxia-inducible factor 1-alpha; CP, ceruloplasmin; LCN2, Neutrophil gelatinase-associated lipocalin; GLS2, Glutamine synthase 2; ccRCC, clear cell renal cell carcinoma; SDF, Structure Data File; BP, biological process; CC, cellular composition; MF, molecular function; OS, overall survival; KM, Kaplan-Meier; ROC, receiver operating characteristic; PDB, Program DataBase, MOE, Molecular Operating Environment; MEM, minimum essential Medium; FBS, fetal bovine serum; Fer-1, Ferrostatin-1; DFO, Deferoxamine mesylate; NAC, N-acetylcysteine; NADPH, nicotinamide adenine dinucleotide phosphate; GR, Glutathione Reductase; Edu, 5-ethynyl-2’-deoxyuridine; PMSF, phenylmethylsulfonyl fluoride; GSTs, Glutathione S-transferases; Nrf2, nuclear factor erythroid 2-related factor 2.
Ethical Approval
All databases in this study are public databases, the contents of which are publicly available and allow unrestricted reuse through open licenses. According to an official document issued by the National Science and Technology Ethics Committee of China, the use of legally obtained public data is not subject to ethical scrutiny (https://www.gov.cn/zhengce/zhengceku/2023-02/28/content_5743658.htm). Therefore, the part of this study involving human data from public databases would need ethics approval waived (Ethics Committee of Shanghai Pudong Gongli Hospital). The proof of ethical exemption has been provided in Supplementary File 2.
Author Contributions
All authors made a significant contribution to the work reported, whether that is in the conception, study design, execution, acquisition of data, analysis and interpretation, or in all these areas; took part in drafting, revising or critically reviewing the article; gave final approval of the version to be published; have agreed on the journal to which the article has been submitted; and agree to be accountable for all aspects of the work.
Disclosure
The authors declare that there are no conflicts of interest in this work.
Acknowledgments
This work is grateful for the above funding. Thanks to Dr.Bin Peng and Dr. Yijun Tian for critically reading the manuscript. We sincerely appreciate the time and effort of all who contributed to this study.
Data Sharing Statement
All data that support the findings of this study are included in this manuscript and its Supplementary Files. Further inquiries can be directed to the corresponding author.
Additional information
Funding
References
- Forner A, Reig M, Bruix J. Hepatocellular carcinoma. Lancet. 2018;391(10127):1301–1314. doi:10.1016/S0140-6736(18)30010-2
- Llovet JM, Zucman-Rossi J, Pikarsky E, et al. Hepatocellular carcinoma. Nat Rev Dis Primers. 2016;2:16018. doi:10.1038/nrdp.2016.18
- Chen J, Li X, Ge C, Min J, Wang F. The multifaceted role of ferroptosis in liver disease. Cell Death Differ. 2022;29(3):467–480. doi:10.1038/s41418-022-00941-0
- Yang M, Wu X, Hu J, et al. COMMD10 inhibits HIF1α/CP loop to enhance ferroptosis and radiosensitivity by disrupting Cu-Fe balance in hepatocellular carcinoma. J Hepatol. 2022;76(5):1138–1150. doi:10.1016/j.jhep.2022.01.009
- Yao F, Deng Y, Zhao Y, et al. A targetable LIFR-NF-κB-LCN2 axis controls liver tumorigenesis and vulnerability to ferroptosis. Nat Commun. 2021;12(1):7333. doi:10.1038/s41467-021-27452-9
- Suzuki S, Venkatesh D, Kanda H, et al. GLS2 Is a Tumor Suppressor and a Regulator of Ferroptosis in Hepatocellular Carcinoma. Cancer Res. 2022;82(18):3209–3222. doi:10.1158/0008-5472.CAN-21-3914
- Dixon SJ, Lemberg KM, Lamprecht MR, et al. Ferroptosis: an iron-dependent form of nonapoptotic cell death. Cell. 2012;149(5):1060–1072. doi:10.1016/j.cell.2012.03.042
- Jiang X, Stockwell BR, Conrad M. Ferroptosis: mechanisms, biology and role in disease. Nat Rev Mol Cell Biol. 2021;22(4):266–282. doi:10.1038/s41580-020-00324-8
- Luo P, Liu D, Zhang Q, et al. Celastrol induces ferroptosis in activated HSCs to ameliorate hepatic fibrosis via targeting peroxiredoxins and HO-1. Acta pharmaceutica Sinica B. 2022;12(5):2300–2314. doi:10.1016/j.apsb.2021.12.007
- Li H, Deng C, Zhu N, Zhang C, Zeng Q, Qin L. An ultrasensitive GSH-specific fluorescent probe unveils celastrol-induced ccRCC ferroptosis. Bioorg Chem. 2023;134:106454. doi:10.1016/j.bioorg.2023.106454
- Stelzer G, Rosen N, Plaschkes I, et al. The genecards suite: from gene data mining to disease genome sequence analyses. Curr Protoc Bioinf. 2016;54:1.30.31–31.30.33. doi:10.1002/cpbi.5
- Kim S, Chen J, Cheng T, et al. PubChem 2023 update. Nucleic Acids Res. 2023;51(D1):D1373–d1380.
- Wang X, Shen Y, Wang S, et al. PharmMapper 2017 update: a web server for potential drug target identification with a comprehensive target pharmacophore database. Nucleic Acids Res. 2017;45(W1):W356–w360. doi:10.1093/nar/gkx374
- UniProt Consortium. UniProt: the universal protein knowledgebase in 2023. Nucleic Acids Res. 2023;51(D1):D523–d531. doi:10.1093/nar/gkac1052
- Zhou N, Yuan X, Du Q, et al. FerrDb V2: update of the manually curated database of ferroptosis regulators and ferroptosis-disease associations. Nucleic Acids Res. 2023;51(D1):D571–d582.
- Szklarczyk D, Kirsch R, Koutrouli M, et al. The STRING database in 2023: protein-protein association networks and functional enrichment analyses for any sequenced genome of interest. Nucleic Acids Res. 2023;51(D1):D638–d646. doi:10.1093/nar/gkac1000
- Li X, Tang Q, Meng F, Du P, Chen W. INPUT: an intelligent network pharmacology platform unique for traditional Chinese medicine. Comput Struct Biotechnol J. 2022;20:1345–1351. doi:10.1016/j.csbj.2022.03.006
- Győrffy B. Discovery and ranking of the most robust prognostic biomarkers in serous ovarian cancer. Geroscience. 2023;45(3):1889–1898. doi:10.1007/s11357-023-00742-4
- Berman HM, Westbrook J, Feng Z, et al. The protein data bank. Nucleic Acids Res. 2000;28(1):235–242. doi:10.1093/nar/28.1.235
- Mu X, Wang J, He H, et al. An oligomeric semiconducting nanozyme with ultrafast electron transfers alleviates acute brain injury. Sci Adv. 2021;7(46):eabk1210. doi:10.1126/sciadv.abk1210
- Zhang S, Li Y, Sun S, et al. Single-atom nanozymes catalytically surpassing naturally occurring enzymes as sustained stitching for brain trauma. Nat Commun. 2022;13(1):4744. doi:10.1038/s41467-022-32411-z
- Gao R, Kalathur RKR, Coto-Llerena M, et al. YAP/TAZ and ATF4 drive resistance to Sorafenib in hepatocellular carcinoma by preventing ferroptosis. EMBO Mol Med. 2021;13(12):e14351. doi:10.15252/emmm.202114351
- Park E, Chung SW. ROS-mediated autophagy increases intracellular iron levels and ferroptosis by ferritin and transferrin receptor regulation. Cell Death Dis. 2019;10(11):822. doi:10.1038/s41419-019-2064-5
- Villanueva A. Hepatocellular Carcinoma. N Engl J Med. 2019;380(15):1450–1462. doi:10.1056/NEJMra1713263
- Yu Y, Yan Y, Niu F, et al. Ferroptosis: a cell death connecting oxidative stress, inflammation and cardiovascular diseases. Cell Death Discov. 2021;7(1):193. doi:10.1038/s41420-021-00579-w
- Mou Y, Wang J, Wu J, et al. Ferroptosis, a new form of cell death: opportunities and challenges in cancer. J Hematol Oncol. 2019;12(1):34. doi:10.1186/s13045-019-0720-y
- Luo P, Zhang Q, Shen S, et al. Mechanistic engineering of celastrol liposomes induces ferroptosis and apoptosis by directly targeting VDAC2 in hepatocellular carcinoma. Asian J Pharm Sci. 2023;18(6):100874. doi:10.1016/j.ajps.2023.100874
- Liu M, Fan Y, Li D, et al. Ferroptosis inducer erastin sensitizes NSCLC cells to celastrol through activation of the ROS-mitochondrial fission-mitophagy axis. Mol Oncol. 2021;15(8):2084–2105. doi:10.1002/1878-0261.12936
- Bian J, Ding Y, Wang S, et al. Celastrol confers ferroptosis resistance via AKT/GSK3β signaling in high-fat diet-induced cardiac injury. Free Radic Biol Med. 2023;200:36–46. doi:10.1016/j.freeradbiomed.2023.03.004
- Shen W, Li C, Liu Q, et al. Celastrol inhibits oligodendrocyte and neuron ferroptosis to promote spinal cord injury recovery. Phytomedicine. 2024;128:155380. doi:10.1016/j.phymed.2024.155380
- Pan M, Wang Z, Wang Y, et al. Celastrol alleviated acute kidney injury by inhibition of ferroptosis through Nrf2/GPX4 pathway. Biomed Pharmacothe. 2023;166:115333. doi:10.1016/j.biopha.2023.115333
- Liu JJ, Zhang X, Cai BL, et al. Ferroptosis inhibitors reduce celastrol toxicity and preserve its insulin sensitizing effects in insulin resistant HepG2 cells. J Integr Med. 2024;22:286–294. doi:10.1016/j.joim.2024.03.007
- Zhang X, Chen Y, Li X, et al. Carrier-free self-assembled nanomedicine based on celastrol and galactose for targeting therapy of hepatocellular carcinoma via inducing ferroptosis. Eur J Med Chem. 2024;267:116183. doi:10.1016/j.ejmech.2024.116183
- Liu J, Kang R, Tang D. Signaling pathways and defense mechanisms of ferroptosis. Febs j. 2022;289(22):7038–7050. doi:10.1111/febs.16059
- Zhan X, Yan C, Chen Y, et al. Celastrol antagonizes high glucose-evoked podocyte injury, inflammation and insulin resistance by restoring the HO-1-mediated autophagy pathway. Mol Immunol. 2018;104:61–68. doi:10.1016/j.molimm.2018.10.021
- Yu X, Tao W, Jiang F, Li C, Lin J, Liu C. Celastrol attenuates hypertension-induced inflammation and oxidative stress in vascular smooth muscle cells via induction of heme oxygenase-1. Am J Hypertens. 2010;23(8):895–903. doi:10.1038/ajh.2010.75
- Yang X, Chen A, Liang Q, et al. Up-regulation of heme oxygenase-1 by celastrol alleviates oxidative stress and vascular calcification in chronic kidney disease. Free Radic Biol Med. 2021;172:530–540. doi:10.1016/j.freeradbiomed.2021.06.020
- Der Sarkissian S, Cailhier JF, Borie M, et al. Celastrol protects ischaemic myocardium through a heat shock response with up-regulation of haeme oxygenase-1. Br J Pharmacol. 2014;171(23):5265–5279. doi:10.1111/bph.12838
- Le TH. GSTM1 gene, diet, and kidney disease: implication for precision medicine?: Recent Advances in Hypertension. Hypertension. 2021;78(4):936–945. doi:10.1161/HYPERTENSIONAHA.121.16510
- Karimian M, Behjati M, Barati E, Ehteram T, Karimian A. CYP1A1 and GSTs common gene variations and presbycusis risk: a genetic association analysis and a bioinformatics approach. Environ Sci Pollut Res Int. 2020;27(34):42600–42610. doi:10.1007/s11356-020-10144-0
- Liu W, Zhou Y, Duan W, et al. Glutathione peroxidase 4-dependent glutathione high-consumption drives acquired platinum chemoresistance in lung cancer-derived brain metastasis. Clin Translat Med. 2021;11(9):e517. doi:10.1002/ctm2.517