Abstract
Antiproliferative drugs such as sirolimus (SIR) and paclitaxel (PAT) are currently released from stents and vascular grafts to inhibit the growth of smooth muscle cells (SMCs), thereby preventing neointimal hyperplasia. However, these drugs delay or impair the growth of endothelial cells (ECs) on implant surfaces causing late thrombosis. Hence, there is a need to use alternative drugs in these implants to encourage the growth of ECs and to inhibit the growth of SMCs. Vitamin C (L-ascorbic acid [L-AA]) is one such drug which has been shown to encourage EC growth and inhibit SMC growth when orally administered or added directly to the cell cultures. In this research, four sets of in vitro cell culture experiments were carried out to compare the effects of L-AA, SIR, and PAT on the growth of ECs and SMCs under similar conditions, and to compare the effects of different doses of L-AA to determine the optimal dose for promoting maximum EC growth and inhibiting SMC growth. The ECs and SMCs treated with different drugs were characterized for their viability and proliferation, and morphology using the quantitative resazurin assay (as well as qualitative fluorescence microscopy characterization) and phase contrast microscopy, respectively, for up to 7 days. Also, the phenotype of ECs was characterized using immunofluorescence microscopy. Both SIR and PAT significantly inhibited the EC growth while L-AA significantly encouraged EC growth even more than that of the controls with no drugs. Also, L-AA significantly inhibited SMC growth although the inhibitory effect was inferior to that of SIR and PAT. The L-AA dosage study demonstrated that 100 μg and 300 μg of L-AA showed maximum EC growth after 7 days when compared to other dosages (1 μg, 500 μg, and 1000 μg) of L-AA and controls investigated in this study. Also, the 100 μg and 300 μg L-AA doses significantly inhibited the SMC growth. Thus, this study demonstrates that L-AA is a promising drug for potential use in stents and vascular grafts, to promote their endothelialization and inhibit neointimal hyperplasia.
Introduction
Cardiovascular medical devices such as stents and vascular grafts are implanted in millions of patients every year.Citation1,Citation2 However, one of the main concerns with these devices, or any other cardiovascular medical device, is the thrombogenicity, which is the tendency of an artificial material in contact with blood to form thrombus (blood clots).Citation3 This may have fatal consequences if the thrombus formed obstructs the blood flow to the heart or other vital organs. Hence, endothelialization of cardiovascular medical devices is crucial for preventing thrombosis.Citation3 A normal and healthy endothelial cell (EC) layer prevents thrombosis by releasing prostacyclin and nitric oxide, which inhibits platelet adhesion, aggregation, and activation, the key events of thrombosis.Citation4 Also, the EC surface contains thrombomodulin, a protein which plays a vital role in providing anticoagulant properties to these cells.Citation4 Although a variety of materials have been developed in the past to improve the blood compatibility of medical devices, endothelialization is still considered to be the best approach to avoid thrombosis over the long term.Citation3,Citation5 Hence, different strategies are currently being developed to promote endothelialization of cardiovascular medical devices.Citation6
Currently available drug-eluting cardiovascular stents release antiproliferative drugs such as sirolimus (SIR) and paclitaxel (PAT) to treat neointimal hyperplasia (NH).Citation7 NH is a wound healing response to an arterial injury that occurs during the implantation of stents.Citation8 The primary event of NH is the growth and migration of smooth muscle cells (SMCs) followed by extracellular matrix deposition inside the lumen to occlude the artery.Citation9 Although the antiproliferative drugs released from stents inhibit the growth of SMCs to control NH, these drugs also inhibit EC growth.Citation10 The impaired or delayed endothelialization of drug-eluting stents is considered to be the primary reason for the occurrence of late stent thrombosis,Citation11 a serious complication that can result in heart attack or death.Citation12 In a similar way to what occurs with stents, the antiproliferative drugs are also released from vascular grafts to treat NH.Citation13,Citation14 PAT-loaded vascular grafts showed significantly delayed endothelialization,Citation13 which could potentially cause late thrombosis. Hence, there is a need to deliver drugs from these medical devices which can inhibit the growth of SMCs but also encourage the growth of ECs. Vitamin C (L-ascorbic acid [L-AA]) is one such therapeutic drug which has been shown to inhibit SMC growth and encourage EC growth when orally administered or added directly to the cell culture studies.Citation15,Citation16
The long-term goal of our research is to deliver L-AA from stents and vascular grafts to improve their endothelialization, thereby preventing late thrombosis, as well as inhibiting SMC growth and thereby preventing neointimal hyperplasia. As a first step towards this research goal, we have carried out four sets of in vitro cell culture experiments in this study to demonstrate the use of L-AA for encouraging EC growth and inhibiting SMC growth in comparison with other drugs (SIR and PAT) commonly used in stents and vascular grafts. To the best of our knowledge, no prior studies have been carried out on the following: (a) a comparative study of the effects of L-AA, SIR, and PAT on the growth of ECs and SMCs; (b) a comparative study of the effects of different doses of L-AA including 1 μg, 100 μg, 300 μg, 500 μg, and 1000 μg on the growth of ECs and SMCs.
Materials and methods
Drugs and chemicals
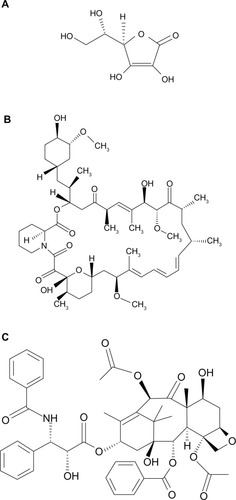
Vitamin-C (L-AA, chemical structure shown in ), ethanol (200 proof), and sterile-filtered Dulbecco’s phosphate buffered saline (DPBS) were purchased from Sigma-Aldrich (St Louis, MO, USA). SIR (chemical structure shown in ) and PAT (chemical structure shown in ) were purchased from ChemieTek (Indianapolis, IN, USA). The ethanol was sterile-filtered using a 0.22 μm polytetrafluoroethylene syringe filter prior to its use. All drugs were used as received.
Figure 1 Chemical structure of L-ascorbic acid (A), sirolimus (B), and paclitaxel (C).
Experimental set 1: effects of L-AA, SIR, and PAT on EC growth
In experimental set 1, the effects of different drugs including L-AA, SIR, and PAT on the growth of ECs were investigated.
Experimental set 2: effects of different doses of L-AA on EC growth
In experimental set 2, the effects of different doses of L-AA including 1 μg, 100 μg, 300 μg, 500 μg, and 1000 μg on the growth of ECs were investigated.
Experimental set 3: effects of L-AA, SIR, and PAT on SMC growth
In experimental set 3, the effects of different drugs including L-AA, SIR, and PAT on the growth of SMCs were investigated.
Experimental set 4: effects of different doses of L-AA on SMC growth
In experimental set 4, the effects of different doses of L-AA including 1 μg, 100 μg, 300 μg, 500 μg, and 1000 μg on the growth of SMCs were investigated.
Preparation of drug solutions
For experimental sets 1 and 3, the stock solutions of PAT and SIR were prepared in ethanol (20 mg/mL) while the stock solution of L-AA was prepared in DPBS (20 mg/mL). These stock solutions were then diluted in EC culture medium for experimental set 1 and SMC culture medium for experimental set 3 to obtain the final concentration of the respective drugs in the working solutions at 100 μg/mL. The final ethanol concentration in the working solutions of SIR and PAT was 0.5% volume per volume (v/v). The final DPBS concentration in the working solution of L-AA was 0.5% (v/v).
The stock solution of L-AA in DPBS was diluted in EC culture medium for experimental set 2, and SMC culture medium for experimental set 4; the working solutions were prepared over a wide range of L-AA doses including 1 μg/mL, 100 μg/mL, 300 μg/mL, 500 μg/mL, and 1000 μg/mL. The final DPBS concentration in these working solutions of the different doses of L-AA was 10% (v/v).
Human aortic endothelial cells and human aortic smooth muscle cell cultures
Human aortic endothelial cells (passage two), EC growth medium, human aortic smooth muscle cells (passage two), and SMC growth medium were all purchased from Cell Applications, Inc (San Diego, CA, USA). The ECs were cultured in the growth medium supplemented with fetal bovine serum (2%), basic fibroblast growth factor, heparin, epidermal growth factor, hydrocortisone, penicillin G, streptomycin sulfate, and amphotericin B. The SMCs were cultured in the growth medium supplemented with fetal bovine serum (5%), basic fibroblast growth factor, heparin, epidermal growth factor, insulin, penicillin G, streptomycin sulfate, and amphotericin B. The cells were cultured in a humidified incubator at 37°C with 5% CO2. Initially, the culture medium was changed after 24 hours. After that, the medium was changed after every 48 hours. When the cells reached 80% confluence in the flask, they were trypsinized and subcultured for the next passage. The cells from the third to sixth passages were used in these studies.
Addition of drugs to ECs
Unless otherwise mentioned, a density of 15 × 103 ECs (in 1 mL of growth medium) for experimental sets 1 and 2, and a density of 15 × 103 SMCs (in 1 mL of growth medium) for experimental sets 3 and 4 was seeded in the wells of 24-well tissue culture-treated polystyrene plates and incubated at 37°C in 5% CO2. The cells were allowed to grow in the wells for 20 hours before the addition of drug. After that, the different drugs (in experimental sets 1 and 3) or the different doses of L-AA (in experimental sets 2 and 4) were added to the wells. The cells were exposed to the drugs for 24 hours (for the time point day 1) or 48 hours (for time points day 3, day 5, and day 7). After the exposure time, the medium was removed and the cells were washed twice with DPBS to remove any unused drug from the wells, followed by the addition of fresh medium. Thereafter, the medium was changed every alternate day with the cells washed twice in DPBS every time that fresh medium was added.
Controls used in the study
In experimental sets 1 and 3, because the different drugs were exposed to the ECs and SMCs, respectively, in the presence of 0.5% ethanol (for SIR or PAT) or 0.5% DPBS (for L-AA) in the culture medium, three different controls were used in this part of the study. Control 1 represents the growth of ECs in experimental set 1 and SMCs in experimental set 3 in the culture medium with no drugs or any solvents (ethanol or DPBS) added to the medium. Control 2 represents the growth of ECs in experimental set 1 and SMCs in experimental set 3 in 0.5% DPBS (with no L-AA added) in the culture medium while the Control 3 represents the growth of ECs in experimental set 1 and SMCs in experimental set 3 in 0.5% ethanol (with no SIR or PAT added) in the culture medium.
In experimental sets 2 and 4, the different doses of L-AA were exposed to ECs and SMCs, respectively, in the presence of 10% DPBS in the culture medium. Therefore two different controls were used in this part of the study. Control 1 is the same as the one described in the previous paragraph. Control 2 represents the growth of ECs in experimental set 2 and SMCs in experimental set 4 in 10% DPBS (with no L-AA) in the culture medium.
Cell viability and proliferation
The viability and proliferation of cells were measured both quantitatively and qualitatively. Quantitative cell viability and proliferation were measured using the resazurin cell viability assay kit (alamarBlue®), which was purchased from Biotium, Inc (Hayward, CA, USA). Qualitative cell viability and proliferation were observed using a fluorescence microscopy after staining the live cells with fluorescein diacetate (Sigma-Aldrich).
Quantitative cell viability and proliferation by resazurin assay
After 1, 3, 5, and 7 days, the medium was removed and a mixture of resazurin solution (100 μL) and cell culture media (900 μL) was added to each well. The cells were incubated in the solution in the dark at 37°C for 6 hours. After that, the solution was orbitally shaken briefly (30 seconds) and the fluorescence of the solution was measured with an excitation wavelength at 530 nm and an emission wavelength at 590 nm using a Tecan Infinite® M200 microplate reader (Tecan Group Ltd, Mannedorf, Switzerland) (30 μs integration time, gain 25). The fluorescence of the blanks (100 μL resazurin solution and 900 μL growth medium in blank wells with no cells) was measured and these values were subtracted from the fluorescence values obtained for the experimental samples. The values presented here are the corrected fluorescence values.
Qualitative cell viability and proliferation by fluorescence imaging
Initially, a stock solution of fluorescein diacetate (FDA) was prepared in acetone at a concentration of 1 mg/mL. The working solution was prepared by adding 1 mL of the FDA stock solution to 9 mL of DPBS. After 1, 3, 5, and 7 days, the medium was removed and the cells were washed twice with DPBS. Then, a mixture of 1000 μL of DPBS and 75 μL of FDA working solution was added to each well and the cells were incubated in the dark at 37°C for 15 minutes. The cells were then imaged using Axiovert 200 M inverted fluorescence microscopy (Carl Zeiss Microscopy, Thornwood NY, USA).
Cell morphology
Cell morphology was observed by taking phase contrast images of cells after 7 days using Axiovert 200 M inverted microscopy in the bright field imaging mode.
EC phenotype
A density of 30 × 103 ECs was used for the phenotype study. After 3 days, the cells were washed twice with DPBS and fixed with 4% paraformaldehyde for 10 minutes at room temperature. The cells were then washed thrice with DPBS and incubated in blocking buffer (10% normal goat serum in DPBS) for 20 minutes. After that, the cells were incubated in 1 mL of primary antibody platelet-endothelial cell adhesion molecule (PECAM-1) (Santa Cruz Biotechnology, Inc, Santa Cruz, CA, USA) diluted 1:50 with 1.5% goat serum in DPBS for 90 minutes at room temperature. After washing with DPBS (three times for 5 minutes), the cells were incubated in 1 mL of fluorescein isothiocyanate labeled secondary antibody (goat anti-rabbit IgG-fluorescein isothiocyanate) (Santa Cruz Biotechnology) diluted 1:50 with 1.5% goat serum in DPBS for 60 minutes at room temperature. The cells were then washed thrice with DPBS for 5 minutes each; the nuclei were then stained by incubating the cells in 4′,6-diamidino-2-phenylindole dihydrochloride dye (Santa Cruz Biotechnology) for 5 minutes at room temperature. The cells were then washed with DPBS (three times), and imaged using a Nikon A1 laser scanning confocal microscopy (Nikon Inc, Melville, NY, USA).
Statistical analysis
For the cell viability and proliferation study of experimental set 1, four samples were used for each of control 1, control 2, control 3, SIR, PAT, and L-AA groups at each time point (1, 3, 5, and 7 days). Thus, 96 samples were used in this part of the study. Similarly, for experimental set 3, 96 samples were used. For experimental set 2, four samples were used for each of control 1, control 2, L-AA (1 μg/mL), L-AA (100 μg/mL), L-AA (300 μg/mL), L-AA (500 μg/mL), and L-AA (1000 μg/mL) groups at each time point (1, 3, 5, and 7 days). Thus, 112 samples were used for this part of the study. Similarly, for experimental set 4, 112 samples were used. The experimental data collected were presented as the mean ± standard deviation. A one-way analysis of variance was used to determine the statistical significance at P < 0.05. For the qualitative cell viability and proliferation, and cell morphology study, three samples were used for each of the six groups of samples in experimental set 1 and seven groups of samples in experimental set 2 at each time point. Hence, 156 samples were used in this part of the study. Similarly, for experimental sets 3 and 4, 156 samples were used. The fluorescence and phase contrast microscopy images were taken at six to eight different spots on each sample. For the EC phenotype study, two samples were used for each of the groups used in this study at one time point (day 3). Hence, 26 samples were used in this part of the study. The immunofluorescence microscopy images were taken at six to nine different spots on each sample.
Results
Viability and proliferation of ECs for L-AA, SIR, PAT, and controls
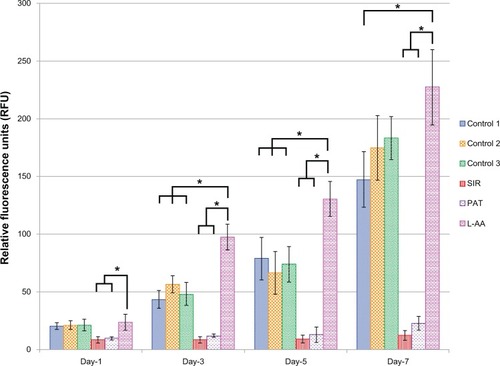
The viability and proliferation of ECs measured by resazurin assay for the three controls and the different drugs used in this study (SIR, PAT, and L-AA) are shown in . On day 1, no significant difference in the number of cells was observed between the three controls and L-AA. However, significantly fewer cells were observed for both the antiproliferative drugs SIR and PAT, than for the controls or L-AA. On day 3, the number of cells observed for L-AA was significantly greater than that of all the other samples used in this study including the three controls. SIR and PAT showed no significant increase in the cell growth compared to the number of cells observed for these samples on day 1. Similar trends were also observed on day 5. On day 7, L-AA showed a maximum number of cells followed by the three controls while the SIR and PAT antiproliferative drugs showed the least number of cells in the group. No significant difference in the number of cells was observed between the three controls at any time point. After 7 days, the EC growth for L-AA was 19 times, 10 times, and 1.5 times greater than that of SIR, PAT, and control 1, respectively. Based on these results, the cell viability and proliferation increased in the following order: SIR = PAT << Control 1 = Control 2 = Control 3 < L-AA. These results demonstrated that L-AA greatly promoted the growth of ECs while the antiproliferative drugs (SIR and PAT) used in currently available stents significantly inhibited the growth of ECs.
Figure 2 Endothelial cell viability and proliferation for L-ascorbic acid, sirolimus, paclitaxel, and controls.
Abbreviations: L-AA, L-ascorbic acid; PAT, paclitaxel; SIR, sirolimus.
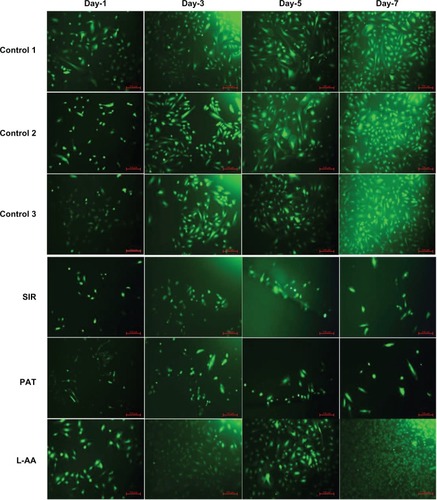
The fluorescence microscopy images of FDA-stained ECs for the different samples used in the experimental set 1 are provided in . The steady increase in the number of viable cells from one time point to the other was clearly observed in the images of controls and L-AA while no increase in the number of viable cells was observed in the images of SIR and PAT. After 7 days, all the control samples showed 70%–80% confluence while the L-AA treated cells showed >90% confluence. SIR and PAT showed very few viable cells with <20% confluence. These qualitative results of cell viability and proliferation were in excellent agreement with the quantitative assessment (resazurin data) provided in the above paragraph.
Figure 3 Fluorescence microscopy images of FDA stained ECs for L-AA, SIR, PAT, and controls (scale bar indicates 100 μm).
Morphology of ECs for L-AA, SIR, PAT, and controls
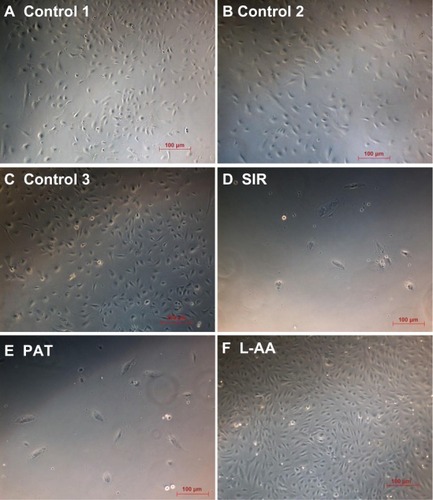
The phase contrast images taken after 7 days of cell growth for the different samples used in experimental set 1 are provided in . The ECs showed spreading morphology with characteristic polygonal shape for all three controls (–) and L-AA (). However, the cells showed an uncharacteristic oval or round shape with no spreading morphology for SIR () and PAT (). These results showed that the characteristic morphological features of ECs were well maintained for L-AA and controls while such features were not present in the cells treated with SIR or PAT.
Figure 4 Phase contrast images of ECs for L-AA, SIR, PAT, and controls (A–F) (scale bar indicates 100 μm).
Phenotype analysis of ECs for L-AA, SIR, PAT, and controls
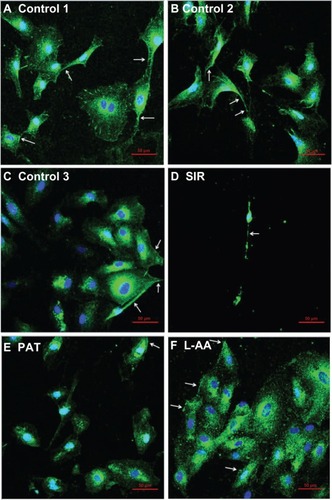
Platelet endothelial cell adhesion molecule-1 (PECAM-1) is an adhesion protein present on the EC membrane. PECAM-1 is characteristically expressed by ECs and is involved in regulating the adhesion of EC-EC and EC-leukocytes.Citation17 A stronger expression of PECAM-1 has been attributed to the endothelialization propertyCitation18 while its weaker expression has been attributed to possible cell damage.Citation19 In this study, the expression of PECAM-1 on all the controls and the cells treated with different drugs was confirmed by immunofluorescence microscopy (; arrows in the images show PECAM-1 expression – bright green staining at the cell surface). The expression of PECAM-1 was stronger for L-AA () and the three controls (–). No qualitative difference in the expression of PECAM-1 was observed between the L-AA treated cells and the three controls. However, the expression was weaker for SIR () and PAT (). These results suggest that the ECs preserved their phenotype and showed excellent endothelialization properties for L-AA and the controls while the cells showed poor endothelialization properties for SIR and PAT.
Figure 5 Immunofluorescence microscopy images of ECs for L-AA, SIR, PAT, and controls (A–F) (scale bar indicates 50 μm).
Viability and proliferation of ECs for the different doses of L-AA and controls
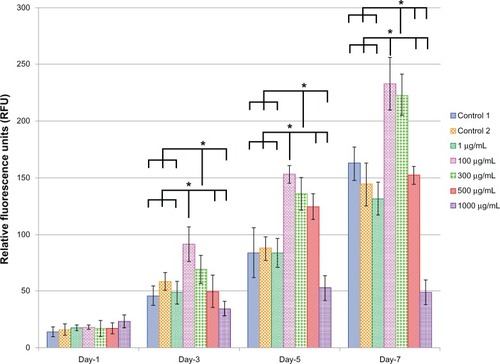
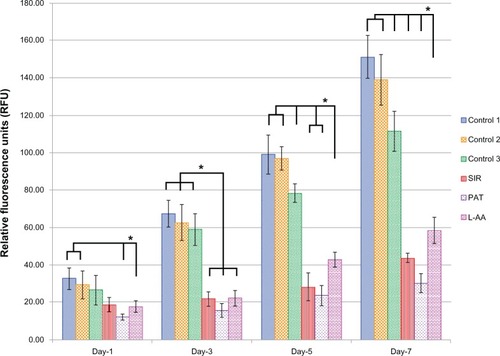
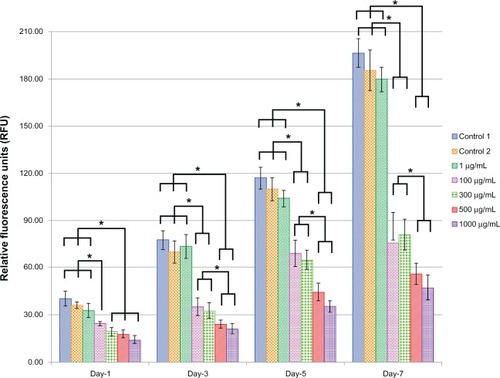
shows the EC viability and proliferation for the five different doses (1, 100, 300, 500, and 1000 μg) of L-AA and the two controls of experimental set 2. On day 1, no significant differences in the number of cells were observed between the different doses of L-AA and the controls. On day 3, the number of cells observed for the 100 μg L-AA dose was significantly greater than that of the controls and all the other L-AA doses except the 300 μg dose. On day 5, the L-AA doses 100 μg, 300 μg, and 500 μg showed a significantly greater number of cells, compared to controls and the other L-AA doses 1 μg and 1000 μg. On day 7, the doses 100 μg and 300 μg showed the maximum number of cells among the different groups and were significantly greater than that of any of the controls and all the other doses used in this study. No significant difference in the number of cells was observed between 100 μg and 300 μg doses. Also, no significant difference in the number of cells was observed between the controls and the L-AA doses 1 μg and 500 μg. The 1000 μg dose showed the least number of cells among the different groups used in this study. Based on these results, the viability and proliferation of ECs for the different doses of L-AA increased in the following order 1000 μg < 1 μg = Control 1 = Control 2 = 500 μg << 300 μg = 100 μg.
Figure 6 Endothelial cell viability and proliferation for the different doses of L-ascorbic acid.
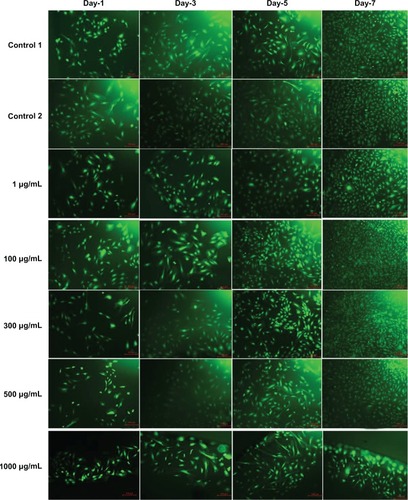
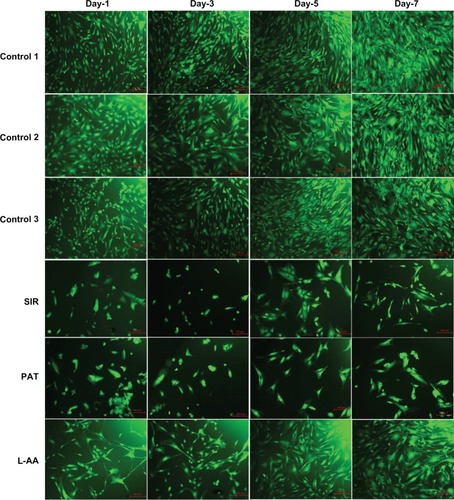
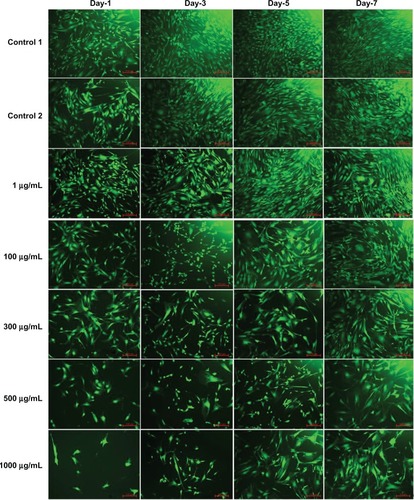
The fluorescence microscopy images of FDA-stained ECs for the different doses of L-AA and the controls used in the experimental set 2 are provided in . An increase in the number of viable cells from one time point to the other was observed for the controls and all the L-AA doses except the 1000 μg dose. After 7 days, the cells treated with 100 μg and 300 μg doses showed greater than 90% confluence while the controls and the cells treated with 1 μg and 500 μg doses showed ~80% confluence. For the 1000 μg dose, the cells were only ~30 confluent. These qualitative results were in excellent agreement with the quantitative resazurin data presented in the previous paragraph. Thus, these results demonstrated that the 100 μg and 300 μg doses of L-AA greatly favor the growth of ECs while the growth of cells for the 1 μg and 500 μg doses was equivalent to that of the controls, and the 1000 μg dose inhibited cell growth.
Figure 7 Fluorescence microscopy images of fluorescein diacetate-stained endothelial cells for the different doses of L-ascorbic acid (scale bar indicates 100 μm).
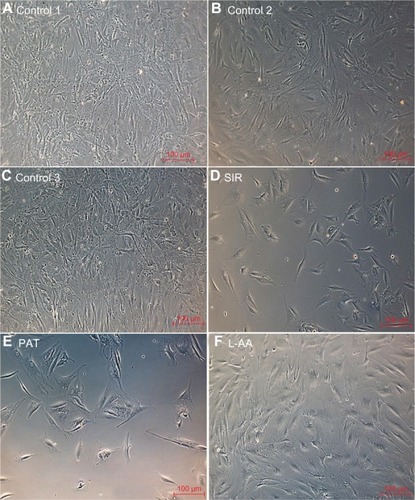
Morphology of ECs for the different doses of L-AA and controls
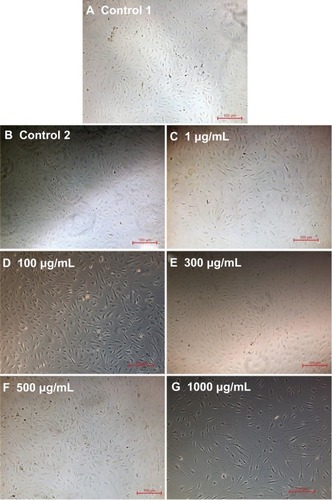
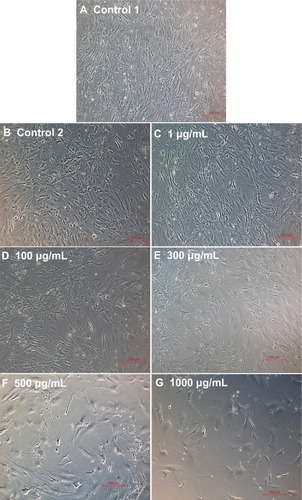
The phase contrast microscopy images of ECs after 7 days of growth for the different doses of L-AA and controls are provided in . The two controls () and the L-AA doses such as 1 μg, 100 μg, 300 μg, and 500 μg (–) showed spreading EC morphology with its characteristic polygonal shape. In the 1000 μg dose (), although the cells were spreading, they showed an elongated shape. These results suggested that the L-AA doses ranging from 1 μg to 500 μg did not alter the morphological features of ECs while the high dose such as 1000 μg can alter the shape of ECs.
Figure 8 Phase contrast images of endothelial cells for the different doses of L-ascorbic acid (A–G)(scale bar indicates 100 μm).
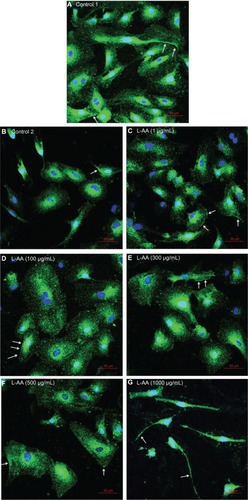
Phenotype analysis of ECs for the different doses of L-AA and controls
Immunofluorescent microscopy confirmed the expression of PECAM-1 for the two controls and the five different doses of L-AA (; arrows in the images show PECAM-1 expression – bright green staining at the cell surface). The PECAM-1 expression was strong for all the groups used in this experimental set and no qualitative differences in the expression were observed between the different groups.
Figure 9 Immunofluorescence microscopy images of endothelial cells for different doses of L-AA (A–G) (scale bar indicates 50 μm).
Viability and proliferation of SMCs for L-AA, SIR, PAT, and controls
The viability and proliferation of SMCs measured by resazurin assay for the three controls and the different drugs (L-AA, SIR, and PAT) used in this study are shown in . On day 1, all three drugs L-AA, SIR, and PAT showed significantly fewer cells than in Control 1. On day 3, the drugs L-AA, SIR, and PAT significantly inhibited cell growth and showed fewer cells than all three controls. Also, at this time point, no significant difference in the number of cells was observed between L-AA, SIR, and PAT. A similar trend was observed on day 5. However, SIR and PAT showed fewer cells than L-AA. Similar results were observed on day 7. Based on these results, SMC viability and proliferation decreased in the following order: Control 1 = Control 3 > Control 2 >> L-AA > SIR = PAT. Thus, these results demonstrated that L-AA significantly inhibited the growth of SMCs although the inhibitory effect was inferior to that of SIR and PAT.
Figure 10 Smooth muscle cell viability and proliferation for L-AA, SIR, PAT, and controls.
Abbreviations: L-AA, L-ascorbic acid; PAT, paclitaxel; SIR, sirolimus.
The fluorescence microscopy images of FDA stained SMCs for the different samples used in the experimental set 3 are provided in . These images showed that the cells were significantly proliferated on all three controls from one time point to the other, while cell growth was significantly inhibited for L-AA, SIR, and PAT. After 7 days, all control samples showed >90% confluence while the L-AA treated cells showed 50%–60% confluence. SIR and PAT showed very few viable cells with ~20% confluence. These qualitative results were in agreement with the quantitative assessment provided in the above paragraph.
Figure 11 Fluorescence microscopy images of FDA stained SMCs for L-AA, SIR, PAT, and controls (scale bar indicates 100 μm).
Morphology of SMCs for L-AA, SIR, PAT, and controls
The phase contrast microscopy images taken after 7 days of cell growth for the different samples used in experimental set 3 are provided in . SMCs showed spreading morphology with a characteristic spindle shape for all three controls (–). For L-AA (), although the cells were spindle shaped, they were less spreading compared to controls. For SIR () and PAT (), the cells were not spreading and only very few cells were spindle shaped with the remaining cells either triangular or irregularly shaped. These results suggested that the spreading of SMCs was affected by treating with L-AA, SIR, and PAT while the morphological features of cells were also affected by SIR and PAT treatments.
Figure 12 Phase contrast images of SMCs for L-AA, SIR, PAT, and controls (A–F) (scale bar indicates 100 μm).
Viability and proliferation of SMCs for different doses of L-AA and controls
shows the SMC viability and proliferation for the five different doses (1 μg, 100 μg, 300 μg, 500 μg, and 1000 μg) of L-AA and the two controls of experimental set 4. On day 1, the L-AA doses ranging from 100 μg to 1000 μg showed significantly fewer cells than controls and 1 μg L-AA dose. A similar trend was observed on day 3. Also, the L-AA doses 500 μg and 1000 μg showed fewer cells than 100 μg and 300 μg L-AA doses on day 3. Similar results were observed on day 5 and day 7. Based on these results, the cell viability and proliferation decreased in the following order: Control 1 = Control 2 = 1 μg >> 100 μg = 300 μg > 500 μg = 1000 μg.
Figure 13 Smooth muscle cell viability and proliferation for the different doses of L-ascorbic acid.
The fluorescence microscopy images of FDA-stained SMCs for the different doses of L-AA and the controls used in the experimental set 4 are provided in . These images showed that cells were proliferating significantly for the two controls and the 1 μg L-AA dose from one time point to the other, while cell growth was significantly inhibited for the L-AA doses ranging from 100 μg to 1000 μg. After 7 days, all the controls and 1 μg L-AA dose showed >90% confluence while the 100 μg and 300 μg L-AA doses showed 50%–60% confluence, and the 500 μg and 1000 μg L-AA doses showed 30%–40% confluence. Thus, these results demonstrated that L-AA showed a dose dependent inhibitory effect, with 1 μg dose showing no inhibitory effect and 1000 μg dose showing maximum inhibitory effect.
Figure 14 Fluorescence microscopy images of fluorescein diacetate-stained smooth muscle cells for the different doses of L-ascorbic acid (scale bar indicates 100 μm).
Morphology of SMCs for different doses of L-AA and controls
The phase contrast microscopy images of SMCs after 7 days of growth for the different doses of L-AA and controls are provided in . The two controls () and the 1 μg L-AA dose () showed spreading morphology with its characteristic spindle shape. In 100 μg and 300 μg L-AA doses (), although the cells were spindle shaped, they were not as spreading as the controls. For 500 μg and 1000 μg L-AA doses (), the cells were not spreading and the shapes were too elongated. These results suggested that the high L-AA doses affect the spreading and morphological features of SMCs.
Figure 15 Phase contrast images of smooth muscle cells for the different doses of L-ascorbic acid (A–G) (scale bar indicates 100 μm).
Discussion
The antiproliferative drugs (SIR and PAT) released from stents and vascular grafts inhibit the growth of SMCs and thereby prevent neointimal hyperplasia.Citation7,Citation14 The mechanisms of action of SIR and PAT on cells are different. SIR is cytostatic (inhibits cell growth and division) while PAT is cytotoxic (toxic to cells). Several studies in the literature have demonstrated the mechanisms of action of these drugs.Citation20,Citation21 Specifically, SIR is an immunosuppressive agent which works by binding to an intracellular receptor protein FKBP12 and causes cell cycle arrest.Citation20 However, PAT is a mitotic inhibitor which works by interfering with the normal breakdown of microtubules during cell division and inhibits cell growth.Citation21 These drugs are not cell specific. Hence, the growth of endothelial cells on stents and vascular grafts has also been inhibited by the same mechanism.Citation10,Citation13 This is a serious concern since the poorly endothelialized device surfaces can cause thrombosis.Citation11 Hence, there is a great need to use alternative drugs in these medical devices to promote ECs, and inhibit SMCs, to prevent thrombosis and neointimal hyperplasia, respectively. Vitamin C (L-AA) has been shown to promote ECsCitation22–Citation24 and inhibit SMCsCitation16,Citation23,Citation25 when orally administered or added directly to the cell cultures.Citation15,Citation16 Although vitamin C has such beneficial properties, to the best of our knowledge, it has not yet been used in stents or vascular grafts since the need to deliver a drug to encourage EC growth, and inhibit SMC growth, has arisen recently.
The proliferative effect of L-AA on ECs is due to its prominent role in synthesizing type IV collagen, which is required for the formation of basement membrane (where the ECs rest) and the regulation of EC adhesion.Citation26 L-AA significantly decreased the apoptosis of ECs under inflammatory conditions.Citation27 This effect arises from L-AA’s role in inhibiting cytochrome C release from mitochondria and preventing caspase 9 activation.Citation16 Also, L-AA increased the generation of nitric oxide by stabilizing tetrahydrobiopterin, a co-factor involved in nitric oxide production by nitric oxide synthases.Citation28 This has an effect not only in maintaining healthy EC function but also reducing oxidative stress and inflammation in the entire vessel wall. Several clinical trials have shown that the systemic administration of L-AA has reversed endothelial cell dysfunction caused by hypercholesterolemia, diabetes, and atherosclerosis.Citation15,Citation29,Citation30 L-AA has been shown to inhibit the proliferation of SMCs.Citation16,Citation23 The antiproliferative effect of L-AA on SMCs is due to the inhibition of membranous tyrosine kinase proteinCitation31 and reduction of L-cysteine transport and cellular glutathione levels.Citation23,Citation25 In addition to encouraging EC growth and inhibiting SMC growth, L-AA has been shown to inhibit the adhesion and aggregation of blood platelets,Citation32 which is crucial for preventing thrombosis.
In this research, a comparative study was conducted to investigate the effects of L-AA, SIR, and PAT on the growth of ECs and SMCs under similar conditions. A dose of 100 μg was chosen for all the different drugs used in experimental sets 1 and 3 due to the following reasons. A drug concentration of 100 μg/cm2 is commonly used for PAT-eluting stents,Citation7 which provides a total drug dose of 50 μg to 209 μg per stent depending on the stent size.Citation33 Similarly, a drug concentration of 140 μg/cm2 is commonly used for SIR-eluting stents,Citation7 which provides a total drug dose of 71 μg to 314 μg per stent depending on the stent size.Citation33 Hence, a dose of 100 μg was considered clinically relevant and used in this study. At this dose, both the antiproliferative drugs, SIR and PAT, significantly inhibited the growth of ECs. This clearly shows the role of these drugs in impairing endothelialization. However, L-AA significantly encouraged the growth of ECs even more strongly than the controls (with no drugs). Also, at this dose, L-AA significantly inhibited the growth of SMCs. Thus, this study demonstrates the use of L-AA over SIR and PAT for potential applications in stents and vascular grafts.
For experimental set 2, the different doses of L-AA including 1 μg (5.7 μM), 100 μg (567.8 μM), 300 μg (1.7 mM), 500 μg (2.8 mM), and 1000 μg (5.7 mM) were compared to determine which dose shows maximum EC growth. The typical plasma concentration of L-AA in humans ranges between 37 μM and 121 μM.Citation22 A plasma concentration of ≥70 μM of L-AA has been recommended for preventing coronary artery disease.Citation34 Ulrich-Merzenich et alCitation22 showed that when a dose of ≥60 μM of L-AA was added directly to the EC cultures, the drug acted as a mitogen and greatly encouraged the growth of cells. Similarly, Smith et alCitation24 showed a dose of 100 μM of L-AA significantly encourage the growth of ECs. However, Bowie and O’NeillCitation35 showed that a higher dose of 5 mM to 20 mM of L-AA has an inhibitory effect on ECs. These studies showed the importance of choosing the right dose of L-AA for promoting EC growth. Hence, in this study, the L-AA doses ranging from 1 μg (5.7 μM) to 1000 μg (5.7 mM) were compared to determine the optimal dose for effectively encouraging EC growth as well as inhibiting SMC growth. A low dose of 1 μg did not have a significant effect on EC or SMC growth as there was no difference observed when compared to that of the controls. A high dose of 1000 μg had a maximum inhibitory effect on SMCs, but this dose also had an inhibitory effect on ECs. Among the intermediate doses, 100 μg and 300 μg showed maximum EC growth after 7 days. Also, these doses significantly inhibited SMC growth. Hence, a dose of 100 μg (567.8 μM) to 300 μg (1.7 mM) can be coated on cardiovascular medical devices to improve their endothelialization properties. Our future studies involve the coating of these optimized L-AA doses on stents and vascular grafts and studying their endothelialization properties.
Conclusion
A comparative study was carried out to determine the effects of L-AA, SIR, and PAT on the growth of ECs and SMCs under similar conditions. Both SIR and PAT strongly inhibited EC growth while L-AA strongly encouraged EC growth. Also, L-AA significantly inhibited SMC growth although the inhibitory effect was inferior to SIR and PAT. A study of L-AA dosages showed that 100 μg and 300 μg doses promoted maximum EC growth when compared to the other doses (1 μg, 500 μg, and 1000 μg) and the controls used in the study. Also, the 100 μg and 300 μg L-AA doses significantly inhibited the growth of SMCs. Thus, this study demonstrates the use of L-AA over SIR and PAT for potential applications in stents and vascular grafts.
Disclosure
The authors report no conflicts of interest in this work.
References
- Mani G Feldman MD Patel D Agrawal CM Coronary stents: a materials perspective Biomaterials 2007 28 9 1689 1710 17188349
- Kannan RY Salacinski HJ Butler PE Hamilton G Seifalian AM Current status of prosthetic bypass grafts: a review J Biomed Mater Res B Appl Biomater 2005 74 1 570 581 15889440
- Ratner BD The catastrophe revisited: blood compatibility in the 21st Century Biomaterials 2007 28 34 5144 5147 17689608
- Wu KK Thiagarajan P Role of endothelium in thrombosis and hemostasis Annu Rev Med 1996 47 315 331 8712785
- Werner C Maitz MF Sperling C Current strategies towards hemocompatible coatings J Mater Chem 2007 17 3376 3384
- Kapadia MR Popowich DA Kibbe MR Modified prosthetic vascular conduits Circulation 2008 117 14 1873 1882 18391121
- Garg S Serruys PW Coronary stents current status J Am Coll Cardiol 2010 56 10 S1 S42 20797502
- Kipshidze N Dangas G Tsapenko M Role of the endothelium in modulating neointimal formation: vasculoprotective approaches to attenuate restenosis after percutaneous coronary interventions J Am Coll Cardiol 2004 44 4 733 739 15312851
- Newby AC Zaltsman AB Molecular mechanisms in intimal hyperplasia J Pathol 2000 190 300 309 10685064
- Joner M Nakazawa G Finn AV Endothelial cell recovery between comparator polymer-based drug-eluting stents J Am Coll Cardiol 2008 52 5 333 342 18652940
- Finn AV Nakazawa G Joner M Vascular responses to drug eluting stents: importance of delayed healing Arterioscler Thromb Vasc Biol 2007 27 7 1500 1510 17510464
- Pilgrim T Windecker S Drug-eluting stent thrombosis Minerva Cardioangiol 2009 57 5 611 620 19838151
- Innocente F Mandracchia D Pektok E Paclitaxel-eluting biodegradable synthetic vascular prostheses: a step towards reduction of neointima formation? Circulation 2009 120 Suppl 11 S37 S45 19752384
- Baek I Bai CZ Hwang J Nam HY Park JS Kim DJ Paclitaxel coating of the luminal surface of hemodialysis grafts with effective suppression of neointimal hyperplasia J Vasc Surg 2012 55 3 806 814 22226184
- Aguirre R May JM Inflammation in the vascular bed: importance of vitamin C Pharmacol Ther 2008 119 96 103 18582947
- Farbstein D Kozak-Blickstein A Levy AP Antioxidant vitamins and their use in preventing cardiovascular disease Molecules 2010 15 8098 8110 21063272
- Ma Z Kotaki M Yong T He W Ramakrishna S Surface engineering of electrospun polyethylene terephthalate (PET) nanofibers towards development of a new material for blood vessel engineering Biomaterials 2005 26 15 2527 2536 15585255
- Granchi D Cenni E Verri E Adhesive protein expression on human endothelial cells after in vitro contact with woven Dacron Biomaterials 1998 19 1–3 93 98 9678855
- Albelda SM Muller WA Buck CA Newman PJ Molecular and cellular properties of PECAM-1 (endoCAM/CD31): a novel vascular cell-cell adhesion molecule J Cell Biol 1991 114 5 1059 1068 1874786
- Marx S Jayaraman T Go L Marks A Rapamycin-FKBP inhibits cell cycle regulators of proliferation in vascular smooth muscle cells Circulation Research 1995 76 3 412 417 7532117
- Axel DI Kunert W Göggelmann C Paclitaxel inhibits arterial smooth muscle cell proliferation and migration in vitro and in vivo using local drug delivery Circulation 1997 96 2 636 645 9244237
- Ulrich-Merzenich G Zeitler H Panek D Bokemeyer D Vetter H Vitamin C promotes human endothelial cell growth via the ERK-signaling pathway Eur J Nutr 2007 46 2 87 94 17225921
- Ulrich-Merzenich G Metzner C Schiermeyer B Vetter H Vitamin C and vitamin E antagonistically modulate human vascular endothelial and smooth muscle cell DNA synthesis and proliferation Eur J Nutr 2002 41 27 34 11990005
- Smith AR Visioli F Hagen TM Vitamin C matters: increased oxidative stress in cultured human aortic endothelial cells without supplemental ascorbic acid FASEB J 2002 16 9 1102 1104 12039848
- Siow RC Sato H Leake DS Pearson JD Bannai S Mann GE Vitamin C protects human arterial smooth muscle cells against atherogenic lipoproteins: effects of antioxidant vitamins C and E on oxidized LDL-induced adaptive increases in cystine transport and glutathione Arterioscler Thromb Vasc Biol 1998 18 1662 1670 9763541
- Libby P Aikawa M Vitamin C, collagen, and cracks in the plaque Circulation 2002 105 1396 1398 11914242
- Rossig L Hoffmann J Hugel B Mallat Z Hasse A Freyssinet JM Vitamin C inhibits endothelial cell apoptosis in congestive heart failure Circulation 2001 104 2182 2187 11684628
- Heller R Unbehaun A Schellenberg B Mayer B Werner-Felmayer G Werner ER L-ascorbic acid potentiates endothelial nitric oxide synthesis via a chemical stabilization of tetrahydrobiopterin J Biol Chem 2001 276 40 47 11022034
- Ting HH Timimi FK Haley EA Roddy MA Ganz P Creager MA Vitamin C improves endothelium-dependent vasodilation in forearm resistance vessels of humans with hypercholesterolemia Circulation 1997 95 12 2617 2622 9193429
- Gocke N Keaney JF Frei B Long-term ascorbic acid administration reverses endothelial vasomotor dysfunction in patients with coronary artery disease Circulation 1999 99 3234 3240 10385496
- Lu LH Lee YT Chen HW Chiang LY Huang HC The possible mechanisms of the antiproliferative effect of fullerenol, polyhydroxylated C60, on vascular smooth muscle cells Br J Pharmacol 1998 123 6 1097 1102 9559892
- Bordia A Verma SK Effect of vitamin C on platelet adhesiveness and platelet aggregation in coronary artery disease patients Clin Cardiol 1985 8 552 554 4053437
- Tsimikas S Drug-eluting stents and late adverse clinical outcomes lessons learned, lessons awaited J Am Coll Cardiol 2006 47 10 2112 2115 16697332
- Levine M Dhariwal KR Welch RW Wang Y P JB Determination of optimal vitamin C requirements in humans Am J Clin Nutr 1995 62 Suppl 6 1347S 1356S 7495230
- Bowie AG O’Neill LA Vitamin C inhibits NF-kappa B activation by TNF via the activation of p38 mitogen-activated protein kinase J Immunol 2000 165 12 7180 7188 11120850