
Abstract
Purpose
To clarify the significance of mitochondria-related differentially expressed genes (MTDEGs) in UC carcinogenesis through a bioinformatics analysis and provide potential therapeutic targets for patients with UC associated colorectal cancer.
Methods
Microarray GSE37283 was utilized to investigate differentially expressed genes (DEGs) in UC and UC with neoplasia (UCN). MTDEGs were identified by intersecting DEGs with human mitochondrial genes. Utilizing LASSO and random forest analyses, we identified three crucial genes. Subsequently, using ROC curve to investigate the predictive ability of three key genes. Following, three key genes were confirmed in AOM/DSS mice model by Real-time PCR. Finally, single-sample gene set enrichment analysis (ssGSEA) was employed to explore the correlation between the hub genes and immune cells infiltration in UC carcinogenesis.
Results
The three identified hub MTDEGs (HMGCS2, MAVS, RDH13) may exhibit significant diagnostic specificity in the transition from UC to UCN. Real-time PCR assay further confirmed that the expressions of HMGCS2 and RDH13 were significantly downregulated in UCN mice than that in UC mice. ssGSEA analysis revealed the hub genes were highly associated with CD56dim natural killer cells.
Conclusion
RDH13, HMGCS2, and MAVS may become diagnostic indicators and potential biomarkers for UCN. Our research has the potential to enhance our understanding of the mechanisms underlying carcinogenesis in UC.
Introduction
Ulcerative colitis, characterized by chronic inflammation of the colonic mucosa, is recognized as a potential precursor for the onset of colorectal cancer,Citation1 and its pathogenesis remains unclear. Despite accounting for only 1% to 2% of all colorectal cancers, UC-associated colorectal cancer contributes to 10% to 15% of deaths in UC patients,Citation2 making it the leading cause of mortality among this population. Consequently, unraveling the intricate mechanism linking UC and colorectal cancer is crucial for developing targeted interventions to mitigate the risk and progression of colorectal malignancy in individuals with UC.
Mitochondria are vital organelles within cells that possess genetic material independent of the nucleus along with corresponding gene transcription and protein translation systems.Citation3 Additionally, mitochondria play pivotal roles in cellular energy metabolism,Citation4 apoptosis,Citation5 and oxidative stress response processes implicated in cancer development.Citation6 In the context of UC, the epithelium of the colon undergoes recurring episodes of inflammation and tissue repair, leading to oxidative stress and the accumulation of reactive oxidative species (ROS), contributing to tumor development and progression in CRC.Citation7 Recent studies have implicated mitochondrial dysfunction as a trigger of UC patients.Citation8,Citation9 Mitochondrial dysfunction can exacerbate chronic inflammation, which is a hallmark of UC. Chronic inflammation leads to the continuous release of inflammatory cytokines and growth factors, creating a microenvironment conducive to tumor development.Citation10 Furthermore, mitochondrial loss contributes to dysplastic lesion formation in ulcerative colitis patients.Citation11 However, only limited studies have shown the significant involvement of mitochondria in the carcinogenesis of UC.Citation12–14 Hence, conducting a comprehensive examination of genes associated with mitochondria and investigating their roles in the tumorigenesis of UC may prove beneficial in identifying innovative prognostic biomarkers and devising efficient prevention strategies for UCN.
In the present investigation, we utilized the GSE37283 dataset to identify differentially expressed genes (DEGs) that differentiate between UC and UCN. Employing a comprehensive approach that integrates mitochondria-related genes, bioinformatic analysis, and experimental verification, the aim was to pinpoint to identify mitochondria-associated genes that hold potential as biomarkers for the carcinogenic processes in UC. Furthermore, we investigated the relationship between key genes and immune cell infiltration, aiming to enhance our understanding of the UCN immunity process. Our primary goal was to provide novel perspectives on the intricate interplay among mitochondria, immune responses, and the carcinogenic processes in UC.
Materials and Methods
Datasets Preprocessing
Data for this study was gathered from the public database - GEO (Gene Expression Omnibus). A widely recognized repository for genomics data that facilitates data deposition, discovery, and access by researchers.Citation15 The GSE37283 dataset is microarray data, including samples from 4 cases of quiescent UC and 11 cases of UCN. The gene expression profiles from the GEO database were directly retrieved for subsequent analysis. The MitoCarta3.0 database provided the roster of genes associated with mitochondria for this study (http://www.broadinstitute.org/mitocarta).
Animal Models
All animal experiments were approved by the Institutional Animal Care and Use Committee (IACUC), The Second Xiangya Hospital, Central South University, China (approval ID: 2021108; approval date:3 March 2021). The animal experiments were conducted in accordance with the Provision and General Recommendation of Chinese Experimental Animals Administration Legislation.
To induce colitis-associated cancer in mice, we utilized the azoxymethane (AOM) and dextran sulfate sodium (DSS) model (AOM/DSS model). Male C57BL/6 mice, aged 6–8 weeks, were obtained from Slac Laboratory Animal Inc. Mice were intraperitoneally injected with a single dose of AOM (Sigma-Aldrich, St. Louis, MO, USA) at a concentration of 12 mg/kg body weight. AOM was freshly prepared in sterile saline solution immediately before use. Three days after the AOM injection, mice were administered 3% DSS (MP Biomedicals, Solon, OH, USA) dissolved in their drinking water for 5 days to induce colitis, repeated on days 25, and 45, as described.Citation16 To induce ulcerative colitis (UC), mice were administered 3% DSS in their drinking water for 5 days followed by a 5-day recovery phase.Citation17 Control mice received normal drinking water for 10 days.
The AOM-DSS mice were sacrificed on day 65. The DSS and control mice were sacrificed on day 10. Distal 3 mm pieces of the colon were used for RNA extraction.
Differential Gene Analysis and Intersection Analysis
Performing a differential gene expression analysis with the GSE37283 dataset, we employed the LimmaCitation18 R package. Our focus was on distinguishing UC samples from UCN samples, utilizing specific criteria (P<0.05 and |log2FoldChange (log2FC) | ≥ 1) to identify DEGs. To visualize the differential expression results, we employed the “ggplot2”Citation19 R package to generate volcano plots. DEGs were categorized into upregulated and downregulated based on log2FC, and the intersection with mitochondrial-related genes was explored to investigate the crucial functions of mitochondria in the process of UC evolving into UCN.
Functional Enrichment Analysis and PPI Network Analysis
Enrichment analysis, encompassing GO and KEGG enrichment, was conducted using the “clusterProfiler”Citation20,Citation21 R software package. The application of GO analysisCitation22 helps reveal underlying biological processes, molecular functions, or cellular components that are abundant in datasets. KEGG analysisCitation23 revealed information about DEGs-enriched pathways. Moreover, PPI network analysis reveals potential functional associations and molecular networks. The STRING databaseCitation24 (https://cn.string-db.org/) can be employed for conducting PPI analysis.
Immune Cell Infiltration Analysis
The single-sample gene set enrichment analysis (ssGSEA) was utilized in this study to assess immune infiltration.Citation25 Utilizing the “GSVA”Citation26 R software package, ssGSEA enables the quantification of marker genes associated with 28 distinct types of immune cells, thereby facilitating the estimation of the activity or functional status of specific immune cell categories and offering a comprehensive overview of the overall immune cell activities within the samples. The list of marker genes for these 28 immune cell types was obtained from the following website. (http://cis.hku.hk/TISIDB/data/download/CellReports.txt). We analyzed the relationship of key genes and immune cells using the ‘ggcorrplot’ package (R v0.92), while correlation analysis between different immune cell types was performed using the ‘corrplot’ package (R v0.1.4.1), with both utilizing the Pearson algorithm. Statistical analysis comparing the two groups of samples for each cell type was carried out using the ‘ggpubr’ package (R0.6.6), with statistical differences assessed through t-tests.
Identification of Key Genes and ROC Curve Construction
In this research, the Least Absolute Shrinkage and Selection Operator (LASSO) and Random Forest techniques were employed to identify pivotal genes. LASSO is a regression analysis method that performs both variable selection and regularization to enhance the prediction accuracy and interpretability of the statistical model it produces.Citation27 The implementation of the LASSO algorithm utilized the “glmnet” package for analysis.Citation28
The Random Forest is an ensemble learning method that constructs multiple decision trees during training and outputs the mode of the classes (classification) or mean prediction (regression) of the individual trees.Citation29 Using the “randomForest”Citation30 R package to execute the Random Forest algorithm, and the generated list included the top ten genes. By taking the intersection of two methods, crucial genes in the process of ulcerative colitis evolving into colorectal cancer were identified. The “pROC”Citation31 R package was employed for ROC curve analysis, aiming to evaluate the specificity and diagnostic value of key genes.
RNA Extraction and RT-qPCR
After extracting total RNA from tissues or cells using TRIzol (Invitrogen, USA) following the manufacturer’s instructions, we utilized the high-capacity cDNA Reverse Transcription Kit (AG, AG11728, Changsha, China) to facilitate the reverse transcription process. Subsequently, the SYBR Green Master Quantitative PCR System (YEASEN, Shanghai, China) was employed to conduct qRT-PCR, and the obtained results were calculated using the 2-ΔΔCT method to calculate the relative expression level (Primer sequences used in this study are listed in ).
Table 1 Primer Sequences for RT-qPCR. F: Forward, R: Reverse
Statistical Analysis
Data are presented as the mean ± SEM. Statistical analyses were conducted using Prism version 5.0c (GraphPad Software). For comparison between two groups, Student’s t-test was employed. Significance was determined with a threshold of p < 0.05, and actual p-values were reported. For in vivo studies, mice were randomly assigned to treatment groups. The n values represent independent biological replicates for individual mice in vivo experiments.
Results
Describing the Differences Between Patients with UC and UCN
In order to elucidate the intricate mechanisms associated with the progression from ulcerative colitis to colorectal cancer, we performed a comparative investigation into gene expression levels between two cohorts: UC and UCN. This analysis was performed using the Microarray dataset GSE37283 (). A microarray assay was carried out using RNA samples extracted from the colon mucosa of 15 patients, comprised of four patients with exhibited quiescent UC and eleven patients harboring UC with neoplasia. Comparing the two groups, we identified 558 downregulated genes and 458 upregulated genes in UCN patients in contrast to the UC group ( and ). Based on GO enrichment analysis, we discovered that the downregulated genes exhibited notable enrichment in processes such as cell-cell junction organization, the apical part of the cell, and movement based on actin filaments (). These biological processes have been implicated in tumor metastasis, particularly in the context of colorectal cancer,Citation32,Citation33 thus reinforcing the dependability of our data. Conversely, the upregulated genes exhibited significant enrichment involved in the process of negative regulation of cell migration, glycosaminoglycan binding, and collagen-containing extracellular matrix, ().
Figure 1 Flow chart of the study.
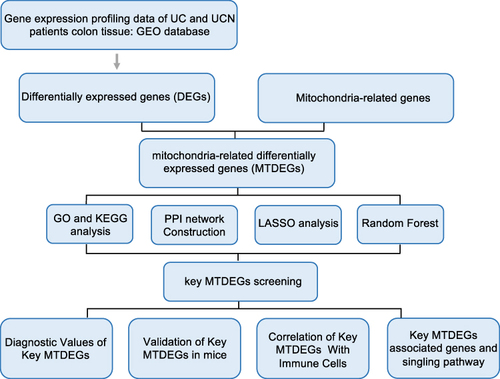
Figure 2 Identification and functional enrichment analysis of DEGs in UC patients without neoplasia (UC) and UC patients with neoplasia (UCN). DEGs between UC patients without neoplasia (UC) and UC patients with neoplasia (UCN) in the microarray set of GSE37283. (A) The differential comparison was carried out: UCN versus UC. (B) Volcano map of DEGs. (C–E) GO analyses of upregulated genes. (F) KEGG analyses of upregulated genes. (G–I) GO analyses of downregulated genes. (J) KEGG analyses of downregulated genes.
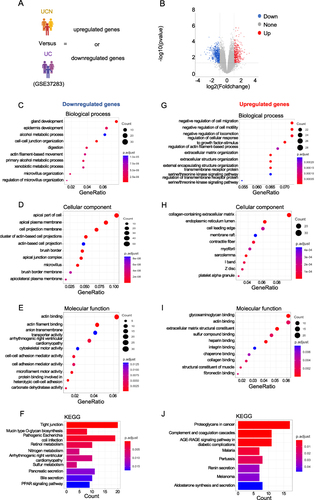
Aligned with the outcomes of the KEGG enrichment analysis, the results indicate a noteworthy involvement of downregulated genes in processes related to tight junction and retinol metabolismCitation34 (). Conversely, a notable role in cancer-associated proteoglycans and the AGE-RAGE signaling pathway in diabetic complications was demonstrated by the upregulated genes (). This study proposes that autoimmunity and metabolism play crucial roles in the process of ulcerative colitis carcinogenesis.
Identification and Function Enrichment of MTDEGs
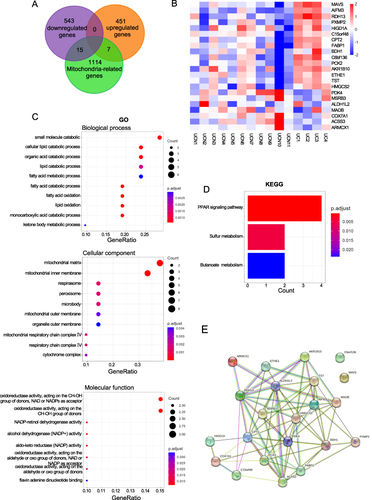
To explore the involvement of mitochondria in the transition from UC to UCN, we performed an intersection analysis. This analysis involved comparing the DEGs identified in patients with UC and UCN with a set of 1136 mitochondrial genes from the human MitoCarta3.0 database (). A total of 22 mitochondria-related DEGs (MTDEGs) were detected (). Among these genes, 15 were downregulated genes compared to the UC group (MAVS, AIFM3, RDH13, PXMP3, HIGD1A, C15orf48, CPT2, FABP1, BDH1, C6bf136, PCK2, AKR1B10, ETHE1, TST, and HMGCS2) while 7 were upregulated genes (PDK4, MSRB2, ALDH1L2, MAOB, COX7A1, ACSS3 and ARMCX1) (). Following this, we proceeded to conduct GO and KEGG enrichment analyses on the 22 MTDEGs to elucidate their contributions to biological processes, and we found that MTDEGs were primarily enriched in small molecule catabolic and fatty acid catabolic process (Biological process). In terms of cellular components, the enrichment was prominent in the mitochondrial matrix and mitochondrial inner membrane. Furthermore, for molecular functions, the MTDEGs were notably associated with oxidoreductase activity, specifically acting on the CH-OH group of donors, with NAD or NADP as acceptors (). Additionally, the KEGG results indicated that the PPAR signaling pathway might participate in mitochondria-regulated UC carcinogenesis (). To further explore MTDEGs and their relative mechanisms, we built a PPI network using a STRING database (), demonstrating the interaction among these distinctively expressed MTDEGs.
Figure 3 Screening of mitochondria‐related differentially expressed genes in the progression of UC to colorectal cancer. Screening of mitochondria-related differentially expressed genes in the progression UC to colorectal cancer. (A) Venn diagram showing 22 overlapping genes associated with mitochondria-related genes and upregulated DEGs or downregulated DEGs. (B) The heat maps show the 22 MTDEGs. (C) GO analysis of 22 mitochondria‐related DEGs. (D) KEGG analysis of 22 mitochondria‐related DEGs. (E) PPI network of 22 MTDEGs constructed by STRING.
Screening and Diagnostic Significance of Key MTDEGs Hubs in the Transition from Colitis to Carcinoma
To comprehensively investigate potential and significant MTDEGs, we employed advanced techniques such as LASSO regression and random forest analysis. In the initial step, candidate genes were carefully chosen for hub gene identification using the LASSO regression algorithm. The application of this algorithm yielded the identification of four key hub MTDEGs, highlighting their importance in the context of our study on the transition from colitis to carcinoma ( and ). Simultaneously, we examined the top 10 genes, namely RDH13, MAVS, AIFM3, TST, HMGCS2, CPT2, ARMCX1, COX7A1, PCK2, and C6bf136, as identified by the random forest algorithm (). By integrating the outcomes of both the LASSO regression and random forest algorithms, three key MTDEGs were confirmed, underscoring their significance in our study ().
Figure 4 Identification of key genes by machine learning algorithms. Identification of hub genes for based on machine learning algorithms included LASSO and random forest. (A) the Log (Lambda) value of the three genes in the LASSO model and the most proper log (Lambda) value in the LASSO model. (B) Cross-validation to select the optimal tuning parameter log (Lambda) in LASSO regression analysis. (C) The top 10 key genes screened by the random-forest algorithm. (D) Venn diagram displayed the overlap of genes screened by LASSO and random forest. (E–G) ROC Curve analysis of mitochondria-related hub genes.
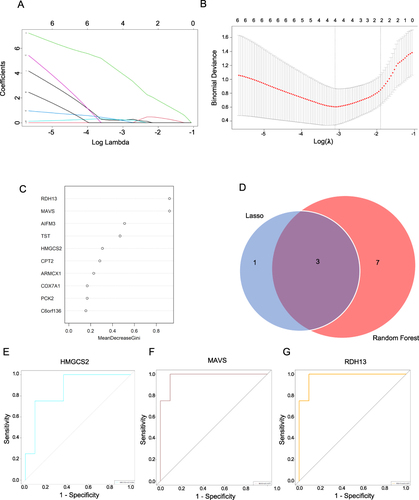
Consequently, ROC curves were employed to investigate the correlation between hub MTDEG expressions and the prognosis of UCN patients. An AUC (area under the curve) greater than 0.800 was considered indicative of high diagnostic specificity and sensitivity. As illustrated in , HMGCS2 displayed an AUC of 0.864, MAVS exhibited a substantial AUC of 0.977, and RDH13 showcased a similarly robust AUC of 0.977. The AUC values for all hub MTDEGs indicated that they are specific and important in the pathogenesis of cancer genesis in UC.
RT-qPCR and Datasets Validation of Hub MTDEGs
To validate the expression of HMGCS2, MAVS, and RDH13 in UC-related colorectal cancer, we established three groups of mouse models: a water group (Control), a DSS group (UC), and an AOM/DSS group (UCN). By extracting RNA from the distal colon tissues of these three groups, we found that, compared to the UC group, the mRNA levels of HMGCS2 and RDH13 were significantly downregulated in the UCN group, consistent with our bioinformatic analysis results (). However, there was no visible change in the mRNA level of MAVS.
Figure 5 The mRNA expression levels of three mitochondria-related hub genes were detected in mice model and the microarray set of GSE31106. (A–C) Validation of three hub genes by qRT-PCR. n=5-7. (D) The heat maps show three hub genes in the microarray set of GSE31106. n=3 (E) Expression of three hub genes in GSE31106. All data are presented as mean ± SEM. n indicates the number of biologically independent samples examined. p-values are indicated on the graph. Statistical values are determined by two-sided unpaired Student’s t-test.
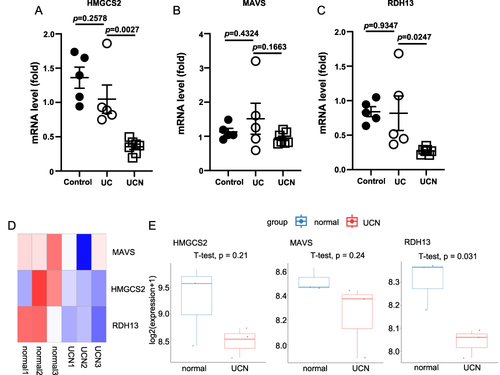
Additionally, we validated our findings using the publicly available GSE31106 dataset, which also applies the AOM/DSS mouse model. Compared to the normal group, the heatmap displayed a reduction of MAVS, HMGCS2, and RDH13 in the UCN group (). According to statistical analysis, the expression of HMGCS2 and MAVS in UCN revealed a downward trend, while RDH13 showed a significant decrease ().
Immune Cell Infiltration Analysis
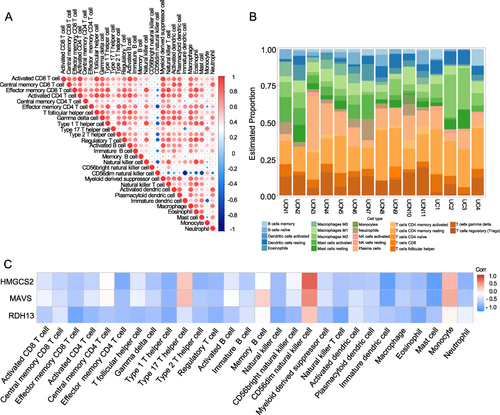
Ulcerative colitis is currently classified as an autoimmune disease and its pathogenesis is associated with the regulation of immune cells, considered the primary factors contributing to its carcinogenic processes.Citation17,Citation35 To explore this further, the proportions of 28 immune cell types in individual samples, based on the expression of genes matrix, were calculated using the “GSVA” package. In UC and UCN patients, we observed interactions among diverse subsets of immune cells (). Upon comparing the UCN group with UC, a higher prevalence of neutrophils and regulatory T cells (Tregs) was evident, while the UCN group exhibited a lower abundance of natural killer (NK) cells (). Subsequently, we examined the connection between the expression levels of hub MTDEGs and the abundance of immune cells. We found that all of the hub MTDEGs were associated with the abundance of CD56dim natural killer T cells (), which contributed to the inflammation of ulcerative colitis.Citation36 Additionally, HMGCS2 and MAVS were associated with type 17 T helper (Th17) cells and monocytes (). These results suggested that hub MTDEGs exert an influence on immunological signatures during UC oncogenic processes.
Figure 6 The relationship of hub MTDEGs with immune cells in UC and UCN patients. (A) The correlation of 28 immune cell subtypes between patients in UC and UCN; The size and color of the circle represent the Pearson correlation coefficient. (B) The histogram showed the infiltration of 28 immune cells in the GSE37283. (C) Relationship between hub MTDEGs and infiltration of immune cells.
Identification of Hub Genes-Related Genes and Signaling Pathways
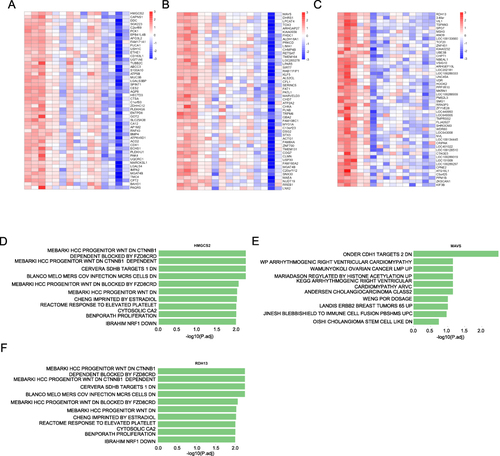
Moreover, we conducted a detailed examination of the exact signaling pathways and potential biological processes regulated by the key MTDEGs in the context of ulcerative colitis carcinogenesis. The generated heatmap visually represented the top 50 genes that exhibited a positive correlation with the identified key MTDEGs (). Subsequently, the top 10 signaling pathways associated with hub genes were performed using single gene-based GSEA (). The results of our investigation indicated associations between HMGCS2 and RDH13 with pathways such as Wnt signaling, cell-cell adhesion, the tricarboxylic acid (TCA) cycle, and cell proliferation. MAVS is implicated in metastasis, colonic epithelial cell maturation, and apoptosis. Taken together, the results strongly indicate that each of the key MTDEGs identified likely has crucial roles in governing cell growth and metabolism during the carcinogenesis of UC.
Figure 7 Hub MTDEGs-associated genes and signaling pathway. (A–C) Heatmap showing the top 50 genes positively correlating with hub MTDEGs. (D–F) Top 20 enriched signaling pathways of hub MTDEGs identified by GSEA.
Discussion
The role of mitochondria in the progression of UC to cancer has gained increasing attention. Mitochondria, beyond their conventional functions in energy production, are implicated in promoting carcinogenesis in the context of UC. The characteristic feature of UC is chronic inflammation, which leads to mitochondrial dysfunction, resulting in the generation of reactive oxygen species (ROS) and inflammatory substances, while sustained oxidative stress creates a microenvironment conducive to genetic mutations and cellular damage, fostering the initiation and progression of cancer. Mitochondrial DNA (mtDNA) mutations, prevalent in UC patients, further contribute to the promotion of carcinogenesis.Citation37 The accumulation of mtDNA mutations compromises the integrity of the mitochondrial genome, impacting critical cellular processes such as dysregulation of apoptosis that allows damaged cells to evade programmed cell death and promotes cell survival with oncogenic mutations. Additionally, impaired mitochondrial function may disrupt the balance between cell proliferation and cell death, favoring the clonal expansion of transformed cells. Despite their pro-carcinogenic potential, mitochondria also exhibit protective mechanisms that can mitigate the risk of carcinogenesis in ulcerative colitis. Mitochondria are essential regulators for apoptosis; their proper function ensures the elimination of damaged cells, preventing the survival and proliferation of cells with potential oncogenic mutations.Citation38 Therefore, the mechanism of mitochondria in carcinogenesis in ulcerative colitis remains controversial. There has been no bioinformatics analysis of mitochondria-related genes in the carcinogenesis of UC.
In this study, we screened 1016 DEGs in UC and UCN patients through the microarray dataset GSE37283. Subsequently, we identified a total of 22 MTDEGs by intersecting mitochondria genes with DEGs between UC and UCN patients, some of which had been previously verified to be involved in the carcinogenesis of UC. For instance, Yi Shen et al identified the pivotal role of Aldo-keto reductase 1B10 (AKR1B10) in governing the proliferation and injury repair processes of the colonic epithelium, along with its contribution to the pathogenesis of both ulcerative colitis and colorectal cancer.Citation39 Another bioinformatics investigation reported an increased HMGCS2 expression in UC,Citation40 which contradicts our findings.
LASSO regression and the random forest algorithm identified three key MTDEGs – HMGCS2, MAVS, and RDH13 – in the process of UC carcinogenesis. These hub genes exhibited notably elevated AUC values in the dataset, with HMGCS2 at 0.864, MAVS at 0.977, and RDH13 at 0.977. These results suggest that these three hub genes exhibit high specificity in the context of UC carcinogenesis, suggesting their potential utility as valuable diagnostic biomarkers. In order to confirm the outcomes of the bioinformatic analysis, we detect the mRNA expression level of hub MTDEGs in DSS-induced UC and UC associated-colorectal cancer mice model (AOM/DSS mice model). The findings indicated a reduction in the expression of HMGCS2 and RDH13 in mice with colorectal cancer when compared to the DSS-induced UC mouse model, aligning with our analysis results. However, MAVS expression did not show a significant change. Furthermore, we analyzed the expression of hub MTDEG in a dataset GSE31106 of AOM/DSS-induced UC-associated colorectal cancer mouse models. The findings indicated a downward trend in HMGCS2 and MAVS compared to the control group, with RDH13 showing a significant down-regulation. These findings indicate that RDH13 has a significant involvement in the carcinogenesis of UC.
UC is defined as an autoimmune condition marked by an excessively reactive immune response. Earlier investigations have revealed that macrophages can secrete inflammatory cytokines and chemokines thus contributing to UC pathogenesis and progression to colorectal cancer;Citation41 and Th17 cells are of significant importance in the regulation of both IL-23-mediated colitis-associated tumor formation and the advancement of sporadic colon cancer;Citation42 NKT cells may assume a crucial function in averting tumor advancement and mitigating inflammation in the carcinogenesis of UC,Citation43,Citation44 particularly CD56dim natural killer T cells, with elevated expression observed in UC patients.Citation36 Hence, to assess immune infiltration in the progression of UC to colorectal cancer, the ssGSEA function of the “GSVA” package was employed. Comparative analysis revealed increased numbers of neutrophils and T regulatory cells (Tregs) in the UCN group compared to the UC group. Conversely, there was a decrease in the count of NK cells observed in UCN. These findings are in accordance with earlier research, highlighting the crucial effect of these immune cells in UC carcinogenesis. Subsequently, we delved into an exploration of the relationship between these pivotal genes and the infiltration of immune cells, revealing a specific association with the abundance of CD56dim natural killer T cells. Moreover, HMGCS2 and MAVS exhibited a high association with type 17 T helper (Th17) cells and monocytes.
Moreover, we investigated the distinct signaling pathways enriched by the three identified key MTDEGs and probed into their potential influence on the progression of UC carcinogenesis. GSEA analysis revealed that HMGCS2 and RDH13 were implicated in Wnt signaling, cell-cell adhesion, the TCA cycle, and cell proliferation, and MAVS is implicated in metastasis, colonic epithelial cell maturation, and apoptosis. These results suggest that hub MTDEGs may play essential roles in controlling cell growth and metabolism during the development of UC into cancer. The Wnt signaling mainly participates in cell proliferation, stem cell self-renewal, and cellular differentiation during embryonic development and tissue homeostasis.Citation45 Studies have highlighted the crucial role of the Wnt signaling pathway in the carcinogenic process of ulcerative colitis.Citation46 Additionally, In UC patients with dysplasia, Herman van Dekken et al identified the intracellular accumulation of β-catenin, marking the activation of Wnt signaling—a distinctive characteristic. This accumulation is concomitant with an increase of the nucleoprotein cyclin D1 and a decrease of E-cadherin.Citation47 The TCA cycle is a pivotal metabolic pathway essential for energy generation and the synthesis of biosynthetic intermediates,Citation48 and believed to play a crucial regulatory role in the transition from inflammation to tumorigenesis.Citation49 Hence, the TCA cycle may have emerged as a participant in the intricate dance of UC carcinogenesis. The dynamics of cell-cell adhesion, a fundamental process in maintaining tissue integrity, present an intriguing avenue for exploration.Citation50 Cell-cell adhesion molecules, and glycoproteins involved in the embryogenesis, neoplastic, and inflammatory processes,Citation51 may contribute to the invasive nature of UC-associated cancer when disrupted. The maturation and apoptosis of colonic epithelial cells, essential for tissue homeostasis, warrant attention in the discussion of UC-related carcinogenesis.Citation52 In DSS-induced colitis, heightened apoptosis and diminished proliferation of colonic epithelial cells may result in the impairment of the epithelial barrier function.Citation53 This breakdown could enhance mucosal invasion by intraluminal microorganisms, thereby promoting the carcinogenesis of epithelial cells. However, the mechanisms underlying the involvement of the three hub genes in the carcinogenesis of UC have not been thoroughly investigated, necessitating further research.
Our research has certain limitations. One major limitation is the lack of sufficient publicly available human datasets specifically addressing ulcerative colitis (UC) and UC-associated colorectal cancer (UCN), resulting in a low number of samples available for our study. To overcome this, we plan to collect more clinical samples and validate our findings in patients, thereby enhancing the reliability of our research results.
Conclusion
In summary, bioinformatic analysis and machine learning techniques were utilized to identify three MTDEGs (HMGCS2, MAVS, and RDH13) associated with the carcinogenesis of UC. These genes have the capacity to influence the advancement and prognosis of UC carcinogenesis by regulating mitochondrial functions. Additionally, they may contribute to shaping future therapeutic strategies for addressing this condition.
Abbreviations
UC, ulcerative colitis; UCN, ulcerative colitis with neoplasia; DEGs, differentially expressed genes; MTDEGs, mitochondria-related differentially expressed genes; ROS, reactive oxidative species; AUC, area under the curve; TCA, the tricarboxylic acid; mtDNA, mitochondrial DNA; LASSO, the least absolute shrinkage and selection operator; HMGCS2: 3-hydroxy-3-methylglutaryl-CoA synthase 2; MAVS, mitochondrial antiviral-signaling protein; RDH13: retinol dehydrogenase 13.
Ethical Approval Statement
Our study used publicly available human data and has obtained an exemption from ethical approval by the Ethics Committee of the National Clinical Medical Research Center of The Second Xiangya Hospital, Central South University (approval number: 2024 No. M02).
Disclosure
The authors report no conflicts of interest in this work.
Acknowledgments
We express our appreciation for the assistance rendered by the National Key Research and Development Program of China (2020YFA0803604) and the National Natural Science Foundation of China, Key Program (82130024). We express our gratitude to the GEO database for granting access to their platforms. Additionally, we acknowledge and appreciate the contributors for sharing their meaningful datasets.
References
- Ekbom A, Helmick C, Zack M, et al. Ulcerative colitis and colorectal cancer. A population-based study. N Engl J Med. 1990;323(18):1228–1233. doi:10.1056/NEJM199011013231802
- Sebastian S, Hernández V, Myrelid P, et al. Colorectal cancer in inflammatory bowel disease: results of the 3rd ECCO pathogenesis scientific workshop (I). J Crohns Colitis. 2014;8(1):5–18. doi:10.1016/j.crohns.2013.04.008
- Roger AJ, Munoz-Gomez SA, Kamikawa R. The origin and diversification of mitochondria. Curr Biol. 2017;27(21):R1177–R1192. doi:10.1016/j.cub.2017.09.015
- Pasquale V, Ducci G, Campioni G, et al. Profiling and targeting of energy and redox metabolism in grade 2 bladder cancer cells with different invasiveness properties. Cells. 2020;9(12):2669. doi:10.3390/cells9122669
- Winter JM, Yadav T, Rutter J. Stressed to death: mitochondrial stress responses connect respiration and apoptosis in cancer. Mol Cell. 2022;82(18):3321–3332. doi:10.1016/j.molcel.2022.07.012
- Sabatino ME, Grondona E, Sosa LDV, et al. Oxidative stress and mitochondrial adaptive shift during pituitary tumoral growth. Free Radic Biol Med. 2018;120:41–55. doi:10.1016/j.freeradbiomed.2018.03.019
- Cha H, Lee S, Hwan Kim S, et al. Increased susceptibility of IDH2-deficient mice to dextran sodium sulfate-induced colitis. Redox Biol. 2017;13:32–38. doi:10.1016/j.redox.2017.05.009
- Haberman Y, Karns R, Dexheimer PJ, et al. Ulcerative colitis mucosal transcriptomes reveal mitochondriopathy and personalized mechanisms underlying disease severity and treatment response. Nat Commun. 2019;10(1):38. doi:10.1038/s41467-018-07841-3
- Verma A, Pittala S, Alhozeel B, et al. The role of the mitochondrial protein VDAC1 in inflammatory bowel disease: a potential therapeutic target. Mol Ther. 2022;30(2):726–744. doi:10.1016/j.ymthe.2021.06.024
- Wu Z, Xiao C, Long J, et al. Mitochondrial dynamics and colorectal cancer biology: mechanisms and potential targets. Cell Commun Signaling. 2024;22(1):91. doi:10.1186/s12964-024-01490-4
- Ussakli CH, Ebaee A, Binkley J, et al. Mitochondria and tumor progression in ulcerative colitis. J Natl Cancer Inst. 2013;105(16):1239–1248. doi:10.1093/jnci/djt167
- Tanaka T, Kobunai T, Yamamoto Y, et al. Assessment of the changes in mitochondrial gene polymorphism in ulcerative colitis and the etiology of ulcerative colitis-associated colorectal cancer. Anticancer Res. 2020;40(1):101–107. doi:10.21873/anticanres.13931
- Hsu N-Y, Nayar S, Gettler K, et al. NOX1 is essential for TNFα-induced intestinal epithelial ROS secretion and inhibits M cell signatures. Gut. 2023;72(4):654–662. doi:10.1136/gutjnl-2021-326305
- Chen R. Up-regulation of mitochondrial chaperone TRAP1 in ulcerative colitis associated colorectal cancer. World J Gastroenterol. 2014;20(45):17037–17048. doi:10.3748/wjg.v20.i45.17037
- Barrett T, Wilhite SE, Ledoux P, et al. NCBI GEO: archive for functional genomics data sets--update. Nucleic Acids Res. 2013;41(Database issue):D991–5. doi:10.1093/nar/gks1193
- Parang B, Barrett CW, Williams CS. AOM/DSS Model of Colitis-Associated Cancer. Methods Mol Biol. 2016;1422:297–307.
- Singh K, Coburn LA, Asim M, et al. Ornithine decarboxylase in macrophages exacerbates colitis and promotes colitis-associated colon carcinogenesis by impairing m1 immune responses. Cancer Res. 2018;78(15):4303–4315. doi:10.1158/0008-5472.CAN-18-0116
- Smyth GK. Linear models and empirical Bayes methods for assessing differential expression in microarray experiments. Stat Appl Genet Mol Biol. 2004;3:3. doi:10.2202/1544-6115.1027
- Ito K, Murphy D. Application of ggplot2 to pharmacometric graphics. CPT Pharmacometrics Syst Pharmacol. 2013;2(10):e79. doi:10.1038/psp.2013.56
- Yu G, Wang L-G, Han Y, et al. clusterProfiler: an R package for comparing biological themes among gene clusters. Omics. 2012;16(5):284–287. doi:10.1089/omi.2011.0118
- Wu T, Hu E, Xu S, et al. clusterProfiler 4.0: a universal enrichment tool for interpreting omics data. Innovation. 2021;2(3):100141. doi:10.1016/j.xinn.2021.100141
- Ashburner M. Gene ontology: tool for the unification of biology. Nat Genet. 2000;25(1):25–29. doi:10.1038/75556
- Kanehisa M, Goto S. KEGG: Kyoto encyclopedia of genes and genomes. Nucleic Acids Res. 2000;28(1):27–30. doi:10.1093/nar/28.1.27
- Szklarczyk D, Kirsch R, Koutrouli M, et al. The STRING database in 2023: protein-protein association networks and functional enrichment analyses for any sequenced genome of interest. Nucleic Acids Res. 2023;51(D1):D638–D646. doi:10.1093/nar/gkac1000
- Barbie DA, Tamayo P, Boehm JS, et al. Systematic RNA interference reveals that oncogenic KRAS-driven cancers require TBK1. Nature. 2009;462(7269):108–112. doi:10.1038/nature08460
- Hanzelmann S, Castelo R, Guinney J. GSVA: gene set variation analysis for microarray and RNA-seq data. BMC Bioinf. 2013;14(1):7. doi:10.1186/1471-2105-14-7
- Tibshirani R. The lasso method for variable selection in the cox model. Stat Med. 1997;16(4):385–395. doi:10.1002/(sici)1097-0258(19970228)16:4<385::aid-sim380>3.0.co;2-3
- Simon N, Friedman J, Hastie T, et al. Regularization paths for cox’s proportional hazards model via coordinate descent. J Stat Softw. 2011;39(5):1–13. doi:10.18637/jss.v039.i05
- Rigatti SJ. Random Forest. J Insur Med. 2017;47(1):31–39. doi:10.17849/insm-47-01-31-39.1
- Izmirlian G. Application of the random forest classification algorithm to a SELDI-TOF proteomics study in the setting of a cancer prevention trial. Ann N Y Acad Sci. 2004;1020(1):154–174. doi:10.1196/annals.1310.015
- Robin X, Turck N, Hainard A, et al. pROC: an open-source package for R and S+ to analyze and compare ROC curves. BMC Bioinf. 2011;12(1):77. doi:10.1186/1471-2105-12-77
- Shilova ON, Shilov ES, Lieber A, et al. Disassembling a cancer puzzle: cell junctions and plasma membrane as targets for anticancer therapy. J Control Release. 2018;286:125–136. doi:10.1016/j.jconrel.2018.07.030
- Yamaguchi H, Condeelis J. Regulation of the actin cytoskeleton in cancer cell migration and invasion. Biochim Biophys Acta. 2007;1773(5):642–652. doi:10.1016/j.bbamcr.2006.07.001
- Applegate CC, Lane MA. Role of retinoids in the prevention and treatment of colorectal cancer. World J Gastrointest Oncol. 2015;7(10):184–203. doi:10.4251/wjgo.v7.i10.184
- Li J, Ji Y, Chen N, et al. Colitis-associated carcinogenesis: crosstalk between tumors, immune cells and gut microbiota. Cell Biosci. 2023;13(1):194. doi:10.1186/s13578-023-01139-8
- Ng SC, Plamondon S, Al-Hassi HO, et al. A novel population of human CD56+ human leucocyte antigen D-related (HLA-DR+) colonic lamina propria cells is associated with inflammation in ulcerative colitis. Clin Exp Immunol. 2009;158(2):205–218. doi:10.1111/j.1365-2249.2009.04012.x
- Nishikawa M, Oshitani N, Matsumoto T, et al. Accumulation of mitochondrial DNA mutation with colorectal carcinogenesis in ulcerative colitis. Br J Cancer. 2005;93(3):331–337. doi:10.1038/sj.bjc.6602664
- Schapira AH. Mitochondrial diseases. Lancet. 2012;379(9828):1825–1834. doi:10.1016/S0140-6736(11)61305-6
- Shen Y, Ma J, Yan R, et al. Impaired self-renewal and increased colitis and dysplastic lesions in colonic mucosa of AKR1B8-deficient mice. Clin Cancer Res. 2015;21(6):1466–1476. doi:10.1158/1078-0432.CCR-14-2072
- Li Y, Tang M, Zhang FJ, et al. Screening of ulcerative colitis biomarkers and potential pathways based on weighted gene co-expression network, machine learning and ceRNA hypothesis. Hereditas. 2022;159(1):42. doi:10.1186/s41065-022-00259-4
- Wang W, Li X, Zheng D, et al. Dynamic changes and functions of macrophages and M1/M2 subpopulations during ulcerative colitis-associated carcinogenesis in an AOM/DSS mouse model. Mol Med Rep. 2015;11(4):2397–2406. doi:10.3892/mmr.2014.3018
- Punkenburg E, Vogler T, Büttner M, et al. Batf-dependent Th17 cells critically regulate IL-23 driven colitis-associated colon cancer. Gut. 2016;65(7):1139–1150. doi:10.1136/gutjnl-2014-308227
- Yoshioka K, Ueno Y, Tanaka S, et al. Role of natural killer T cells in the mouse colitis-associated colon cancer model. Scand J Immunol. 2012;75(1):16–26. doi:10.1111/j.1365-3083.2011.02607.x
- Huang E, Liu R, Lu Z, et al. NKT cells mediate the recruitment of neutrophils by stimulating epithelial chemokine secretion during colitis. Biochem Biophys Res Commun. 2016;474(2):252–258. doi:10.1016/j.bbrc.2016.04.024
- Cheng X, Xu X, Chen D, et al. Therapeutic potential of targeting the wnt/beta-catenin signaling pathway in colorectal cancer. Biomed Pharmacother. 2019;110:473–481. doi:10.1016/j.biopha.2018.11.082
- Shenoy AK, Fisher RC, Butterworth EA, et al. Transition from colitis to cancer: high Wnt activity sustains the tumor-initiating potential of colon cancer stem cell precursors. Cancer Res. 2012;72(19):5091–5100. doi:10.1158/0008-5472.CAN-12-1806
- van Dekken H, Wink JC, Vissers KJ, et al. Wnt pathway-related gene expression during malignant progression in ulcerative colitis. Acta Histochem. 2007;109(4):266–272. doi:10.1016/j.acthis.2007.02.007
- Martinez-Reyes I, Chandel NS. Mitochondrial TCA cycle metabolites control physiology and disease. Nat Commun. 2020;11(1):102. doi:10.1038/s41467-019-13668-3
- Sullivan LB, Gui DY, Vander Heiden MG. Altered metabolite levels in cancer: implications for tumour biology and cancer therapy. Nat Rev Cancer. 2016;16(11):680–693. doi:10.1038/nrc.2016.85
- Aman J, Margadant C. Integrin-dependent cell-matrix adhesion in endothelial health and disease. Circ Res. 2023;132(3):355–378. doi:10.1161/CIRCRESAHA.122.322332
- Trzeciak-Jedrzejczyk A, Makosiej R, Kolejwa M, et al. The role of adhesion molecules in inflammatory bowel disease in children. Assessment of the possible risk of cardiovascular complications. Prz Gastroenterol. 2017;12(3):181–185. doi:10.5114/pg.2017.70480
- Ramachandran A, Madesh M, Balasubramanian KA. Apoptosis in the intestinal epithelium: its relevance in normal and pathophysiological conditions. J Gastroenterol Hepatol. 2000;15(2):109–120. doi:10.1046/j.1440-1746.2000.02059.x
- Araki Y. Increased apoptosis and decreased proliferation of colonic epithelium in dextran sulfate sodium-induced colitis in mice. Oncol Rep. 2010;24(4):869–874. doi:10.3892/or.2010.869