
Abstract
Objective
To explored the potential molecular mechanism of Sugemule-4 decoction (MMS-4D) in treating insomnia.
Methods
DL-4-chlorophenylalanine (PCPA) + chronic unpredictable mild stress stimulation (CUMS) was used to induce an insomnia model in rats. After the model was successfully established, MMS-4D was intervened at low, medium, and high doses for 7 days. The open-field test (OFT) was used to preliminarily evaluate the efficacy. The potential mechanism of MMS-4D in treating insomnia was investigated using gut microbiota, serum metabolomics, and network pharmacology (NP). Experimental validation of the main components of the key pathways was carried out using ELISA and Western blot.
Results
The weights of the insomnia-model rats were significantly raised (p ≤ 0.05), the total exercise distance in the OFT increased (p ≤ 0.05), the rest time shortened, and the number of standing times increased (p ≤ 0.05), after treatment with MMS-4D. Moreover, there was a substantial recovery in the 5-HT, DA, GABA, and Glu levels in the hypothalamus tissue and the 5-HT and GABA levels in the colon tissue of rats. The expression of DAT and DRD1 proteins in the hippocampus of insomnia rats reduced after drug treatment. MMS-4D may treat insomnia by regulating different crucial pathways including 5-HT -, DA -, GABA -, and Glu-mediated neuroactive light receiver interaction, cAMP signaling pathway, serotonergic, glutamatergic, dopaminergic, and GABAergic synapses.
Conclusion
This study revealed that MMS-4D can improve the general state and behavioral changes of insomnia model rats. Its mechanism may be related to the reversal of abnormal pathways mediated by 5-HT, DA, GABA, and Glu, such as Serotonergic synapse, Dopaminergic synapse, Glutamatergic synapse, and GABAergic synapse.
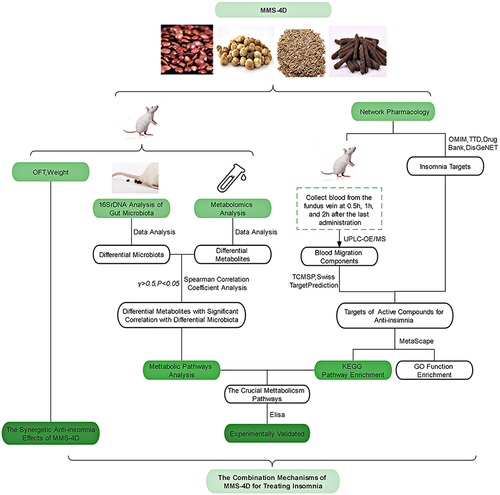
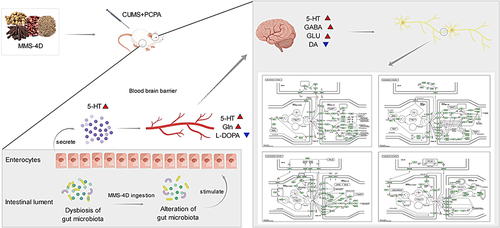
Graphical Abstract
Introduction
Insomnia is a common clinical disease manifested as difficulty in falling asleep or maintaining sleep, that is, frequent awakening, difficulty in resuming sleep after awakening, or inability to fall asleep again after waking too early. The characteristics of insomnia include sleep disorder and daytime symptoms. It can affect almost every aspect of life. For instance, it can negatively influence work performance, impede decision-making, and disrupt interpersonal relationships. In most cases, the overall quality of life of patients with insomnia is poor.Citation1 The treatment methods of modern medicine for insomnia include drug therapy and cognitive behavioural therapy. The drugs used can be summarized as drugs acting on the GABA-A receptor, melatonin receptor, orexin receptor antagonist and histamine-1 receptor antagonist. However, these drugs have adverse reactions to varying degrees, such as dizziness, headache, somnolence, and fatigue.Citation2 Cognitive behavioural therapy (CBT) represents the first‐line treatment option and has proven effective in various patient populations. However, about one‐third of patients receiving CBT do not respond to treatment and only about half achieve full remission.Citation3 CBT is also limited because it requires more skilled therapists to provide treatment effectively and entails higher out-of-pocket expenses.Citation4
Traditional Chinese medicine (TCM) based on the conception of holism and the theory of syndrome differentiation and treatment, TCM treats insomnia and regulates the patient’s body as a whole.Citation5 TCM is widely used in the treatment of insomnia in China due to its unique advantages, such as the synergistic effect of multiple components and targets, stable therapeutic effect, low adverse reactions, and low recurrence rate. TCM formulas have also been proven by evidence-based medicine to have good sedative and hypnotic effects.Citation6 TCM is intricately linked to Mongolian Medicine due to its distinctive and profound theoretical foundation, drug repositories, processing techniques, and drug administration protocols.Citation7 Mongolian Medicine has excellent safety and beneficial therapeutic effects on insomnia.Citation8 For example, Sugemule-4 decoction (MMS-4D) is an effective Mongolian medicine,Citation9 composed of Ziziphi Spinosae Semen (Pharmacopoeia of China 2020, Search results for Ziziphi Spinosae Semen - Medicinal Plant Names Services (kew.org)), Amomum kravanh Pierre ex Gagnep (Pharmacopoeia of China 2020, Search (worldfloraonline.org)), Cuminum cyminum L. (Search results for Cuminum cyminum L - Medicinal Plant Names Services (kew.org)), and Piperis Longi Fructus (Pharmacopoeia of China 2020, Search results for PIPERIS LONGI FRUCTUS - Medicinal Plant Names Services (kew.org)).
Its remarkable curative effect arises primarily from its long use in clinical practice. It is typically prescribed for treating insomnia resulting from excessive Heyi. In Mongolian Medicine, insomnia is a disease caused by the imbalance of the “three mahabodes” where excessive Heyi leads to dysfunction of the “body, heart, and speech” functions. The main treatment for insomnia should be to suppress Heyi, regulate the Sangen, dredge the circulation of Heyi and blood, and calm the heart and mind.Citation10 According to Mongolian medical pathology, the occurrence of insomnia is usually closely related to the imbalance of the digestive system’s three energy (digestive Xira, decomposed Badagan, and fire regulating Heyi) present in the gastrointestinal tract. After the imbalance of the three digestive functions, due to its light, dynamic, and fine nature, the fire regulating Heyi can easily be connected in series to other branches of Heyi, affecting sensory function. Sensory function is driven by Heyi and runs in the white meridian (the nervous system in modern medicine), mainly responsible for the body’s thinking and perception. Therefore, after insomnia occurs, a series of symptoms and signs such as indigestion, dizziness, tinnitus, blurred vision, forgetfulness, palpitations, mental instability, and unease often occur. This also indicates that there are still complex concept of holism in Mongolian medical theory, such as the “brain gut axis”, and “brain heart gut axis”.
Insomnia is linked to an imbalance in the gut-brain axis. Insomnia may be worsened by disruptions in the intestinal flora, including altered secretion of specific metabolites.Citation11 Various findings have demonstrated a bidirectional regulatory association between the CNS and intestinal microorganisms.Citation12 Herbal treatments contain phytochemical compounds that regulate the host and gut microbiota composition at several targets, thereby ameliorating mental health issues, including anxiety, depression, insomnia, and dementia.Citation13 Metabolomics can systematically analyze metabolites and discover various biomarkers and pathways of action after TCM treatment. The significance of evidence-based Chinese medicine and the mechanistic role of TCM can be effectively elucidated.Citation14 Because of the characteristic of “multiple components, targets and pathways” in TCM,Citation15 many difficulties have been encountered in comprehensively studying active ingredients and systematically explaining the underlying therapeutic mechanisms. However, the application of NP to the study of TCM may lay a foundation for future studies by enabling preliminary predictions of the potential material basis and mechanisms of TCM.Citation16
Thus, based on the concept of holism of Mongolian medicine, the current study used gut microbial, metabolomics, and NP analyses to evaluate the influences of MMS-4D on the serum metabolite profile and insomnia induced by CUMS+PCPA in rat models. Exploring the regulatory effects of MMS-4D on the gut and brain in the treatment of insomnia. This study may contribute to understanding the molecular mechanism by which MMS-4D treats insomnia and the intricate molecular relationship between drug–components–gut flora composition–serum metabolites, and insomnia.
Materials and Methods
Drugs and Reagents
The following substances were used in this study: fried Semen Ziziphi spinosae (Batch No.: 2,109,001), Wurfbainia vera (Batch No.: C357210602), Cuminum cyminum L. (Batch No.: 20,220,401), and Piper longum L. (Batch No.: 2,104,001) from Inner Mongolia Tiansheng Mongolian Traditional Chinese Medicine Co., Ltd.; estazolam (Batch No.: 044211011) Shijiazhuang Ouyi Pharmaceutical Co., Ltd.; mass spectrometry-grade acetonitrile and methanol from CNW Technologies; formic acid (mass spectrometry grade) and DL-4-chlorophenylalanine (PCPA) from SIGMA; and L-2-chlorophenylalanine from Shanghai Hengbai Biology.
Preparation of MMS-4D: 15 times the prescribed number of medicinal herbs (15 g of fried Semen ziziphi spinosae, 15 g of W. vera, 10 g of C. cyminum, and 5 g of P. longum) were obtained, crushed, and passed through an 80-mesh sieve. After adding 450 mL of water, the mixture soaked for 1 h and boiled for 30 min. After filtration through a 150-mesh pharmacopeia sieve, the medicinal solution was rapidly frozen at −30 °C and dried by decompression freeze drying.
Experimental Animals
Forty-eight male SPF-grade SD rats (200 ± 20 g, 3–8 weeks old) were obtained from Beijing Sibeifu Animal Co., Ltd. (production license no. SCXK [Beijing] 2019–0010). They were kept in a 12 h light/dark cycle in an animal room with 22 ± 2 °C and a relative humidity of 45 to 65%. They were allowed to drink and eat freely (Ethics review number: YKD202302055, approved by the Medical Ethics Committee of Inner Mongolia Medical University. These guidelines are the national standard “Guidelines for Ethical Review of Experimental Animal Welfare”, issued and officially implemented in China in 2018).
Of the 48 SPF-grade SD rats, 12 were used to detect the blood components of the drug, while the remaining 36 were used to study the drug’s action mechanism. One week after adaptive feeding, 12 SD rats were distributed into normal control (K; n = 6) and medication (S-4; n = 6) groups. The S-4 group was administered with 1.215 g/kg MMS-4D via gavage, while the animals assigned to the K group were given distilled water in an equal volume, administered at a fixed time each day for 7 consecutive days. The animals were anaesthetized and fasted for 12 h before administering the last dose. The blood was drawn from the tier fundus veins at 0.5, 1, and 2 h after their last injection. The serum was then separated, mixed in a 1:1:1 ratio, and refrigerated at - 80 °C for further analysis.
After one-week acclimatization, the remaining 36 SD rats were assigned to the normal control (C; n = 6) and modeling (M; n = 30) groups. The modeling animals were stimulated by CUMS for 14 consecutive days, that is, 24 h of fasting and water deprivation on day 1 of the experiment, 24 h of lying on wet bedding on day 2, 10 min of forced swimming in ice water at 5 °C on day 3, 10 min of forced swimming in hot water at 40 °C on day 4, 1 min of tail clamping on day 5, 24 h of tilting the cage at a 45° angle on day 6, and 24 h of continuous illumination on day 7. The entire process was cycled twice. On the last 2 days, 45 mg/mL PCPA was prepared and administered in a continuous intraperitoneal injection of 1 mL/100 g. The control animals received intraperitoneal injections of physiological saline on the last 2 days of modeling. However, they received no treatment throughout the first 12 days of the modelling period. After the completion of modeling, general state observation and OFT were conducted to examine the success of modeling. Physical sign observation included monitoring the fur, spirit, activity, sleep, diet, water, weight, and excretion status of each group of rats after the experiment. A self-made open box with a black inner wall (100 cm long and wide and 50 cm high) was used for the OFT. In the beginning, the test rats were positioned in the center of the bottom of the box, and their activity was recorded within 5 min. When the rats exhibited significant behavioural changes, such as circadian rhythm disorder, disordered hair, increased excitability, increased aggression, shorter total movement distance in the OFT, longer rest time, and less standing times, then the preparation of the rat insomnia model was successful.
The successfully molded rats were randomly allocated to model (M), MMS-4D high-dose (S-4H), MMS-4D medium-dose (S-4M), MMS-4D low-dose (S-4L), and estazolam (E) groups. The S-4H, S-4M, and S-4L MMS-4D rats were orally administered with 2.43, 1.215, and 0.6075 g/kg MMS-4D, respectively. Group E was orally administered with 0.5 mg/kg. Groups C and M received were equivalent amounts of distilled water daily at a constant time for 7 consecutive days. They were subjected to fasting for 12 h before the last administration. After the last administration, OFT was conducted, and fresh faeces were collected. Blood was drawn for 2 h after gavage while under isoflurane anesthesia and placed in a low-speed centrifuge for 20 min. The serum was separated, brain tissues were dissected, hypothalamic tissues were separated, and colon tissues were taken. For further analysis, all tissues were kept at - 80 °C. Details are provided in .
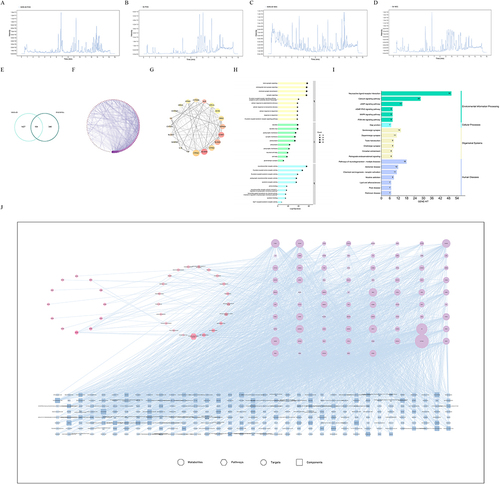
Figure 1 Analysis of the therapeutic effect of MMS-4D on insomnia. (A) Schematic of insomnia model replication, drug treatment, and OFT schedule. (B) Body weight, (C) total distance in OFT, (D) rest time in OFT, (E) number of times to lift the forelimbs in OFT, and (F) representative motion trajectory map of OFT. Data are represented as the mean (n = 6 per group).
16SrDNA analysis of gut microbiota
DNA Isolation
Total DNA was isolated from different samples via CTAB and washed in the elution buffer (50 μL). For PCR analysis, DNA was preserved at - 80 °C.
PCR and 16S rDNA Sequencing
Primers were sequenced using universal primers, and their 5ʹ ends were barcoded based on each sample. The reaction volume was 25 μL, which included template DNA (25 ng), each primer (2.5 μL) PCR Premix (12.5 μL), and PCR-grade water for volume adjustment. The prokaryotic 16S fragments were amplified using the following PCR conditions: initial denaturation for 30 at 98 °C; 32 cycles for 10s, annealing for 30s, 54 °C; extension for 45s at 72 °C; and final extension for 10 min at 72 °C. PCR results were validated by gel electrophoresis using 2% agarose gel.
The Qubit (Invitrogen, USA) was used for quantification of the PCR products after purification with AMPure XT beads (Beckman Coulter, USA). Sequencing amplicon pools were generated, and the determination of amplicon library amount and size was carried out via a library quantification kit for Illumina (Kapa Biosciences, USA), and an Agilent 2100 bioanalyzer (Agilent, USA), respectively. These libraries underwent sequencing using a NovaSeq PE250 system.
Data Analysis
Sequencing was performed on an Illumina NovaSeq platform in accordance with the instructions provided by the manufacturer. The paired-end reads were matched to the samples using their distinct barcode and then shortened by removing the barcode and primer sequence. The paired-end reads were combined using FLASH. The raw reads underwent quality filtering using particular criteria to acquire high-quality clean tags, as per fqtrim (v0.94). Vsearch (2.3.4) was used for filtering chimeric sequences. Feature tables and sequences were obtained via DADA2 after dereplication. By randomly normalizing to similar sequences, alpha and beta-diversities were measured. Based on the SILVA (release 138) classifier, the relative abundance of each sample was employed to normalize the feature abundance. Alpha-diversity was employed to assess the intricacy of species diversity in a given sample using five QIIME2 indices: Observed species, Chao1, Shannon, Simpson, and Goods coverage. Beta diversity was also estimated via QIIME2, and the R package was employed to plot the graphs. BLAST was used to align the sequences, with annotations using the SILVA database. R (v. 3.5.2) was used to generate the remaining diagrams.
Serum metabolomic analysis
Metabolite Extraction
Fifty microliters of sample were mixed with 200 μL of extract (methanol: acetonitrile = 1:1, containing isotopically labelled internal standard mixture) and the material was vortexed (30 s), sonicated on ice (10 min), and maintained at - 40 °C for 1 h for protein precipitation followed by centrifugation (12,000 rpm [R = 8.6 cm, RCF = 13,800 × g, 15 min, 4 °C) and the supernatants retained. Supernatant aliquots from different samples were mixed equally to generate the quality control (QC) sample.
LC-MS/MS Analysis
A UHPLC machine (Vanquish, Thermo) with a UPLC BEH amide column (2.1 mm × 100 mm, 1.7 μm) connected to an Orbitrap Exploris 120 instrument (Thermo Fisher) was used for the LC-MS/MS. The mobile phase was (A) 25 mmol/L ammonium acetate, (B) acetonitrile, and (25 mmol/L ammonia hydroxide in water with a pH of 9.75. The auto-sampler was set at 4 °C with 2 μL as the volume of injection. MS/MS spectra were obtained using an Orbitrap Exploris 120 instrument in information-dependent acquisition (IDA) mode with acquisition software (Xcalibur, Thermo) which continuously evaluated the full-scan MS spectrum. The following parameters were specified for the ESI source: capillary temperature of 320 °C, sheath gas flow rate of 50 Arb, auxiliary gas flow rate of 15 Arb, full MS resolution of 60,000, MS/MS resolution of 15,000, collision energy of 10/30/60 in NCE mode, and spray voltage of 3.8 kV (+ve) or −3.4 kV (-ve).
Data Preprocessing and Annotation
ProteoWizard was used for conversion of the raw data to mzXML formats. An internal program based on XCMS in R was used for data processing to detect, extract, align, and integrate peaks. Metabolites were annotated using an internal MS2 database (BiotreeDB) with a cutoff of 0.3.
After performing relative standard deviation denoising, 23,392 peaks were identified and excluded from the analysis. The minimal value was then used to fill up any missing data. The present data analysis used the internal standard normalization technique. For multivariate analyses, the final dataset, which included the sample name, peak number, and normalized peak area, was imported into the SIMCA16.0.2 software program (Sartorius Stedim Data Analytics AB, Umea, Sweden). The data were scaled and logarithmically processed to reduce the effects of noise and excessive variance in the variables. Following these adjustments, the distribution and sample grouping were shown using unsupervised and principal component analysis (PCA), lowering the data dimension. The threshold for detecting the possible outliers in the dataset was set at a 95% confidence interval (CI). Supervised orthogonal projections to latent structure-discriminate analysis (OPLS-DA) were performed to observe group separation and identify significantly altered metabolites. Sevenfold cross-validation was applied to determine the values of R2 and Q2. The measure of variance explained for a variable is denoted as R2, while the measure of predictability for a variable is denoted as Q2. Two hundred permutations were used for evaluation of the robustness and efficacy of the OPLS-DA model. The intercept values for R2 and Q2 were acquired. In this case, the intercept value of Q2 indicated the model’s stability, overfitting risk, and dependability; a smaller value signified higher accuracy. Further, the contributions of each variable to the model were summarized using the variable importance in projection (VIP) values of the first principal components in the model. Using t-tests, metabolites with VIP ≥ 1 and p ≤ 0.05 were considered substantially altered. The pathway enrichment analysis used KEGG (http://www.genome.jp/kegg/) and MetaboAnalyst (http://www.metaboanalyst.ca/).
Network pharmacological analysis
Identification of Blood Ingredient Components
Metabolite extraction involved dissolving 500 μL of the extract, which contained 10 μg/mL of the internal standard, in 80% methanol after adding 100 mg of the sample. The sample was vortexed for 30s, homogenized at 45 Hz for 4 min, and then sonicated for 1 h in an ice water bath.
After incubation at −40 °C for 1 h, samples were centrifuged at 12,000 rpm (RCF = 13,800 × g, R = 8.6 cm) and 4 °C for 15 min and the supernatants were carefully filtered using a 0.22 μm microporous membrane and preserved at −80 °C until the UHPLC-MS analysis. Then, 400 μL of plasma were added to 40 μL of HCl (2 mol/L). Nevertheless, some of the samples were considered insufficient; thus, it was collected proportionately (details are in the attached table). After 1 min vortexing, the mixture was incubated for 15 minutes at 4 °C. There were four repetitions of the vortexing and incubation cycle. Following high-speed centrifugation (12,000 rpm, 4 °C, 5 min), part of the supernatant (1800 μL) was placed in a clean tube and dried under nitrogen before mixing with 150 μL of 80% methyl alcohol (internal standard with 10 μg/mL) and vortexing for 5 min for reconstitution and centrifugation (12,000 rpm, 4 °C, 5 min). Lastly, some of the supernatant (120 μL) was placed in a new tube for LC/MS analyses.
LC-MS/MS Conditions
An LC-MS/MS analysis was conducted using a UHPLC system (Vanquish, Thermo) equipped with a Waters UPLC BEH C18 column (1.7 μm 2.1×100 mm). Both the sample injection volume and flow rate were set to 0.5 mL/min and 5 μL, respectively. A solution of 0.1% formic acid water (A) and 0.1% formic acid acetonitrile (B) comprised the mobile phase. The program for the multi-step linear elution gradient was described as 0 to 11 min, 85–25% A; 11 to 12 min, 25–2% A; 12 to 14 min, 2–2% A; 14 to 14.1 min, 2–85% A; 14.1 to 16 min, 85–85% A.
The MS and MS/MS data were acquired using an Orbitrap Exploris 120 mass spectrometer and Xcalibur software using the IDA acquisition mode. The mass range for each acquisition cycle was between 100 and 1500. After screening the top four of each cycle, the respective MS/MS data were acquired. The specified parameters include the following: sheath gas flow rate of 35 Arb, aux gas flow rate of 15 Arb, ion transfer tube at 350 °C, vaporizer at 350 °C, full MS resolution of 60,000, MS/MS resolution of 15,000, collision energy in NCE mode of 16/32/48, and spray voltage of either 4 kV (+ve) or −3.8 kV (-ve).
Data Preprocessing
Raw data were imported using XCMS. Various tasks related to data analysis and processing were carried out, such as retention time correction, peak recognition, extraction, integration, alignment, etc. The substances within the peaks comprising MS/MS data were detected via a fragmentation pattern matching method combined with a self-built secondary mass spectrometry database.
Collection of MMS-4D Targets and Active Components
Input the detected MMS-4D components into TCNSP database, and the screening criteria for bioavailability (OB) and drug-likeness (DL) criteria of ≥ 30%, ≥ 0.18, respectively. Targets of the drug-effective components were collected according to the “related targets” of the active components in the TCMSP database and then converted to GeneSymbol through the UniProt database. If any compound could not be queried in the TCMSP, then it was necessary to log in to the PubChem database to obtain the corresponding composition formula, import it to the SwissADME platform, set the gastrointestinal absorption level as “High”, select compounds that could meet the two standards according to Lipinski Drug-likeness principle, and define them as potential active compounds. Following that, the data was imported into the SwissTargetPrediction platform, with “homosapiens” selected as the species type and “probability ≥ 0” as the screening requirements for the component’s probability of producing the activity by acting on the target, serving as the threshold for predicting the target of action. The effective components of the four drugs were de-duplicated and combined, which were the active component of MMS-4D.
Acquisition of Insomnia-Related Targets
The genes associated with insomnia were acquired by retrieving the term “insomnia” from the Therapeutic Target Database (TTD), Online Mendelian Inheritance in Man (OMIM), Drug Bank, and DisGeNET databases. Afterwards, MMS-4D target genes were mapped with disease genes, and a union set was taken to obtain the potential target genes for MMS-4D intervention in insomnia.
Protein-Protein Interaction (PPI) Network Construction
Upload the intersection targets to the STRING11.0 database to elucidate the connection between MMS-4D components and insomnia-related targets. The default settings were used to construct the PPI model. Then, the relevant functions of Cytoscape 3.8.2 software were used to further analyze the network.
Gene Ontology (GO) and Kyoto Encyclopedia of Genes and Genomes (KEGG) Enrichments
The identified common targets of “compound disease” derived from the aforementioned processes were sequentially fed into the Metascape platform and analyzed using GO and KEGG methods. To characterize the target anti-insomnia biological process in GO analysis, sequential analyses of biological process (BP), cell composition (CC), and molecular function (MF) were performed. In KEGG analysis, the focus was on finding the main target-related signal pathways.
Construction of a “Differential Metabolites–Pathways–Targets–Active Compounds” Network
Based on the enrichment results of the MMS-4D-related pathway and integration with metabolomics results, the differential metabolites involved in the pathway, targets, and drug components corresponding to the relevant targets were statistically analyzed. The combined results were uploaded into Cytoscape to generate a network. The network was subsequently analyzed, and the core active ingredients, core targets, and core pathways of Sugemule-4 for treating insomnia were screened based on the degree values.
Experimental Verification
Key Objective Analysis
Correlations between the differential metabolites and microbiota were evaluated between the groups. Further enrichment analysis was carried out on differential metabolites with a CI of ≥ 0.5 and p ≤ 0.05 with the differential microbiota. To determine possible mechanisms, the study directed towards the shared pathways, as indicated by metabolomics and NP outcomes. The key substances in this pathway were selected for ELISA experiment verification by analyzing key pathways.
ELISA Analysis
The concentrations of 5-HT, DA, GABA, and Glu in the hypothalamus and colonic tissue were measured using an ELISA kit (Ruixin Biological).
Rinse the hypothalamic and colon tissues with pre cooled PBS (0.01 M, pH = 7.4) to remove residual blood, weigh and cut the hypothalamic and colon tissues into small pieces. Add the shredded tissue to the corresponding volume of PBS (in a weight to volume ratio of 1:9, for example, 1g of tissue sample corresponds to 9 mL of PBS, and the specific volume can be adjusted appropriately according to experimental needs and recorded. It is recommended to add protease inhibitors to PBS) into a glass homogenizer and grind thoroughly on ice. In order to further lyse tissue cells, the homogenate can be subjected to ultrasonic fragmentation or repeated freeze-thaw cycles. Finally, centrifuge 5000 rpm of the homogenate for 5–10 min and take the supernatant for detection. Dilute the standard substance separately, add samples to each well, incubate, prepare washing solution, wash, add enzyme, develop color, terminate, and determine. The detailed steps are strictly carried out according to the instructions.
Western Blot
Detection of DAT and DRD1 protein expression in hippocampal tissue using Western blot. Total protein extraction from tissues: Wash the tissue blocks 2–3 times with pre cooled PBS to remove blood stains, cut them into small pieces and place them in a homogenization tube. Add two 4 mm homogenization beads and 10 times the tissue volume of lysis solution (add various protease inhibitors within the first few minutes of use). Set up a homogenization program for homogenization; (If it is necessary to increase the protein concentration, the volume of the lysis solution can be reduced appropriately.) Take out the homogenization tube that has been completed, place the lysis solution on ice for 30 min, and shake every 5 min to ensure complete tissue lysis; Centrifuge at 12,000 rpm, 4 °C for 10 minutes, and collect the supernatant to obtain the total protein solution. Plasma protein nuclear protein extraction (nuclear protein and cytoplasmic protein extraction kit): Thaw the three reagents in the kit at room temperature, immediately place them on ice after thawing, and mix well. Take an appropriate amount of cytoplasmic protein extraction reagent A as a backup, and add PMSF within a few minutes before use to achieve a final concentration of 1 mM. Take an appropriate amount of nuclear protein extraction reagent for future use, and add PMSF within a few minutes before use, so that the final concentration of PMSF is 1mM. Cut the tissue into very small pieces as much as possible. Mix appropriate amounts of cytoplasmic protein extraction reagents A and B in a 20:1 ratio (for example, add 10 µL of extraction reagent B to 200 µL of cytoplasmic protein extraction reagent A), and add PMSF to the final concentration of 1 mM to prepare tissue homogenate. According to the ratio of adding 200 µL of lysis solution to every 60mg of tissue, add the lysis solution and perform machine homogenization. The homogenization should be done in an ice bath or at 4 °C. Leave the ice bath for 15 min. Centrifuge at 4 °C and 2000 rpm for 5 min, transfer the supernatant to a pre cooled EP tube to extract some cytoplasmic proteins. (When aspirating the supernatant, do not touch the precipitate.) At this step, there is still some plasma protein that has not been extracted, and the remaining precipitate is extracted again using the cell precipitation method. Add 200 µL of cytoplasmic protein extraction reagent A with added PMSF to every 20 µL of cell precipitation. Vortex vigorously at the highest speed for 5 s, completely suspend and disperse the cell precipitate; (If the cell precipitate is not completely suspended and dispersed, the vortex time can be appropriately extended.) Ice bath for 10–15 min. Add 10 µL of cytoplasmic protein extraction reagent B. Maximum high-speed intense vortex for 5 s, ice bath for 1 min. Maximum high-speed intense vortex for 5 s, centrifugation at 4 °C 12,000–16,000 rpm for 5 min. Immediately aspirate the supernatant into a pre cooled EP tube, which is the extracted cytoplasmic protein. For precipitation, completely absorb the remaining supernatant and add 50 µL of nuclear protein extraction reagent with PMSF added. The fastest and most intense vortex lasts for 15–30 s completely suspending and dispersing the cell precipitate. Then put it back into the ice bath and vortex vigorously at high speed for 15–30 s every 1–2 mi for a total of 30 min. 4 °C, 12,000–16,000 rpm centrifuge for 10 min. Immediately aspirate the supernatant into a pre cooled EP tube, which is the extracted nuclear protein. Protein denaturation: Add the protein solution to the reduced protein loading buffer in a 4:1 ratio, denature in a boiling water bath for 15 min, and store in a −20 °C refrigerator for later use. SDS-PAGE electrophoresis: Cleaning glass panels; Gluing and sampling; After the glass panel is naturally dried, pair a concave glass panel and a flat glass panel, place them in a glue maker, insert an oblique insertion plate to fix the glass panel, check if the bottom is aligned to avoid glue leakage; Prepare separation gel, mix them evenly immediately after adding TEMED, and pour the separation gel to an appropriate height. Before pouring the gel, you can try it with a comb. The distance between the comb teeth and the liquid surface of the separation gel is about 5–8 mm. Then slowly and evenly add pure water to the upper layer of the separation gel until it is full. After about 30 min, wait for the separation adhesive to solidify, then pour out the upper layer of water on the separation adhesive and use absorbent paper to absorb the remaining water. Prepare 5% concentrated adhesive (2 mL H2O, 0.5 mL 30% acrylamide, 0.5 mL 1M TRIS-Hcl (pH 6.8), 40 µL 10%SDS, 30 µL AP, 4 µL TEMED), then add it to TEMED, and immediately mix evenly to pour the adhesive. Fill the remaining space with concentrated glue and insert the comb into the concentrated glue, making sure there are no bubbles under the comb. After the concentrated gel has solidified, remove the gel maker and carefully remove the comb to prepare for electrophoresis. Place the gel maker in the electrophoresis tank and add sufficient electrophoresis solution before loading the sample for electrophoresis. Concentrated adhesive voltage is 90 V, and separated adhesive voltage is 150 V. Electrophoresis can be terminated approximately 1 cm to the bottom of bromophenol blue, and membrane transfer can be performed. Transmembrane transfer: Prepare 6 pieces of 7×9 cm filter paper and a moderately sized PVDF (0.45 µm) membrane. Before using the PVDF membrane, activate it with methanol for 2 min. Put the transfer membrane clamp, two sponges, a glass rod, filter paper, and activated PVDF membrane into a basin with transfer solution added. Open the clip, white on the left and black on the right, and add a sponge and three layers of filter paper on each side. Carefully peel off the separation adhesive and place it on the filter paper. Apply the PVDF membrane to the adhesive without any bubbles between the membranes. Cover the membrane with three filter papers and remove any bubbles. Finally, cover with another layer of sponge. Membrane transfer conditions: 300 mA constant current, 30 min, during the membrane transfer process, place the membrane transfer equipment in ice water to cool down. Immune response: place the transferred film into an incubation tank containing TBST, rinse it quickly once, then add 5% milk and place it on a decolorization shaker. Seal at room temperature for 30 min. Dilute the primary antibody according to the antibody instructions. After preparation, pour out the blocking solution from the incubation tank, add the prepared primary antibody, and incubate at 4 °C on a shaking table overnight (shake slowly). Recycle the primary antibody, rinse the membrane three times with TBST, then add TBST and place it on a decolorization shaker for rapid elution. Wash three times for 5 min each time. Dilute the secondary antibody with TBST in a ratio of 1:5000, then add it to the incubation tank, place it on a shaker and slowly shake it. Incubate at room temperature for 30 min. Use TBST to quickly rinse the film three times, then add TBST and place it on a decolorization shaker for quick washing. Wash three times for 5 min each time. Chemiluminescence will mix ECL A and B solutions in a 1:1 ratio for later use. Take out the washed PVDF film and place it on a absorbent paper. Slightly dry the liquid on top of the film, place the film on the shelf of the chemiluminescence instrument, add the mixed ECL luminescent solution, and let the liquid completely immerse the film. After 1 min of reaction, use absorbent paper to dry the excess liquid on top, put it into the chemiluminescence instrument, and start chemiluminescence according to the preset program. After exposure is completed, save the original image.
Statistical Analysis
Data were examined via SPSS 26.0 software. The results are presented as and compared using the t-test for two independent samples and one-way ANOVA for multiple mean values. The rank sum (Kruskal Wallis H) test was applied to experimental data that deviated from normal distribution. Spearman correlation coefficients were used to assess associations. Differences in the data were regarded as statistically significant (p ≤ 0.05) and number of repetitions n = 6. The chart was drawn using GraphPad Prism 9, Cytoscape 3.8.2, WeiShengXin, and FigDraw.
Results
Evaluation of the anti-insomnia therapeutic effect of MMS-4D
Compared with the observation in Group C, after modeling treatment, the rats’ circadian rhythm was disordered or even disappeared, their weight was significantly reduced (p ≤ 0.01), their hair was disordered, and their excitability and aggression increased. The total distance of OFT exercise decreased (p ≤ 0.01), the rest time was prolonged (p ≤ 0.01), and the number of standing times were reduced (p ≤ 0.01). In contrast to the findings in Group M, after treatment with MMS-4D and estazolam, the weight of the rats increased significantly, the total movement distance became longer (p ≤ 0.01), the rest time shortened (p ≤ 0.01), and the number of standing times elevated (p ≤ 0.01), as shown in . Therefore, MMS-4D and estazolam could improve the behavioural changes in insomnia model rats.
Improvement of gut flora imbalance in insomnia rats by MMS-4D
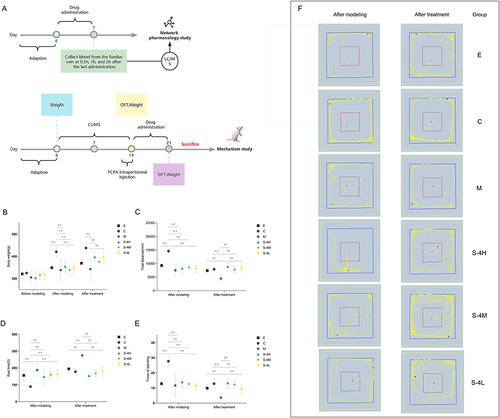
To assess the regulatory impact of MMS-4D on the composition of the intestinal microbiota in insomnia rats, we performed 16S-rDNA gene sequencing on rat faeces. After quality control, 6792 ASV feature sequences were generated from 36 detection samples and used for the following analysis. Subsequently, through the dilution curves of Chao1 and Shannon ( and ), and four α-diversity indices, namely Chao1, Shannon and Goods_Coverage and Singson to evaluate the abundance and diversity of gut flora (). The tendency of the sparse curve of diversity to flatten as the number of sequences increased to 10,000 suggests that the quantity of sequencing data was adequate and that most of the sample diversity was compensated through sequencing. Interestingly, the Chao1 dilution curve, Shannon curve, and four α-diversity indices did not differ among the groups (), indicating that estazolam treatment or MMS-4D intervention did not affect the species richness. Next, we used methods such as PCA and principal coordinate analysis (PCoA) to evaluate the β-diversity of the gut flora among different groups. Significant clustering was observed in each group’s microbial community composition, as demonstrated by PCA (). In contrast, PCoA showed considerable variations in the microbiota compositions in the six rat groups (), suggesting diverse compositions of the overall gut flora.
Figure 2 MMS-4D improves intestinal microbiota imbalance in insomnia ratsChao1 dilution curve of each experimental group, (B) Shannon dilution curve of each experimental group, (C) intergroup comparison of Chao1 index diversity, (D) intergroup comparison of Shannon index diversity, (E) Goods intergroup comparison of coverage index diversity, (F) intergroup comparison of Simpson index diversity, (G) principal component analysis (PCA), and (H) weighted UniFrac principal coordinate analysis (PCoA). (I) Relative abundance of gut microbiota at the phylum level in each group. (J) Comparison of representative differences in microbial abundance between groups at the phylum level. (K) Relative abundance of gut microbiota at the genus level in each group. (L) Comparison of representative differences in microbial abundance between groups in genus level. Data are represented as the mean (n = 6 per group).
By analyzing the similarity of bacterial classification at the levels of phylum and genus, the overall composition of the gut flora of the sixth ancestor was further compared. Firmicutes displayed phylum-level dominance across all six groups (). The abundance of Actinobacteriota in group M increased compared with that in group C (p ≤ 0.05 or p ≤ 0.01), while Cyanobacteria were reduced (p ≤ 0.05 or p ≤ 0.01). However, after the intervention of estazolam and S-4L, the abundance of Actinobacteriota and Cyanobacteria was markedly adjusted (p ≤ 0.05 or p ≤ 0.01), the abundance of Cyanobacteria in the S-4H and S-4M group was significantly adjusted (p ≤ 0.05 or p ≤ 0.01), (). At the genus level, as shown in the stacking diagram () of the top 30 abundance rankings, Romboutsia and UCG-005 were the dominant flora. Furthermore, 28 species of bacteria in group M changed significantly compared to group C. In addition, 38 species of different bacteria were screened between groups E and M, 32 species of different bacteria were screened between groups S-4H and M, 37 species of different bacteria were screened between groups S-4M and M, and 43 species of different bacteria were screened between groups S-4L and M. To observe the influence of MMS-4D on the disturbance of gut flora in insomnia model rats, we selected five representative bacterial genera for intergroup comparison. Relative to group C, the composition of gut flora in group M rats, the burden of Coriobacteriaceae_UCG-002, Dubosiella, Bifidobacterium, Prevotellaceae_NK3B31_group, and Anaerostipes increased (p ≤ 0.05 or p ≤ 0.01). However, after the intervention of estazolam and MMS-4D, the abundance of these flora was substantially adjusted (p ≤ 0.05 or p ≤ 0.01; ).
Serum metabolomic results and correlation analysis between differential gut flora and serum differential metabolites
Multivariate Data Analysis
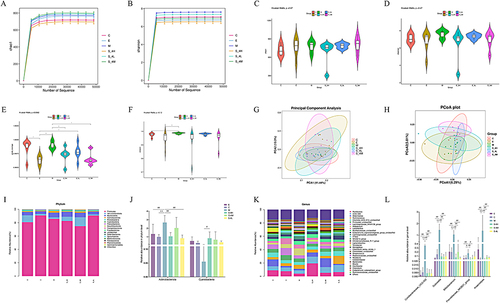
The fundamental peak chromatograms of the QC samples in positive and negative ion modes are shown in and (TIC chart in respective ion modes), indicating that each sample exhibited a good peak performance. The metabolites in the rat sera from the different groups were analyzed using PCA and OPLS-DA; pattern recognition maps of the two were acquired. Each group’s PCA pattern recognition diagram is presented in . The findings displayed substantial variations between groups M and C. In contrast, the administration group exhibited a clear trend of callback to group C, indicating that the metabolic components in the model group rats were interfered. The administration group could effectively adjust the abnormal biological metabolic pathways in the body, and the QC sample aggregation indicated that the instrument was stable This study focused primarily on the therapeutic biomarkers of MMS-4D, used OPLS-DA to compare the overall metabolic profiles of groups C and M, and screened specific metabolites between these two groups. According to the observed alterations in the levels of these potential biomarkers in the treatment group, further screening was conducted to identify the metabolic components that tended to change in concentration in the treatment group toward group C as potential biomarkers for further analysis. The OPLS-DA permutation test results are depicted in , and the OPLS-DA score scatter chart is presented in . In the OPLS-DA model, R2X = 0.27, R2Y = 0.999, and Q2 = 0.777 indicated that the OPLS-DA model had good predictability and adaptability. The endogenous metabolic components significantly differed between the M and C groups.
Figure 3 Analysis of serum metabolomic results and the relationship between differential metabolites and gut microbiota. (A) TIC diagram of QC samples in a positive ion mode, (B) TIC diagram of QC samples in a negative ion mode, (C) PCA score, (D) OPLS-DA permutation test, (E) OPLS-DA score between M and C groups, (F) differential pathway analysis chart between M and C groups,(G) differential pathway analysis chart between E and M groups, (H) differential pathway analysis between S-4H and M groups, (I) differential pathway analysis between S-4M and M groups, (J) differential pathway analysis between S-4L and M groups, (K) correlation analysis of differential bacteria and differential metabolites, (L) differential pathway analysis chart between M and C groups(bacterial flora related), (M) differential abundance score chart between M and C groups, (N) differential pathway analysis chart between E and M groups(bacterial flora related), (O) differential pathway analysis between S-4H and M groups(bacterial flora related), (P) differential pathway analysis between S-4M and M groups(bacterial flora related), and (Q) differential pathway analysis between S-4L and M groups.
Identification of Differential Metabolites
Differential metabolites between Group C and Group M were screened using VIP ≥ 1.0 and t-test (p ≤ 0.05) as screening criteria. The findings indicated that 187 distinct metabolites were screened. Among them, group E recalled 61 metabolites, group S-4H recalled 71 metabolites, group S-4M recalled 73 metabolites, and group S-4L recalled 79 metabolites. Extensive screening of differential metabolites was carried out on the following groups: groups E and M yielded 119 differential metabolites; groups S-4H and M revealed 154 differential metabolites; groups S-4M and M yielded 156 differential metabolites; and groups S-4L and M revealed 172 differential metabolites.
KEGG Enrichment Analysis of Differential Metabolites
The results showed that the metabolic differences between Group M and Group C were mainly related to changes in membrane transport pathways such as ABC transporters, amino acid metabolism such as tryptophan metabolism and glycine, serine and threonine metabolism, and nucleoside metabolism such as pyrimidine metabolism ().
The therapeutic efficacy of Eszolam may mainly involve changes in membrane transport pathways such as ABC transporters and metabolism of amino acid substances such as Tryptophan metabolism, as shown in . The therapeutic efficacy of MMS-4D is closely related to the above metabolic pathways, as well as the metabolism of the digestive system, such as Protein digestion and absorption, Bile secretion, and Mineral absorption, as shown in . This result also indirectly confirms the theory that insomnia is related to the digestive system’s three energy in the gastrointestinal tract.
Serum Differential Metabolites and Differential Gut Flora Correlation Analysis
Spearman analysis detected the associations between differential gut flora and serum differential metabolites. After the unique values of the differential metabolites were retained between the above six groups, 365 metabolites were obtained, with 93 different bacterial genera among each group. The relationship between 93 genera and 365 metabolites was tested (), and 189 differential metabolites with an absolute CI of ≥ 0.5 and p ≤ 0.05 were screened for pathway enrichment analysis. KEGG analysis showed metabolites that differed between groups M and C were mainly involved in histidine metabolism; phenylalanine metabolism; leucine, valine, and isoleucine biosynthesis; tryptophan metabolism; and phenylalanine, tyrosine, tryptophan biosynthesis (); and other amino acid metabolic pathways. The DA score is shown in . The treatment of insomnia with estazolam and MMS-4D was also closely related to the above metabolic pathways ().
The serum metabolites related to five representative bacterial genera Coriobacteriaceae UCG-002, Dubosella, Bifidobacterium, Prevotellaceae NK3B31uggroup, and Anaerostipes are shown in , indicating that Coriobacteraceae UCG-002, Dubosiella, and Bifidobacterium are positively correlated with bile excretion and affect the metabolism of substances such as Cholic acid. Dubosiella, Bifidobacterium are positively correlated with L-DOPA and negatively correlated with 5-HT, while Anaerostipes are negatively correlated with L-Tryptophan and DL Tryptophan.
Table 1 The Correlation Index Value List Between Representative Bacterial Genera and Serum Metabolites
Analysis results of NP and integrated analysis of NP and metabolomics
Identification Results of Blood Ingredient Components
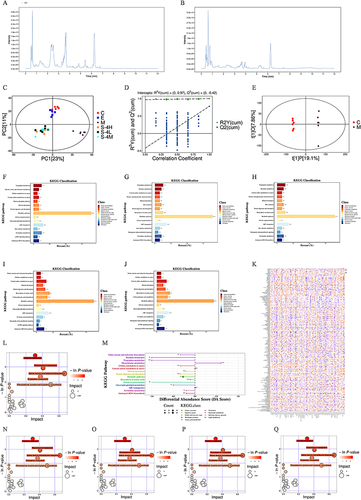
The sample was injected according to the analysis conditions in Section 2.5.1 to obtain the MMS-4D and total ion flow diagram of the drug-containing serum (). The structure of the chemical components was examined based on the method in Section 2.5.2, and the main components of MMS-4D were quickly characterized. Compounds with a fitting degree of ≥ 60% and ppm value ≤ 5×10⁻⁶ were taken. A total of 1330 compounds were identified from MMS-4D, 1171 compounds were found in the sera of group K, 1197 compounds in the sera of group S4, and 469 transitional components were identified in the blood; of these compounds, 326 had drug-likeness. The identification results are depicted in Supplementary Table 1.
Figure 4 Results of NP and integrated analysis of NP and metabolomics. (A) TIC diagram of MMS-4D in a positive ion mode, (B) TIC diagram of drug-containing serum in a positive ion mode, (C) TIC diagram of MMS-4D in a negative ion mode, (D) TIC diagram of drug-containing serum in a negative ion mode, (E) Wayne diagram of potential targets for the MMS-4D treatment of insomnia, (F) PPI network diagram, (G) core target diagram, (H) GO enrichment analysis, (I) KEGG pathway enrichment analysis, and (J) network of “differential metabolites–pathways–targets–active compounds”.
Network Pharmacological Analysis
A total of 1531 targets for MMS-4D blood ingredient components and 346 targets related to insomnia were obtained through relevant databases. MMS-4D was crossed with disease targets to obtain 104 common potential targets, and this information was used to draw a Wayne diagram ().
PPI Networks and Core Target Acquisition Results
STRING was used to analyze the PPI networks of intersection targets, with Cytoscape used for visualization (). The 20 most core targets screened using CytoHubba are shown in . These targets play a crucial role in PPI and are important potential targets for MMS-4D in insomnia treatment.
Biofunctional Enrichment and Pathway Analysis of Common Potential Targets
The Metascape website was run to enrich GO functionality with p ≤ 0.05. The top 10 entries were plotted with a p-value (). KEGG pathways were analyzed with p ≤ 0.05, and the core pathway map was plotted for the top 20 entries with a p-value ().
GO analysis revealed that BP was predominately involved in chemical synaptic transmission, anterograde trans-synaptic signaling, and trans-synaptic signaling; CC mainly involved dendrites, dendritic trees, postsynaptic membrane, etc.; MF was mainly involved in the activities of neurotransmitter receptors, G protein-coupled amine receptor, G protein-coupled serotonin receptors, etc. Insomnia treatment with MMS-4D primarily involved the calcium signaling pathway, neuroactive light receptor interaction, and pathways associated with neurodegenerative multiple disorders based on the KEGG analysis.
Integrated Analysis of NP and Metabolomics
We focused on the shared pathways of NP and metabolomics to discover their potential mechanisms. The enriched KEGG metabolic pathways were crossed in the two experiments, and overlapping metabolic pathways were selected for 21 metabolic pathways. Based on the metabolic pathway, the therapeutic targets, differential metabolites, and active compounds of MMS-4D for insomnia were further derived, and a “differential metabolites-pathways-targets-active compounds” network was drawn. This network comprised 385 nodes and 2601 edges, involving 12 differential metabolites, 77 target genes, 275 MMS-4D active compounds, and 21 signaling pathways (). shows the ranking results among the network’s top 20 active ingredients, targets, and pathways based on their degree values. Differential metabolite-related genes and key targets were obtained from each pathway for crossover, and duplicate targets, namely, SLC6A4, DRD2, SLC6A3, ADORA2A, DRD4, DRD3, HTR1A, CYP1A2, HTR6, DRD1, HTR7, ADRB1, ADRB2, CYP3A4, HTR1B, and HTR1D, were obtained.
Table 2 Top 20 Nodes of Network Degree Value of “Differential Metabolites–Pathways–Targets–Active Compounds.”
Experimental verification results
Selection of Key Substances
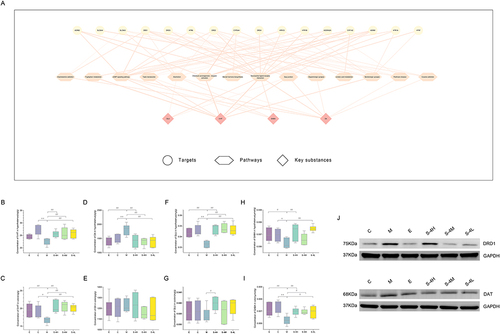
Significant pathways were traced based on the above key targets, and a network with pathway-related substances was constructed (). The network consisted of 16 targets, 14 metabolic pathways, and 4 pathway-related substances. The results revealed that most key pathways and targets were related to 5-HT, DA, Glu, and GABA. Therefore, these four substances were selected in this experiment for validation.
Figure 5 Experimental verification results. (A) Network of “key target, key pathway, key substance”. (B) Concentration of 5-HT in the hypothalamus. (C) Concentration of 5-HT in the colon. (D) Concentration of DA in the hypothalamus. (E) Concentration of DA in the colon. (F) The concentration of GLU in the hypothalamus. (G) The concentration of GLU in the colon. (H) Concentration of GABA in the hypothalamus. (I) The concentration of GABA in the colon. (J) The expression of DRD1 and DAT in the hippocampus. Data are represented as the mean (n = 6 per group).
ELISA Analysis
As shown in , the contents of 5-HT, DA, Glu, and GABA in the hypothalamic tissue of group M rats significantly changed (p ≤ 0.05 or p ≤ 0.01), and this change was reversed after MMS-4D were given. The levels of DA, Glu, and GABA in the hypothalamic tissue reversed after Estazolam were given. The contents of 5-HT and GABA in the colon tissue of the M group model rats were substantially lower (p ≤ 0.05 or p ≤ 0.01). Although the amount of Glu decreased, no marked change was observed; the DA content also had no significant change. After estazolam and MMS-4D administration, 5-HT, GABA, and Glu contents increased.
Western Blot
The levels of DRD1 and DAT in the hippocampal tissues of the M group revealed higher levels than the C group (). However, after treatment, there was a decrease in the expression level of these proteins.
Discussion
The mechanism by which MMS-4D treats insomnia was comprehensively examined in this experiment by integrating NP, 16SrDNA of gut microbiota, and serum metabolomics. The findings suggested that different components of MMS-4D showed curative effects against insomnia by regulating different targets and pathways. Among these ingredients, tetrahydroberberineCitation17 and boldineCitation18 could be used to treat insomnia, thereby confirming the therapeutic value of MMS-4D for this disease.
Gut flora communicates with the brain through a complex two-way communication system (gut–brain axis),Citation19 such as through the immune system, tryptophan metabolism, vagus nerve, and intestinal nervous system.Citation20 Although the exact pathogenesis of insomnia is unclear, fragmentation and short duration of sleep are related to gut flora imbalance.Citation21 The brain-gut microbiota axis enables disturbed sleep patterns to affect the diversity, composition, and functionality of intestinal microorganisms.Citation22 In this study, the gut flora abundance changed substantially after intraperitoneal administration of CUMS in combination with PCPA. There was an increase in Actinobacteriota at the phylum level, while the number of Cyanobacteria was reduced. It has been found that the abundance of Actinobacteriota is linked to insomnia,Citation8 depression,Citation23 and cancer progression in patients with liver cancer,Citation24 while Cyanobacteria can produce cyanobacterium toxin, which is related to degenerative disease.Citation25 After the treatment with estazolam and MMS-4D, these changes in flora abundance were reversed to varying degrees. At the genus level, the abundance of Coriobacteriaceae_UCG-002, Dubosiella, Bifidobacterium, Prevotellaceae_NK3B31_group, and Anaerostipes increased. After the treatment with estazolam and MMS-4D, the abundance of these flora decreased, suggesting that these florae might be biomarkers of insomnia.
The serum metabolomics results in this experiment showed that MMS-4D can not only regulate the membrane transport pathways such as Taurine, L-Glutamine mediated ABC transporters, amino acid metabolism such as L-Tryptophan, Serotonin mediated tryptophan metabolism and Sarcosine, L-Tryptophan mediated glycine, serine and threonine metabolism pathways in insomnia model rats, but also regulate metabolism of the digestive system such as L-Tryptophan, L-Glutamine mediated Protein digestion and absorption, Deoxycholic acid, Cholic acid, Serotonin mediated Bile secretion, and L-Tryptophan, L-Glutamine mediated Mineral absorption. A study shows that the treatment effect of Semen Ziziphi spinosae and Radix Polygalae on insomnia mainly involves pathways such as biosynthesis of valine, leucine, and isoleucine, metabolism of glycine, metabolism of alanine, aspartic acid and glutamic acid, metabolism of phenylalanine, and metabolism of cysteine and methionine.Citation26 MMS-4D not only regulates neural pathways, but also restores the balance in the body of model rats by regulating digestive function related pathways, thereby improving insomnia. And metabolites such as L-Tryptophan, L-Glutamine, and Serotonin seem to play an important role in this process. The correlation analysis between gut microbiota and serum metabolomics also indicates that the key bacterial genera Coriobacteraceae UCG-002, Dubosiella, and Bifidobacterium are positively correlated with bile excretion and affect the metabolism of substances such as Cholic acid. Dubosiella, Bifidobacterium are positively correlated with L-DOPA and negatively correlated with 5-HT, while Anaerostipes are negatively correlated with L-Tryptophan and DL Tryptophan.
Research has shown that Semen Ziziphi spinosae can improve sleep by regulating GABA levels or specifically activating GABAA.Citation27,Citation28 In our research, combining the 16SrDNA detection results with serum metabolomics and NP, we found that tetrahydroberberine, boldine, and other components in MMS-4D could regulate metabolites such as 5-HT, L-DOPA, and Gln in serum, thereby acting on DRD1, DRD2, SLC6A3, and HTR1A; consequently, it reversed the abnormalities of neuroactive light receiver interaction, cAMP signaling pathway, serotonergic, dopaminergic, glutamatergic, GABAergic synapses, and other pathways (). The expression, targets, and pathways involved in these differential metabolites were related to 5-HT, DA, Glu, and GABA. MMS-4D not only has a regulatory effect on GABA as consistent with the above studies, but also specifically regulates pathways such as Serotonergic synapse and Dopaminergic synapse mediated by DA and 5-HT, regulating body balance through multi-component, multi-target, and multi pathway therapy, and treating insomnia.
Figure 6 Schematic of potential signaling pathways regulated by MMS-4D.
5-HT is an important target for treating insomnia in many studies.Citation29 It is a precursor of tryptophan, which has various biological functions and is a crucial gastrointestinal regulating component. Intestinal chromaffin (EC) cells are involved in the production of almost 95% of 5-HT in the body.Citation30 The gut microbiota–brain axis can directly or indirectly modulate sleep behaviour and may participate in the pathogenesis of insomnia.Citation31 Many studies have found that microbial or host-produced compounds interact with the gut flora to regulate host 5-HT secretion in EC cells.Citation32 The current study observed significant alterations in the β-diversity, number, and potential metabolic activities of gut flora in insomnia rat models after treatment with MMS-4D. The differential metabolite 5-HT in the serum of insomnia model rats was substantially elevated, and the content of 5-HT in the hypothalamic and colon tissues significantly increased. MMS-4D contains various active ingredients, including alkaloids, terpenoids, flavonoids, phenols, etc. Alkaloids are widely present in different medicinal plants, and various ingredients, such as berberine,Citation33 can reverse disorders in the gut microbiota;Citation34 thus, they affect the secretion of 5-HT, which is involved in many metabolic pathways, such as nerve active ligand-receptor, cAMP signal pathway, serotonin synapse, and tryptophan metabolism, to affect sleep regulation.
Another key target, dopamine, is thought to be involved in sleep-wakefulness regulation as a substance that promotes arousal.Citation35,Citation36 Gut endocrine peptides can signal dopamine neurons in the brain to regulate dopamine and inhibit sleep arousal.Citation37 Decreased serotonin levels can increase dopaminergic neuron differentiation in rat mesencephalic precursors. On the contrary, serotonin binding to serotonin type 7 and 4 receptors can reduce the production of dopaminergic neurons in midbrain precursors.Citation38 L-DOPA (L-3,4-dihydroxyphenylalanine) is the precursor of dopamine synthesisCitation39 and a symmetrical amino acid, which is produced by the biosynthesis of L-tyrosine in plants and some animals.Citation40 L-DOPA is decarboxylated to DA in cells that express amino acid decarboxylase and other decarboxylase enzymes; it is absorbed by nearly all cell types in the brain.Citation41
Nevertheless, newly formed DA competes with 5-HT in 5-HT neurons; it is encapsulated in exocytosis vesicles via the vesicular monoamine transporter VMAT2.Citation42 Thus, to the detriment of endogenous 5-HT, L-DOPA-induced DA can be enriched in 5-HT vesicles secreted by 5-HT neurons throughout the brain.Citation43 Here, it was found that the differential metabolite L-DOPA, which participates in metabolic pathways such as dopaminergic synapse and retrograde endocannabinoid signaling, was considerably reduced in the serum of rats exposed to MMS-4D. Further, L-DOPA had an impact on the level of DA. ELISA results showed a marked reduction in DA content in hypothalamic tissue after MMS-4D treatment, but the DA content in the colon tissue had no significant changes. Therefore, MMS-4D treatment could reverse the accumulation of L-DOPA in serum and DA in the brain tissue and treat insomnia.
demonstrates that L-glutamine (Gln), in combination with 5-HT and L-DOPA, is crucial for treating insomnia with MMS-4D. Free glutamine is abundant in the body and is the primary substrate of intestinal cells.Citation44 Because of the high activity of glutaminase, the concentration in intestinal tissues is deficient, although the intestine is the main site of Gln consumption.Citation45 The primary excitatory neurotransmitter in the CNS is glutamate (Glu).Citation46 Gln produces Glu by deamidating glutaminase, a precursor of γ-aminobutyric acid (GABA); GABA is a neurotransmitter inhibitor.Citation47
Interestingly, certain flora in the gut can produce GABA that regulates the brain–gut axis response.Citation48 Glu and GABA neurons fully regulate arousal and sleep behaviour, most of which are used to treat insomnia. Sedative and hypnotic drugs also act on GABA.Citation49 Research has confirmed that shorter sleep time and awakening rate are related to lower GABA levels in certain brain regions.Citation50,Citation51 Here, after treatment with MMS-4D, the differential metabolite Gln in the serum of the model animals significantly increased, and Gln participated in metabolic pathways such as glutamorphic synapse and GABAergic synapse and affected the levels of Glu and GABA. The ELISA results indicated that the Glu content in the hypothalamic tissue significantly increased after MMS-4D treatment. However, the Glu content in the colon tissue had no significant changes, while the GABA content in the hypothalamic and colon tissues significantly increased. Therefore, MMS-4D treatment could promote the absorption of Gln in the intestine and further catalyze the production of GABA, thereby promoting sleep.
Although this experiment was based on 16SrDNA, serum metabolomics, and NP to preliminarily elucidate the molecular mechanism of MMS-4D in treating insomnia, some limitations should be noted. Firstly, additional pharmacological investigations are needed for verification. Secondly, in future research, the metabolic changes taking place in other tissues including cerebrospinal and the hippocampus fluid, should be determined to accurately reflect the mechanism of MMS-4D acting on insomnia. In addition, more precise metabolomic techniques, such as targeted metabolomics, are needed to detect metabolic biomarkers purposefully.
Conclusion
This study revealed that MMS-4D can improve the general state and behavioral changes of insomnia model rats, and treat insomnia. Its mechanism may be related to the regulation of various microbial flora such as Coriobacteriaceae UCG-002, Dubosella, Bifidobacterium, Prevotellaceae NK3B31ugroup, and Anaerostipes, as well as metabolites such as 5-HT, L-DOPA, and Gln in the serum. Its tetrahydroberberine, berberine, and other components may act on targets such as DRD1, DRD2, SLC6A3, and HTR1A. Thus reversing the abnormalities of Neuroactive light receptor interaction, cAMP signaling pathway, Serotonergic synapse, Dopaminergic synapse, Glutamatergic synapse, GABAergic synapse, and other pathways mediated by 5-HT, DA, GABA, and Glu. This study laid the groundwork for future clinical applications by providing information and a theoretical foundation for the in-depth investigation of MMS-4D’s action mechanism in the treatment of insomnia.
Highlights
The combination of gut microbiota, serum metabolomics, and network pharmacology was applied.
Biomarkers were associated with the anti-insomnia mechanisms of MMS-4D.
Integrating gut microbiota, serum metabolomics, and network pharmacology is valuable for TCMs.
Author Contributions
All authors made a significant contribution to the work reported, whether that is in the conception, study design, execution, acquisition of data, analysis and interpretation, or in all these areas; took part in drafting, revising or critically reviewing the article; gave final approval of the version to be published; have agreed on the journal to which the article has been submitted; and agree to be accountable for all aspects of the work.
Disclosure
The authors declare that the research was conducted without any commercial or financial relationships that could be construed as a potential conflict of interest.
Acknowledgments
We thank Biotree Biomedical Technology Co., Ltd. (Shanghai, China) for their technical advice regarding our bioinformatic analysis.
Additional information
Funding
References
- Buysse DJ. Insomnia. JAMA. 2013;309(7):706–716. doi:10.1001/jama.2013.193
- Bollu PC, Kaur H. Sleep medicine: insomnia and sleep. Mo Med. 2019;116(1):68–75.
- Krone LB, Fehér KD, Rivero T, Omlin X. Brain stimulation techniques as novel treatment options for insomnia: a systematic review. J Sleep Res. 2023;32(6):e13927. doi:10.1111/jsr.13927
- Praharaj SK, Gupta R, Gaur N. clinical practice guideline on management of sleep disorders in the elderly. Indian J Psychiatry. 2018;60(Suppl 3):S383–S396. doi:10.4103/0019-5545.224477
- Lin YH, Chen C, Zhao X, et al. Efficacy and Safety of banxia formulae for insomnia: a systematic review and meta-analysis of high-quality randomized controlled trials. Evid Based Complement Alternat Med. 2021;2021:8833168. doi:10.1155/2021/8833168
- Shi X, Chen L, Li W, Wang R. Research progress in the prevention and treatment of insomnia with classical prescriptions. Zhong Nan Da Xue Xue Bao Yi Xue Ban. 2023;48(10):1494–1505. doi:10.11817/j.issn.1672-7347.2023.230200
- Bao X, Chen L, Liu Y, et al. Treatment of liver cancer: role of the traditional Mongolian medicine. Evid Based Comp Alternat Med. 2022;2022:6535977. doi:10.1155/2022/6535977
- Yu H, Yu H, Si L, et al. Influence of warm acupuncture on gut microbiota and metabolites in rats with insomnia induced by PCPA. PLoS One. 2022;17(4):e0267843. doi:10.1371/journal.pone.0267843
- Ri X. Discussion on professor rongzabusu’s academic thought on treating insomnia in Mongolian medicine. China Mongolian Med. 2016;11(8):8–12.
- Bo A, Si L, Wang Y, et al. Clinical trial research on Mongolian medical warm acupuncture in treating insomnia. Evid Based Complement Alternat Med. 2016;2016:6190285. doi:10.1155/2016/6190285
- Feng W, Yang Z, Liu Y, et al. Gut microbiota: A new target of traditional Chinese medicine for insomnia. Biomed Pharmacother. 2023;160:114344. doi:10.1016/j.biopha.2023.114344
- Oroojzadeh P, Bostanabad SY, Lotfi H. Psychobiotics: The influence of gut microbiota on the gut-brain axis in neurological disorders. J Mol Neurosci. 2022;72(9):1952–1964. doi:10.1007/s12031-022-02053-3
- Pferschy-Wenzig EM, Pausan MR, Ardjomand-Woelkart K, et al. Medicinal plants and their impact on the gut microbiome in mental health: A systematic review. Nutrients. 2022;14(10):2111. doi:10.3390/nu14102111
- Lin L, Yan H, Chen J, et al. Application of metabolomics in viral pneumonia treatment with traditional Chinese medicine. Chin Med. 2019;14:8. doi:10.1186/s13020-019-0229-x
- Huang K, Zhang P, Zhang Z, et al. Traditional Chinese Medicine (TCM) in the treatment of COVID-19 and other viral infections: Efficacies and mechanisms. Pharmacol Ther. 2021;225:107843. doi:10.1016/j.pharmthera.2021.107843
- Jiashuo WU, Fangqing Z, Zhuangzhuang LI, Weiyi J, Yue S. Integration strategy of network pharmacology in traditional Chinese Medicine: A narrative review. J Tradit Chin Med. 2022;42(3):479–486. doi:10.19852/j.cnki.jtcm.20220408.003
- Wu C, Yang K, Liu Q, et al. Tetrahydroberberine blocks ATP-sensitive potassium channels in dopamine neurons acutely-dissociated from rat substantia nigra pars compacta. Neuropharmacology. 2010;59(7–8):567–572. doi:10.1016/j.neuropharm.2010.08.018
- Moezi L, Yahosseini S, Jamshizadeh A, Pirsalami F. Acute boldine treatment induces anti-convulsant effects in mice through its antioxidant activity. Drug Res. 2019;69(4):227–233. doi:10.1055/a-0659-2478
- Kesika P, Suganthy N, Sivamaruthi BS, Chaiyasut C. Role of gut-brain axis, gut microbial composition, and probiotic intervention in Alzheimer’s disease. Life Sci. 2021;264:118627. doi:10.1016/j.lfs.2020.118627
- Cryan JF, O’Riordan KJ, Cowan CSM, et al. The Microbiota-Gut-Brain Axis. Physiol Rev. 2019;99(4):1877–2013. doi:10.1152/physrev.00018.2018
- Matenchuk BA, Mandhane PJ, Kozyrskyj AL. Sleep, circadian rhythm, and gut microbiota. Sleep Med Rev. 2020;53:101340. doi:10.1016/j.smrv.2020.101340
- Han M, Yuan S, Zhang J. The interplay between sleep and gut microbiota. Brain Res Bull. 2022;180:131–146. doi:10.1016/j.brainresbull.2021.12.016
- Zhong Q, Chen JJ, Wang Y, Shao WH, Zhou CJ, Xie P. Differential gut microbiota compositions related with the severity of major depressive disorder. Front Cell Infect Microbiol. 2022;12:907239. doi:10.3389/fcimb.2022.907239
- Huang JH, Wang J, Chai XQ, et al. The intratumoral bacterial metataxonomic signature of hepatocellular carcinoma. Microbiol Spectr. 2022;10(5):e0098322. doi:10.1128/spectrum.00983-22
- Sini P, Dang TBC, Fais M, et al. Cyanobacteria, cyanotoxins, and neurodegenerative diseases: dangerous liaisons. Int J Mol Sci. 2021;22(16):8726. doi:10.3390/ijms22168726
- Luo H, Sun SJ, Wang Y, Wang YL. Revealing the sedative-hypnotic effect of the extracts of herb pair Semen Ziziphi spinosae and Radix Polygalae and related mechanisms through experiments and metabolomics approach. BMC Complement Med Ther. 2020;20(1):206. doi:10.1186/s12906-020-03000-8
- Xiao F, Shao S, Zhang H, et al. Neuroprotective effect of Ziziphi Spinosae Semen on rats with p-chlorophenylalanine-induced insomnia via activation of GABAA receptor. Front Pharmacol. 2022;13:965308. doi:10.3389/fphar.2022.965308
- Ren A, Wu T, Wang Y, et al. Integrating animal experiments, mass spectrometry and network-based approach to reveal the sleep-improving effects of Ziziphi Spinosae Semen and γ-aminobutyric acid mixture. Chin Med. 2023;18(1):99. doi:10.1186/s13020-023-00814-9
- Singh D, Singh P, Srivastava P, Kakkar D, Pathak M, Tiwari AK. Development and challenges in the discovery of 5-HT1A and 5-HT7 receptor ligands. Bioorg Chem. 2023;131:106254. doi:10.1016/j.bioorg.2022.106254
- Liu N, Sun S, Wang P, Sun Y, Hu Q, Wang X. The mechanism of secretion and metabolism of gut-derived 5-Hydroxytryptamine. Int J Mol Sci. 2021;22(15):7931. doi:10.3390/ijms22157931
- Wang Z, Wang Z, Lu T, et al. The microbiota-gut-brain axis in sleep disorders. Sleep Med Rev. 2022;65:101691. doi:10.1016/j.smrv.2022.101691
- Thursby E, Juge N. Introduction to the human gut microbiota. Biochem J. 2017;474(11):1823–1836. doi:10.1042/BCJ20160510
- Habtemariam S. Berberine pharmacology and the gut microbiota: a hidden therapeutic link. Pharmacol Res. 2020;155:104722. doi:10.1016/j.phrs.2020.104722
- Wang H, Zhang H, Gao Z, Zhang Q, Gu C. The mechanism of berberine alleviating metabolic disorder based on gut microbiome. Front Cell Infect Microbiol. 2022;12:854885. doi:10.3389/fcimb.2022.854885
- Herrera-Solis A, Herrera-Morales W, Nunez-Jaramillo L, Arias-Carrion O. Dopaminergic modulation of sleep-wake states. CNS Neurol Disord Drug Targ. 2017;16(4):380–386. doi:10.2174/1871527316666170320145429
- Yates NJ. Schizophrenia: the role of sleep and circadian rhythms in regulating dopamine and psychosis. Rev Neurosci. 2016;27(7):669–687. doi:10.1515/revneuro-2016-0030
- Titos I, Juginović A, Vaccaro A, et al. A gut-secreted peptide suppresses arousability from sleep. Cell. 2023;186(7):1382–1397.e21. doi:10.1016/j.cell.2023.02.022
- Muñoz A, Lopez-Lopez A, Labandeira CM, Labandeira-Garcia JL. Interactions between the serotonergic and other neurotransmitter systems in the basal ganglia: role in parkinson’s disease and adverse effects of L-DOPA. Front Neuroanat. 2020;14:26. doi:10.3389/fnana.2020.00026
- Hornykiewicz O. L-Dopa. J Parkinsons Dis. 2017;7(s1):S3–S10. doi:10.3233/JPD-179004
- Giuri D, Ravarino P, Tomasini C. L-Dopa in small peptides: an amazing functionality to form supramolecular materials. Org Biomol Chem. 2021;19(21):4622–4636. doi:10.1039/d1ob00378j
- Deurwaerdère P D, Di Giovanni G, Millan MJ. Expanding the repertoire of L-DOPA’s actions: a comprehensive review of its functional neurochemistry. Prog Neurobiol. 2017;151:57–100. doi:10.1016/j.pneurobio.2016.07.002
- Lohoff FW. Genetic variants in the vesicular monoamine transporter 1 (VMAT1/SLC18A1) and neuropsychiatric disorders. Methods Mol Biol. 2010;637:165–180. doi:10.1007/978-1-60761-700-6_9
- Miguelez C, Benazzouz A, Ugedo L, Deurwaerdère P D. Impairment of serotonergic transmission by the antiparkinsonian drug l-dopa: mechanisms and clinical implications. Front Cell Neurosci. 2017;11:274. doi:10.3389/fncel.2017.00274
- Kim MH, Kim H. The Roles of Glutamine in the Intestine and Its Implication in Intestinal Diseases. Int J Mol Sci. 2017;18(5):1051. doi:10.3390/ijms18051051
- Cruzat V, Macedo Rogero M, Noel Keane K, Curi R, Newsholme P. Glutamine: Metabolism and immune function, supplementation and clinical translation. Nutrients. 2018;10(11):1564. doi:10.3390/nu10111564
- Iovino L, Tremblay ME, Civiero L. Glutamate-induced excitotoxicity in Parkinson’s disease: the role of glial cells. J Pharmacol Sci. 2020;144(3):151–164. doi:10.1016/j.jphs.2020.07.011
- Ramadan S, Lin A, Stanwell P. Glutamate and glutamine: a review of in vivo MRS in the human brain. NMR Biomed. 2013;26(12):1630–1646. doi:10.1002/nbm.3045
- Duranti S, Ruiz L, Lugli GA, et al. Bifidobacterium adolescentis as a key member of the human gut microbiota in the production of GABA. Sci Rep. 2020;10(1):14112. doi:10.1038/s41598-020-70986-z
- Jones BE. Arousal and sleep circuits. Neuropsychopharmacology. 2020;45(1):6–20. doi:10.1038/s41386-019-0444-2
- Park S, Kang I, Edden RAE, Namgung E, Kim J, Kim J. Shorter sleep duration is associated with lower GABA levels in the anterior cingulate cortex. Sleep Med. 2020;71:1–7. doi:10.1016/j.sleep.2020.02.018
- SiSi L, Yuan F, LuFeng H, ChongLiang L, Ren Y, ZhengZhong Y. Jiaotaiwan increased GABA level in brain and serum, improved sleep via increasing NREM sleep and REM sleep, and its component identification. J Ethnopharmacol. 2022;285:114866. doi:10.1016/j.jep.2021.114866