
Abstract
Plumbagin (PLB) has exhibited a potent anticancer effect in preclinical studies, but the molecular interactome remains elusive. This study aimed to compare the quantitative proteomic responses to PLB treatment in human prostate cancer PC-3 and DU145 cells using the approach of stable-isotope labeling by amino acids in cell culture (SILAC). The data were finally validated using Western blot assay. First, the bioinformatic analysis predicted that PLB could interact with 78 proteins that were involved in cell proliferation and apoptosis, immunity, and signal transduction. Our quantitative proteomic study using SILAC revealed that there were at least 1,225 and 267 proteins interacting with PLB and there were 341 and 107 signaling pathways and cellular functions potentially regulated by PLB in PC-3 and DU145 cells, respectively. These proteins and pathways played a critical role in the regulation of cell cycle, apoptosis, autophagy, epithelial to mesenchymal transition (EMT), and reactive oxygen species generation. The proteomic study showed substantial differences in response to PLB treatment between PC-3 and DU145 cells. PLB treatment significantly modulated the expression of critical proteins that regulate cell cycle, apoptosis, and EMT signaling pathways in PC-3 cells but not in DU145 cells. Consistently, our Western blotting analysis validated the bioinformatic and proteomic data and confirmed the modulating effects of PLB on important proteins that regulated cell cycle, apoptosis, autophagy, and EMT in PC-3 and DU145 cells. The data from the Western blot assay could not display significant differences between PC-3 and DU145 cells. These findings indicate that PLB elicits different proteomic responses in PC-3 and DU145 cells involving proteins and pathways that regulate cell cycle, apoptosis, autophagy, reactive oxygen species production, and antioxidation/oxidation homeostasis. This is the first systematic study with integrated computational, proteomic, and functional analyses revealing the networks of signaling pathways and differential proteomic responses to PLB treatment in prostate cancer cells. Quantitative proteomic analysis using SILAC represents an efficient and highly sensitive approach to identify the target networks of anticancer drugs like PLB, and the data may be used to discriminate the molecular and clinical subtypes, and to identify new therapeutic targets and biomarkers, for prostate cancer. Further studies are warranted to explore the potential of quantitative proteomic analysis in the identification of new targets and biomarkers for prostate cancer.
Keywords:
Introduction
Prostate cancer is the second most common cancer in men worldwide, after lung cancer.Citation1 There were over 903,500 new prostate cancer cases reported worldwide and an estimated 258,400 men died from this disease in 2008.Citation2 The incidence of prostate cancer varies significantly among different countries and ethnic groups. It is quite frequently diagnosed in North America and Europe but is rare in Asians.Citation3–Citation5 The age-standardized incidence rate of prostate cancer in the People’s Republic of China was 4.3 per 10Citation5, but it is 83.8 per 10Citation5 in the US.Citation3,Citation4 In the US, 196,038 men were diagnosed with prostate cancer, and 28,560 American men died from this disease in 2010.Citation6,Citation7 In the United Kingdom, 40,975 men were diagnosed with prostate cancer in 2010, and 10,793 men died from this disease in 2011.Citation8 Although the 10-year survival rate for early prostate cancer was over 98% in the US, many patients were diagnosed with locally advanced or metastatic forms of prostate cancer in clinic.Citation9,Citation10 This will substantially and negatively affect the therapeutic outcomes. Current prostate cancer therapy includes surgery, radiation, hormone therapy, and chemotherapy.Citation11 Androgen-deprivation therapy with antiandrogens remains the main treatment for later-stage prostate cancer, and it can effectively suppress prostate cancer growth during the first 12−24 months.Citation12,Citation13 However, androgen-deprivation therapy eventually fails and tumors may relapse, despite the absence of androgenic stimulation, and progress into the castration resistant (ie, hormone-refractory) stage, which accounts for the unappreciated failure of current therapies and the increase in prostate cancer mortality.Citation12 On the other hand, chemotherapy usually brings drug resistance and severe adverse reactions in patients. Therefore, new anticancer drugs that can prevent the progression of prostate cancer and can execute prostate cancer cells with improved efficacy and reduced side effects are certainly and urgently needed.
Numerous abnormal biological events at cellular and sub-cellular levels occur in the process of prostate cancer initiation, development, progression, and relocation with the involvement of cell survival, cell death, cell invasion, activation of oncogenes, loss of tumor suppressor genes, and dysregulation of related signaling pathways.Citation14–Citation17 Comprehensively and globally exploring the molecule targets and underlying mechanisms will help identify new therapies for the treatment of prostate cancer.Citation14,Citation18,Citation19 Recently, targeting programmed cell death and other important pathways has become a promising approach to treat prostate cancer through regulating cancer cell apoptosis and autophagy. On the other hand, emerging evidence suggests that the epithelial–mesenchymal transition (EMT) process is activated during prostate cancer development, growth, progression, and metastasis.Citation20,Citation21 It has been proposed that EMT is coopted by prostate cancer cells during their metastatic dissemination from a primary organ to secondary sitesCitation22 and, thus, intervention of this process may represent a novel strategy to prevent prostate cancer metastasis. Moreover, it has been reported that sirtuin (Sirt) 1, a class III nicotinamide adenine dinucleotide (NAD+)-dependent histone deacetylase, induces EMT by cooperating with EMT transcription factors and enhances prostate cancer cell migration and metastasis through deacetylation of its target proteins and modulation of EMT;Citation23 thus, Sirt1 may represent a new therapeutic target for prostate cancer therapy.
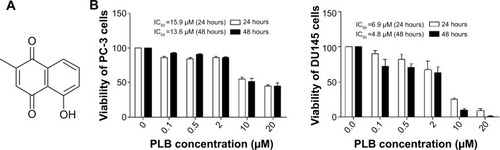
Plumbagin ([PLB] 5-hydroxy-2-methyl-1,4-naphthoquinone, ), an active naphthoquinone compound, possesses a wide spectrum of pharmacological activities, including anti-inflammatory, neuroprotective, anticancer, hypolipidemic, antiatherosclerotic, antibacterial, and antifungal activities in in vitro and in vivo models.Citation24 Recently, increasing attention has been drawn to its anticancer effect. It has been proposed that the anticancer effect of PLB is mainly ascribed to induction of intracellular reactive oxygen species (ROS) generation, apoptosis and autophagy, and cell cycle arrest.Citation24 In vitro and in vivo studies by our laboratory and other groups have showed that PLB induced cancer cell apoptosis and autophagy via modulation of cellular redox status, inhibition of NF-κB activation, upregulation of p53 via c-JNK phosphorylation, and inhibition of phosphatidylinositide 3-kinase (PI3K)/Akt/mTOR pathway.Citation25–Citation31 Several previous studies also found that ROS-mediated apoptotic pathways contributed to the anticancer effect of PLB in tumor-bearing nude mice.Citation32–Citation34 Although the characterization and identification of individual targets and related signaling pathways provided important evidence for the mechanism of actions of PLB in tumor cell killing in vitro and in vivo, the comprehensive and global understanding on the beneficial effect of PLB is lacking and the molecular interactome of PLB is unknown. Stable-isotope labeling by amino acids in cell culture (SILAC) is a practical and powerful approach to uncover the global proteomic responses to drug treatment and other interventions.Citation35 In particular, it can be used to systemically and quantitatively assess the target network of drugs, evaluate drug toxicity, and identify new biomarkers for the diagnosis and treatment of important diseases such as cancer and Alzheimer’s disease.Citation35–Citation37 In this regard, we investigated the molecular targets of PLB in prostate cancer PC-3 and DU145 cells using a combination of bioinformatic, proteomic, and functional approaches with a focus on whether there were differences in the proteomic response between the two cell lines with regard to cell cycle, apoptosis, autophagy, and EMT pathways.
Figure 1 Chemical structure of PLB (5-hydroxy-2-methyl-1,4-naphthoquinone) and effect of PLB on cell viability in PC-3 and DU145 cells.
Abbreviation: IC50, half maximal inhibitory concentration; PLB, plumbagin; SD, standard deviation.
Materials and methods
Prediction of the interactome of PLB and pathway analysis by molecular docking and bioinformatic approach
Protein targets were obtained from a third-party protein structure database named PDBBind.Citation38 In this database, every ligand binding pocket is examined manually and hydrogen is added using Sybyl. According to the developer of PDBBind, the missing atoms were fixed and the amino acids residues with alternate location indicators were refined. There are a total of 1,780 Protein Data Bank (PDB) entries of human proteins available in PDBBind, and a total of 301 nonredundant PDBs corresponding to 353 ligand binding pockets were identified from it, 86% of which have resolutions of less than 2.5 Å. The docking boxes for each of the pockets were defined by expanding the circumscribed cube of the pocket with a margin of 8 Å in six directions (up, down, front, back, left, and right).
The 2D structure of the PLB was downloaded from PubChem. The hydrogen and Gasteiger charge were added and the file format was transformed into Mol2 using Vega ZZ. The docking program AutoDock 4.2 was used to dock the PLB molecule into all 353 pockets, generating a score vector of 353 dimensions. Z-scores were then calculated using the methodologies we applied before.Citation39–Citation41 Here, an empirical threshold of −0.6 of the Z-score was set to indicate that the binding of PLB towards this target was likely to be true.
The Database for Annotation, Visualization and Integrated Discovery (DAVID)Citation42 was used to provide biological functional interpretation of the potential targets of PLB derived from molecular docking calculations. UniProtKB protein IDs of these targets were converted into gene lists by using the gene accession conversion tool in the DAVID database. The DAVID database adds biological function annotation (including gene ontology, pathway, and disease association) derived from some public data sources such as Gene Ontology terms (GOTERMS) or Kyoto Encyclopedia of Genes and Genomes (KEGG) pathways. Enrichment scores and Fisher’s exact test P-values (and corresponding false discovery rate [FDR]) were then calculated to identify which functional-related gene groups are significantly enriched in the target list. These significant enriched gene groups could explain the mechanism of action of PLB systematically.
Chemicals and reagents
Fetal bovine serum, PLB, dimethyl sulfoxide (DMSO), apocynin (Apo, 4′-hydroxy-3′-methoxyacetophenone, an inhibitor of nicotinamide adenine dinucleotide phosphate [NADPH] oxidase), thiazolyl blue tetrazolium bromide (MTT), Dulbecco’s phosphate buffered saline (PBS), 13C6-L-lysine, L-lysine, 13C6 15N4-L-arginine, and L-arginine were purchased from Sigma-Aldrich Co. (St Louis, MO, USA). Dulbecco’s Modified Eagle’s Medium and RPMI-1640 medium were bought from Coring Cellgro Inc. (Herndon, VA, USA). Sirtinol ([STL] a specific Sirt1 and Sirt2 inhibitor, (E)-2-((2-hydroxynaphthalen-1-yl)methyleneamino)-N-(1-phenylethyl)benzamide) was obtained from BioVision Inc. (Milpitas, CA, USA). Western blot substrate was purchased from Thermo Fisher Scientific (Waltham, MA, USA). The polyvinylidene difluoride membrane was bought from EMD Millipore (Billerica, MA, USA). Primary antibodies against human p21 Waf1/Cip1, p27 Kip1, p53, cyclin B1, cyclin D1, cyclin-dependent kinase 1 (CDK1/CDC2/CDKN1), cyclin-dependent kinase 2 (CDK2/CDKN2), cytochrome c, p38 mitogen-activated protein kinase (p38 MAPK), phosphorylated (p-) p38 MAPK at Thr180/Tyr182, AMPK, p-AMPK at Thr172, protein kinase B (Akt), p-Akt at Ser473, mTOR, p-mTOR at Ser2448, PI3K, p-PI3K/p85 at Tyr458, and EMT antibody sampler kit (No #9782) were all purchased from Cell Signaling Technology Inc. (Beverly, MA, USA). The EMT antibody sampler kit contains primary antibodies to N-cadherin, E-cadherin, zona occludens protein-1 (ZO-1), vimentin, slug, snail, zinc finger E-box-binding homeobox 1 (TCF8/ZEB1), and β-catenin. The antibody against human β-actin was obtained from Santa Cruz Biotechnology Inc. (Dallas, TX, USA).
Cell culture and treatment
Two human prostate cancer PC-3 and DU145 cell lines were purchased from the American Type Culture Collection (ATCC) (Manassas, VA, USA) and maintained in RPMI-1640 (PC-3 cells) and Dulbecco’s Modified Eagle’s Medium (DU145 cells) containing L-glutamine, phenol red, L-cysteine, L-methionine, sodium bicarbonate, and sodium pyruvate supplemented with 10% heat-inactivated fetal bovine serum at 37°C in a 5% CO2/95% air humidified incubator. Cells were seeded into the plates for 24 hours to achieve a confluence of ~80% prior to drug treatment. PLB was dissolved in DMSO with a stock concentration of 100 mM, and was freshly diluted to the indicated concentrations with culture medium with 0.05% (v/v) final concentration of DMSO.
Cell viability assay
The effect of PLB on the cell viability of PC-3 and DU145 cells was examined by MTT assay. Briefly, cells were seeded into a 96-well plate at a density of 8,000 cells/well and treated with PLB at 0.1–20 μM for 24 and 48 hours. After the treatment with PLB, the cells were incubated with 10 μL (5 mg/mL) MTT for 4 hours at 37°C. Cell viability was determined by reduction of MTT. The absorbance was measured using a Synergy H4 Hybrid microplate reader (BioTek Inc., Winooski, VT, USA) at a wavelength of 450 nm. The half maximal inhibitory concentration values were determined using the relative viability over PLB concentration curve.
Quantitative proteomic study using SILAC
Quantitative proteomic experiments were performed using SILAC as described previously.Citation35,Citation36,Citation43 The protein quantitation kits for acidification, desalting, and digestion were purchased from Thermo Fisher Scientific. Briefly, PC-3 and DU145 cells were cultured in the medium with (heavy) or without (light) stable-isotope labeled amino acids (13C6 L-lysine and 13C6 15N4 L-arginine). PC-3 and DU145 cells were passaged five times by changing medium or splitting cells. Then, cells were treated with 5 μM PLB for 24 hours together with stable isotope-labeled amino acids. Following that, the cell samples were harvested and lysated with hot lysis buffer (100 mM Tris base, 4% sodium dodecyl sulfate (SDS), and 100 mM dithiothreitol). The protein was denatured at 95°C for 5 minutes and sonicated at 20% amplitude (AMPL) for 3 seconds with six pulses. After that, the samples were centrifuged at 15,000× g for 20 minutes and supernatant was collected in clean tubes. The protein concentration was determined using the Ionic Detergent Compatibility Reagent (Thermo Fisher Scientific). Subsequently, equal amounts of heavy and light protein sample were combined to reach a total volume of 30–60 μL containing 300–600 μg protein. The combined protein sample was digested using FASP™ protein digestion kit from Protein Discovery Inc. (Knoxville, TN, USA). After protein was digested, the resultant sample was acidified to a pH of 3 and desalted using a C18 solid-phase extraction column. The peptide mixtures were then analyzed using the hybrid linear ion trap–Orbitrap (LTQ Orbitrap XL; Thermo Fisher Scientific Inc.). The mass analysis of peptides was performed using a 10 cm-long 75 μm (inner diameter) reversed-phase column packed with 5 μm-diameter C18 material with 300 Å pore size (New Objective, Woburn, MA, USA) with a gradient mobile phase of 2%–40% acetonitrile in 0.1% formic acid at 200 μL/min for 125 minutes using liquid chromatography–tandem mass spectrometry (MS). The Orbitrap full MS scanning was performed at a mass (m/z)-resolving power of 60,000, with positive polarity in profile mode (M+H+). Peptide SILAC ratio was calculated using MaxQuant version 1.2.0.13. The SILAC ratio was determined by averaging all peptide SILAC ratios from peptides identified of the same protein. The protein IDs were identified using Scaffold 4.3.2 from Proteome Software Inc. (Portland, OR, USA) and the pathway was analyzed using Ingenuity Pathway Analysis (IPA) from QIAGEN (Redwood City, CA, USA).
Cell cycle distribution analysis
The effect of PLB on cell cycle of PC-3 and DU145 cells was determined using propidium iodide as the DNA stain by flow cytometry as described previously.Citation44 Briefly, PC-3 and DU145 cells were treated with PLB at concentrations of 0.1, 1, 5, and 10 μM for 24 hours. In separate experiments, PC-3 and DU145 cells were treated with 5 μM PLB for 4, 8, 12, 24, 48, and 72 hours. Cells were trypsinized and fixed by 70% ethanol at −20°C overnight. The cells were stained using 50 μg/mL propidium iodide. A total number of 1×10Citation4 cells was subject to cell cycle analysis using a flow cytometer (BD Biosciences, San Jose, CA, USA).
Western blotting analysis
PC-3 and DU145 cells were washed with PBS after 24 hours’ treatment with PLB at indicated concentrations, and lysed with the RIPA buffer containing protease inhibitor and phosphatase inhibitor cocktails. Protein concentrations were measured by bicinchoninic acid assay and denatured for 5 minutes at 95°C. A quota of protein (20 μg) was electrophoresed on 7%−12% sodium dodecyl sulfate polyacrylamide gel electrophoresis mini-gel and transferred onto methanol activated polyvinylidene difluoride membrane at 100 V for 2 hours at 4°C. Membranes were probed with indicated primary antibody overnight at 4°C and then blotted with the respective secondary antibody. Visualization was performed using BioRad system (Bio-Rad Laboratories Inc., Hercules, CA, USA). Protein level was normalized to the matching densitometric value of internal control.
Measurement of intracellular ROS levels
CM-H2DCFDA was used to measure intracellular levels of ROS according to the manufacturer’s instruction. Briefly, cells were seeded into 96-well plate (1×10Citation4 cells/well) and treated with PLB at 0.1, 1, and 5 μM for 24 hours. Following that, the cells were incubated with 5 μM CM-H2DCFDA in PBS for 30 minutes at 37°C. In separate experiments, the intracellular ROS level was measured when cells were exposed to 5 μM PLB over 72 hours. Additionally, cells were pretreated with Apo (0.1 μM) for 1 hour with addition of 5 μM PLB followed by further incubation for 24 hours. The fluorescence intensity was detected at wavelengths of 485 nm (excitation) and 530 nm (emission).
Statistical analysis
Data are expressed as the mean ± standard deviation. Multiple comparisons were evaluated by one-way analysis of variance followed by Tukey’s multiple comparison. A value of P<0.05 was considered statistically significant.
Results
PLB likely interacts with a number of important functional proteins
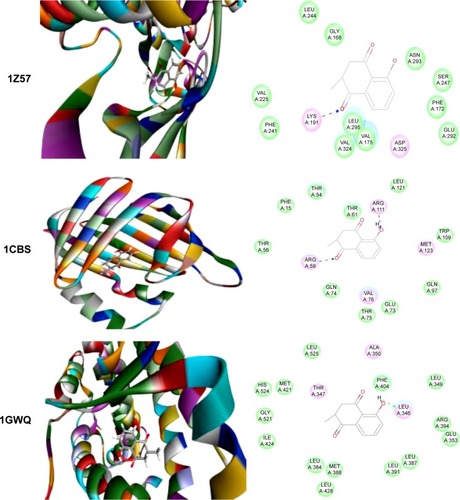
Using Vega ZZ and AutoDock 4.2 programs, we examined the interactome of PLB. There were 78 proteins that possibly interacted with PLB, including those involved in cell proliferation and apoptosis (eg, SRC, JAK2, Akt, BRAF, CDKN2A, CLK1, AURKA, and MAPK1); nucleic acid biosynthesis and metabolism (eg, GATM, MGMT, ALDH1L1, DHFR, DHODH, TYMP, TPH1, and NNMT); carbohydrate metabolism (eg, GLA, GALE, PYGL, and PYGM); amino acid and protein metabolism (eg, ASS1, BCAT2, SDS, and METAP1); phospholipid and lipid metabolism (eg, PLA2G2A and PPARA); inflammation and immune response (eg, TNFA, MASP2, and MIF); steroid metabolism and transport (AKR1C1, 1C2 and 1C3, and SHBG); blood coagulation (eg, PROCR and F9); and signal transduction (eg, ESR1, GR, PGR, and JAK2) (see –; ). The Z’-score values were −2.478, −2.276, −2.150, −2.084, and −2.081 for activated CD42 kinase 1, integrin-α-L, Janus kinase-2 (JAK2), tyrosyl-tRNA synthetase (YARS), and tryptophan 5-hydroxylase 1 (TPH1), respectively. PLB appeared to interact with several functional protein families or subfamilies, such as the nuclear receptors (AR, GR, PGR, RARA, RARB, RARG, RXRA, RXRB, PPARA, THRB, ESR1, and ESR2), AKRs (1C1, 1C2, and 1C3), ALDHs (5 and 7), and oncoproteins and kinases (ABL, AKT, BRAF, CDKN2A, CLK1, CSNK2A1, JAK2, PAK1, MAPK1, SRC, AURKA, RPS6KA1, and MAPKAPK2). The interaction between PLB and selected targets included H-bond formation, charge interaction, and π-π stacking with the involvement of a number of critical amino acid residues in the active site of targets ().
Table 1 Predicted protein targets of PLB
Table 2 Molecular interactions of PLB with selected potential target proteins
Figure 2 Molecular interactions between PLB and selected predicted targets.
Abbreviations: ABL1, c-Abl oncogene 1; ACPP, prostate acid phosphatase; ADH7, alcohol dehydrogenase 5; AKR1C1, aldo–keto reductase family 1, member C1; PDB, Protein Data Bank; PLB, plumbagin.
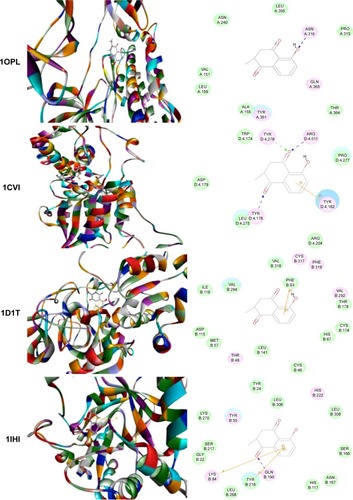
Figure 3 Molecular interactions between PLB and selected predicted targets.
Abbreviations: AKR1C3, aldo–keto reductase family 1, member C3; ALDH1L1, aldehyde dehydrogenase 1 family, member L1; ASS1, argininosuccinate synthase 1; AURKA, aurora kinase A; PDB, Protein Data Bank; PLB, plumbagin.
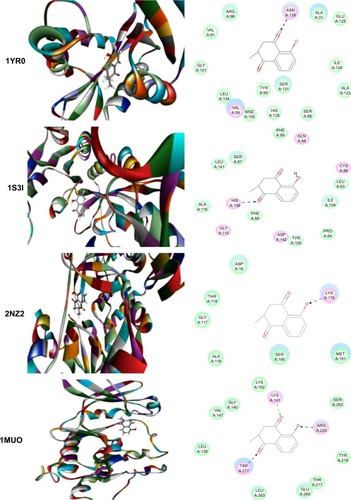
Figure 4 Molecular interactions between PLB and selected predicted targets.
Abbreviations: BCAT2, mitochondrial branched-chain amino-acid transaminase 2; CA4, carbonic anhydrase IV; CDKN2A, cyclin-dependent kinase inhibitor 2A; PDB, Protein Data Bank; PLB, plumbagin.
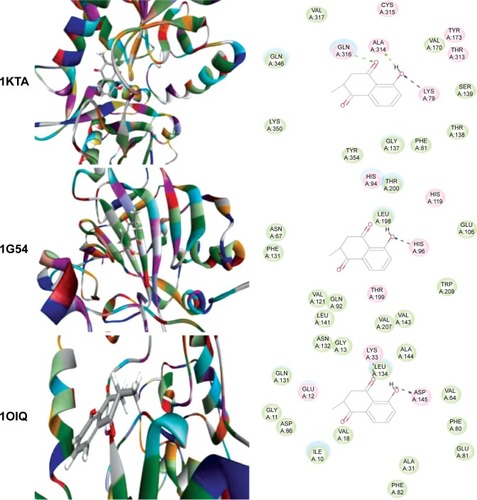
Figure 5 Molecular interactions between PLB and selected predicted targets.
Abbreviations: CLK1, CDC-like kinase 1; CRABP2, cellular retinoic acid binding protein 2; ESR1/NR3A1, estrogen receptor-α; PDB, Protein Data Bank; PLB, plumbagin.
As shown in , ten functional clusters were identified to be significantly enriched (enrichment score >3) in the target list derived from molecular docking calculations. The cluster 2 is NADPH oxidation and reduction. It has been proved that PLB could bind to Nox-4, a renal NADPH oxidase, and inhibit its activity. Cluster 6, the regulation of apoptosis, indicates that PLB could inhibit cell growth by inducing cell apoptosis.
Table 3 The top enriched clusters (Enrich score >3) by the DAVID database for the target list of PLB derived from molecular docking calculations
As shown in , ten KEGG pathways significantly enriched (FDR <0.1) in the target list were discovered. The first significant pathway reported by DAVID database is “Metabolism of xenobiotics by cytochrome P450” (the enrichment fold is 7.48 and FDR =0.012). Six proteins, AKR1C1, AKR1C2, AKR1C3, ADH5, ADH7, and GSTM4, were included in this pathway.
Table 4 The top enriched KEGG pathways (FDR <0.1) by the DAVID database for the target list of PLB derived from molecular docking calculations
KEGG pathway analysis and the enriched gene cluster 8 (glucose metabolism) also suggested the antidiabetic effect of PLB. Seven drug targets in the insulin signaling pathway, MAP3K1, AKT1, BRAF, PYGM, GSK3B, MAPK10, and PYGL, showed high binding affinities with PLB. It agrees well with previous observations that PLB could significantly reduce the blood glucose and restore plasma insulin levels in diabetic rat models.Citation45 Actually, PLB is isolated from the roots of Philodendron scandens and that herb is widely used to treat type II diabetes in Asia. Importantly, five of the top enriched KEGG pathways were associated with cancer. These include ErbB/EGFR/HER signaling, VEGF signaling, MAPK signaling, and colorectal cancer and prostate cancer pathways. This provides a basis for our following bench-marking experiments where PLB would be used to kill prostate cancer cells.
Our proteomic study reveals that PLB regulates a large number of functional proteins
Overview of proteomic response to PLB treatment in PC-3 and DU145 cells
To verify the above bioinformatic data, we further carried out proteomic experiments to evaluate and compare the interactome of PLB in PC-3 and DU145 cells treated with PLB at 5 μM. There were 1,225 and 267 protein molecules identified as the potential targets of PLB in PC-3 and DU145 cells ( and ), respectively. These included a number of molecules involved in cell proliferation, cell metabolism, cell migration, cell invasion, cell survival, and cell death, such as CDK1/CDC2, MAPK, mTOR, PI3K, Akt, and E-cadherin. PLB increased the expression level of 533 protein molecules, but decreased the expression level of 682 protein molecules in PC-3 cells (). In DU145 cells, PLB enhanced the expression of 73 protein molecules, but suppressed the expression of 193 protein molecules (). Subsequently, these proteins were subject to IPA pathway analysis. As shown in and and and , 341 and 107 signaling pathways and cellular functions were potentially regulated by PLB in PC-3 and DU145 cells, respectively.
Table 5 Potential molecular targets, signaling pathways, and cellular functions regulated by PLB in PC-3 cells
Table 6 Potential molecular targets, signaling pathways, and cellular functions regulated by PLB in DU145 cells
Figure 6 Proteomic analysis revealed molecular interactome regulated by PLB in PC-3 cells.
Abbreviation: PLB, plumbagin.

Figure 7 Proteomic analysis revealed molecular interactome regulated by PLB in DU145 cells.
Abbreviation: PLB, plumbagin.
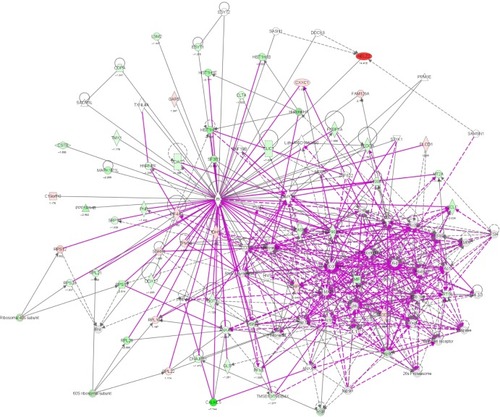
Figure 8 Proteomic analysis revealed a network of signaling pathways regulated by PLB in PC-3 cells.
Abbreviations: IPA, Ingenuity Pathway Analysis; PLB, plumbagin; TCA, tricarboxylic acid cycle.
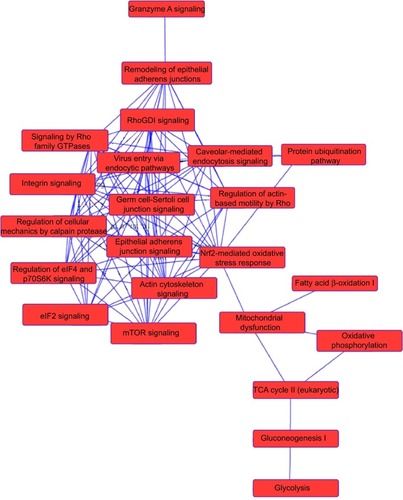
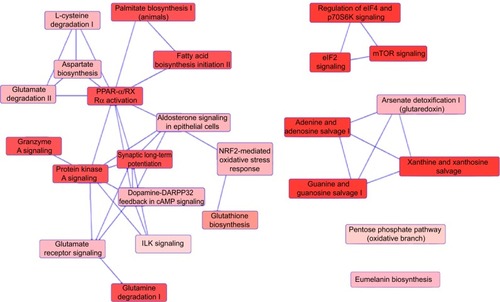
Figure 9 Proteomic analysis revealed networks of signaling pathways regulated by PLB in DU145 cells.
Abbreviations: cAMP, cyclic adenosine monophosphate; IPA, Ingenuity Pathway Analysis; PLB, plumbagin.
PLB regulates cell cycle regulators of PC-3 cells
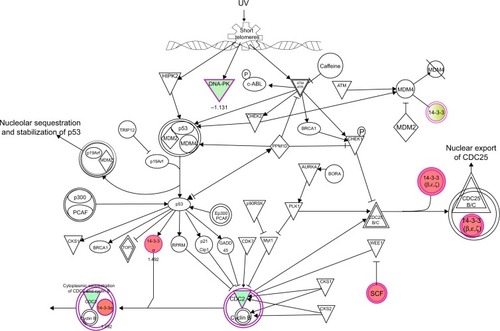
It has been reported that PLB-induced cell cycle arrest is an important contributor to PLB’s anticancer effect.Citation30,Citation46 We treated PC-3 and DU145 cells with 5 μM PLB for 24 hours and then cell samples were subject to quantitative proteomic analysis. The results showed that PLB regulated cell cycle at G1/S and G2/M DNA damage checkpoints in PC-3 cells with the involvement of a number of functional proteins (). These included RPL11, RPL5, HDAC2, PA2G4, GNL3, and SKP1 at G1/S checkpoint and YWHAQ, PRKDC, YWHAG, YWHAE, YWHAH, YWHAB, YWHAZ, SFN, SKP1, and CDK1 at G2/M checkpoint (). However, the proteomic analysis did not reveal any remarkable effect of PLB on proteins that regulate cell cycle in DU145 cells.
Figure 10 PLB regulates cell cycle at G2/M checkpoint in PC-3 cells.
Abbreviations: PLB, plumbagin; UV, ultraviolet.
PLB regulates apoptosis and autophagy in PC-3 and DU145 cells
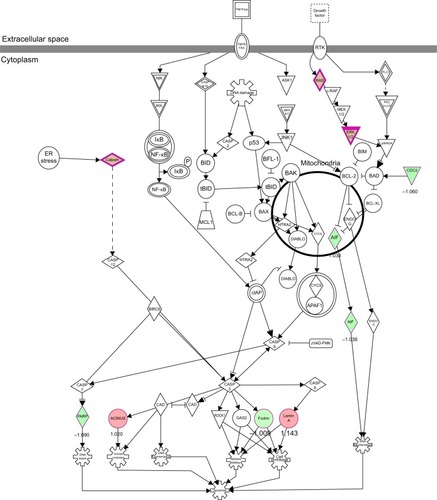
Apoptosis and autophagy are two predominant programmed cell death pathways and they have been considered to be promising targets for the treatment of cancer via regulating mitochondria-dependent, mitochondria-independent, or PI3K/Akt/mTOR-mediated pathways.Citation47–Citation51 As shown in and , PLB regulated apoptotic signaling pathway and mitochondrial function involving a number of functional proteins. These included ACIN1, CAPNS1, MAPK1, RRAS, LMNA, CAPN2, SPTAN1, CYCS, CDK1, PARP1, AIFM1, HSD17B10, UQCRH, ATP5D, PRDX5, ATP5L, UQCRB, MT-CO2, ATP5H, VDAC2, PDHA1, NDUFA5, SOD2, PARK7, GPD2, NDUFAB1, CYB5R3, NDUFB6, OGDH, ATP5F1, COX4I1, AIFM1, SDHA, ATP5J, COX7A2, COX6B1, COX17, ATP5O, CPT1A, ATP5A1, VDAC3, NDUFS3, ATP5C1, FIS1, MT-ND1, PRDX3, NDUFB11, ATP5B, NDUFS8, UQCR10, CAT, UQCRC2, CYC1, COX5A, CYCS, VDAC1, UQCRC1, and COX5B. Notably, the proteomic analysis revealed a regulatory effect of PLB on apoptotic signaling pathways in PC-3 cells () but not in DU145 cells.
Figure 11 PLB regulates apoptosis signaling pathway in PC-3 cells.
Abbreviation: PLB, plumbagin.
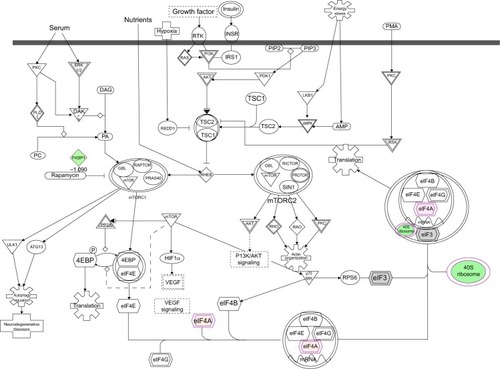
Moreover, Akt/mTOR signaling pathway plays a central role in the regulation of cell metabolism, growth, proliferation, and survival through the integration of both intracellular and extracellular signals.Citation52 mTOR complex 1 and 2 are two distinct complexes in mTOR signaling pathway that transduce a variety of signals to downstream targets, including Akt, p70S6K, Atgs, eIF4G, PPAR-α, and PPAR-γ, to modulate cell growth, cell proliferation, energy metabolism, and autophagy.Citation52 Aberrant mTOR signaling pathway has been implicated in the pathogenesis of many diseases including cancer, and targeting mTOR signaling pathway may be a promising strategy for cancer therapy.Citation53 As showed in and , PLB exhibited a capability of modulating mTOR signaling pathway in both cell lines. The results showed that PLB decreased the expression of FKBP1, Rho, Rac, eIF3, eIF4B, and eIF4G, but increased the expression of Erk1/2, Ras, PP2, and eIF4A in PC-3 cells (), whereas there were less targets regulated by PLB in DU145 cells, ie, only FKBP1, eIF4A, and 40S ribosome (). Taken together, the results suggest that the regulatory effects of PLB on apoptosis, mitochondrial function, and mTOR signaling pathway contribute to the cancer cell killing of PLB in PC-3 and DU145 cells.
Figure 12 mTOR signaling pathway regulated by PLB in PC-3 cells.
Abbreviation: PLB, plumbagin.
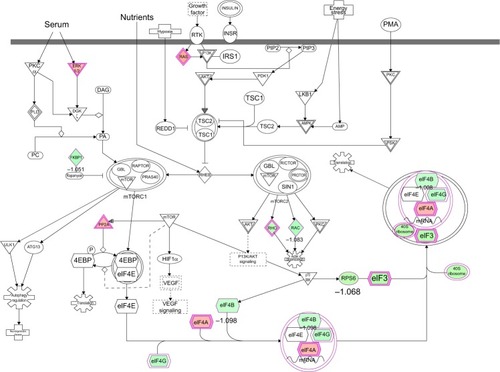
Figure 13 mTOR signaling pathway regulated by PLB in DU145 cells.
Abbreviation: PLB, plumbagin.
PLB regulates EMT pathways in PC-3 cells
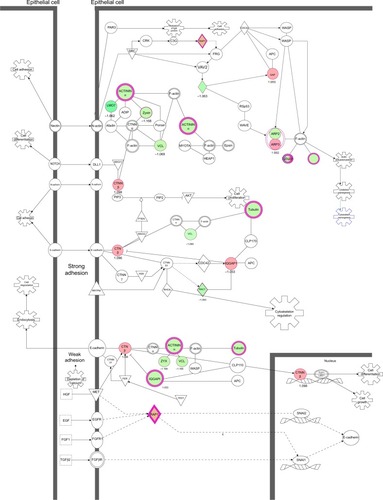
EMT has a close association with cell migration and invasion and it plays an important role in cancer metastasis.Citation21 Suppressing the progress of EMT will be clinically helpful for cancer therapy. We analyzed the effect of PLB on EMT-related proteins and signaling pathways using SILAC-based proteomic approach. The proteomic data showed that PLB regulated epithelial adherent junction signaling pathway in PC-3 cells involving a number of functional proteins. These included RAP1B, MYL6, ARPC1B, ACTA2, IQGAP1, TUBB, CDC42, ACTR3, ARPC3, TUBA1C, VCL, CTNNB1, ACTN1, ACTR2, TUBB3, LMO7, TUBB4B, RRAS, TUBB2A, TUBA4A, RAC1, ACTG1, TUBA1B, TUBA1A, MYH9, ZYX, ACTN4, and ARPC4 (; ); whereas the proteomic analysis did not show remarkable regulatory effect of PLB on EMT-associated proteins and signaling pathways in DU145 cells.
Figure 14 PLB regulates epithelial adherent junction signaling pathway in PC-3 cells.
Abbreviation: PLB, plumbagin.
PLB regulates Sirt1-mediated pathways in PC-3 and DU145 cells
The Sirt family of proteins (Sirt1–7) encode a group of evolutionarily conserved, class III, and NAD+-dependent histone deacetylases involving many critical cellular processes, including cell cycle regulation, cell differentiation, genomic stability, tumorigenesis, oxidative stress response, aging, and energy metabolism through PPAR-, p53-, nuclear factor-κB (NF-κB)-, AMPK-, and mTOR-mediated signaling pathways.Citation54 The proteomic data showed that PLB regulated NAD biosynthesis, phosphorylation, and dephosphorylation with the involvement of ACP1 and nicotinamide phosphoribosyltransferase (NAMPT) in PC-3 cells (). NAMPT, also known as pre-B-cell colony-enhancing factor 1 or visfatin, is a rate-limiting step in the NAD+ biosynthesis salvage pathway, and NAD+ is an essential substrate for Sirt1.Citation55 Moreover, PLB treatment regulated the p53 signaling pathway with the involvement of PRKDC, PCNA, GNL3, SERPINB5, SFN, ST13, and CTNNB1, and modulated NF-κB signaling pathway with the involvement of ITGB1, MAPK1, RRAS, ITGA2, and ITGA6 in PC-3 cells (). Notably, PLB treatment regulated PPAR signaling pathway in both PC-3 and DU145 cells involving a number of protein molecules, such as HSP90B1, IL18, MAPK1, HSP90AB1, RRAS, and HSP90AA1( and ). Taken together, the proteomic data suggest that PLB may exhibit a regulatory effect on Sirt1-mediated signaling pathways in both PC-3 and DU145 cells.
PLB regulates redox homeostasis involving ROS- and Nrf2-mediated signaling pathways in both PC-3 and DU145 cells
Our previous study has shown that induction of ROS generation and modulation of related signaling pathways contribute to the anticancer effects of PLB.Citation30 In this study, we observed that PLB regulated several critical signaling pathways related to ROS generation and redox homeostasis in PC-3 and DU145 cells. Our quantitative proteomic study showed that PLB treatment regulated oxidative phosphorylation, nuclear factor erythroid 2-related factor 2 (Nrf2)-mediated oxidative stress response ( and ), and superoxide radical degradation in PC-3 and DU145 cells ( and ). A number of functional proteins – SOD1/2, GSTK1, GSTP1, MGST1, HSD17B10, DHRS9, AKR1A1, ADH5, ESD, ALDH1A3, 1L1, 3A2, 9A1 – were found to be involved in these pathways as well as 18A1, NQO1, and mitochondria complexes. Notably, Nrf2-mediated signaling pathway plays a critical role in the maintenance of intracellular redox homeostasis in response to various stimuli via regulating antioxidant responsive elements in the target genes.Citation56,Citation57 The proteomic data indicate that modulation of the expression of functional proteins involved in Nrf2-mediated signaling pathway may be an important contributor to the anticancer effect of PLB.
Figure 15 PLB-regulated Nrf2-mediated oxidative stress response in PC-3 cells.
Abbreviations: PLB, plumbagin; UV, ultraviolet.
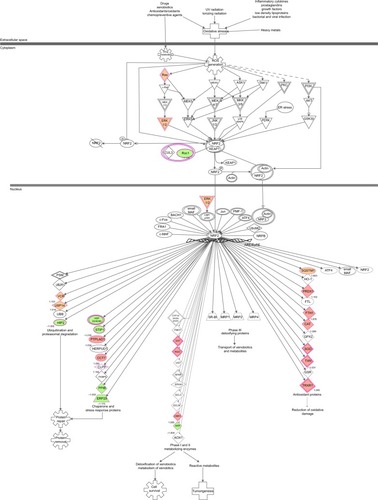
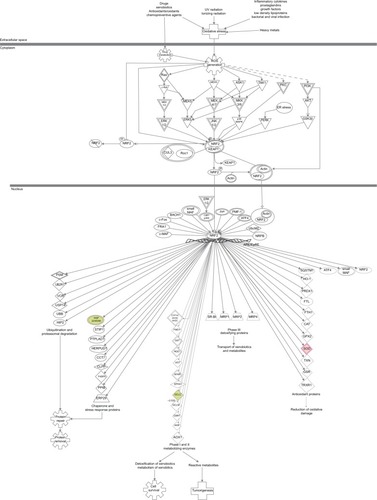
Figure 16 PLB-regulated Nrf2-mediated oxidative stress response in DU145 cells.
Abbreviations: PLB, plumbagin; UV, ultraviolet.
Differential responses to PLB treatment in PC-3 and DU145 cells
There were substantial differences in the response to PLB treatment between PC-3 and DU145 cells. In PC-3 cells, the PLB-regulated network of signaling pathways included granzyme A signaling pathway, remodeling of epithelial adherent junctions, Rho signaling pathway, endocytosis signaling pathway, integrin signaling pathway, protein ubiquitination signaling pathway, EIF4/p70 S6K signaling pathway, Nrf2-mediated signaling pathway, EIF2 signaling pathway, mTOR signaling pathway, mitochondrial dysfunction, fatty acid β-oxidation, tricarboxylic acid cycle, and glycolysis (). These signaling pathways played a critical role in the regulation of cell proliferation, migration, and programmed cell death. In DU145 cells, different network of signaling pathways in response to the PLB treatment was observed. These mainly included palmitate biosynthesis, fatty acid biosynthesis, aspirate biosynthesis, L-cysteine degradation, glutamate degradation, PPAR-α/RXRα activation, protein kinase A signaling pathway, granzyme A signaling pathway, glutamate receptor signaling pathway, Nrf2-mediated signaling pathway, EIF2 signaling pathway, mTOR signaling pathway, and EIF4/p70 S6K signaling pathway. These pathways played important roles in the regulation of cell and energy metabolism, cell growth, cell survival, and programmed cell death.
Moreover, the proteomic data showed differences in the top five signaling pathways in response to PLB treatment in both cell lines ( and ). In PC-3 cells, the top five signaling pathways were EIF2 signaling pathway, EIF4/p70 S6K signaling pathway, mTOR signaling pathway, protein ubiquitination signaling pathway, and mitochondrial dysfunction signaling pathway (). In DU145 cells, the top five signaling pathways were EIF2 signaling pathway, granzyme A signaling pathway, PPAR-α/RXRα signaling pathway, mTOR signaling pathway, and protein kinase A signaling pathway (). mTOR signaling pathway was regulated by PLB in both cell lines, indicating that it may play a central role in the antiproliferative and autophagy-inducing effects of PLB in PC-3 and DU145 cells.
Table 7 Top five canonical pathways regulated by PLB in PC-3 cells
Table 8 Top five canonical pathways regulated by PLB in DU145 cells
Taken together, our proteomic study has revealed that a number of important proteins and their associated signaling pathways are regulated in PC-3 and DU145 cells in response to PLB. These cellular signaling pathways play pivotal roles in the regulation of cell cycle, apoptosis, autophagy, EMT, and oxidative stress with the involvement of a number of critical functional proteins, such as PI3K, mTOR, Akt, MAPK, CDKs, cytochrome c, and E-cadherin.
Verification of molecular targets of PLB in PC-3 and DU145 cells by Western blot assay
Our above bioinformatic and quantitative proteomic studies have predicted and shown that PLB can modulate a number of signaling pathways related to cell proliferation, cell migration, cell death, and cell survival. In the next set of functional validation experiments, in order to further verify the quantitative proteomic data, we tested how PLB affected the cell cycle, apoptosis, autophagy, EMT, and redox homeostasis and the related signaling pathways in PC-3 and DU145 cells.
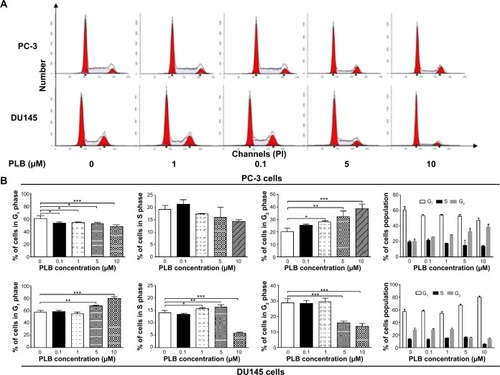
PLB inhibits the proliferation of PC-3 and DU145 cells, and induces G2/M arrest in PC-3 cells and G1 arrest in DU145 cells via regulation of cyclin B1, cyclin D1, CDK1/CDC2, CDK2, p21 Waf1/Cip1, p27 Kip1, and p53
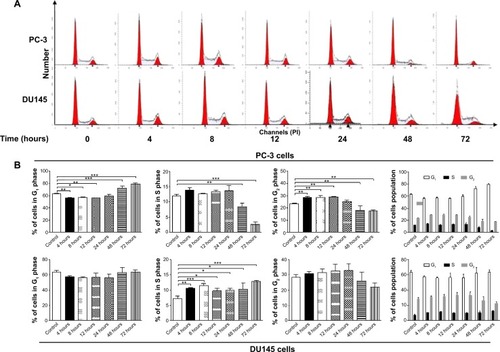
First, we examined the effect of PLB on cell cycle distribution using a flow cytometer in both cell lines. PLB showed differential effects on the cell cycle distribution in PC-3 and DU145 cells (). In PC-3 cells, PLB significantly induced a G2/M phase arrest. Compared with the control cells (20.1%), the percentage of PC-3 cells in G2/M phase was increased in a concentration-dependent manner after PLB treatment (). The percentage was 25.4%, 28.1%, 32.3%, and 38.5% when treated with PLB at 0.1, 1, 5, and 10 μM, respectively. PLB significantly decreased the percentage of PC-3 cells in G1 phase in comparison to the control cells. The basal level of PC-3 cells in G1 phase was 60.9%; after treatment with PLB at 0.1, 1, 5, and 10 μM for 24 hours, the percentage of PC-3 cells in G1 phase was 53.2%, 53.9%, 52.5%, and 47.5%, respectively. However, there was no significant difference observed in the number of cells in S phase in PC-3 cells when treated with PLB ().
Figure 17 PLB inhibits the proliferation of PC-3 and DU145 cells, and induces G2/M arrest in PC-3 cells and G1 arrest in DU145 cells.
Abbreviations: PI, propidium iodide; PLB, plumbagin.
We further conducted separate experiments to evaluate the effect of PLB treatment at 5 μM on cell cycle distribution in PC-3 cells over 72 hours. Compared to the control cells, the percentage of PC-3 cells in G2/M phase was increased from 23.5% at basal level to 28.6%, 28.8%, and 28.9% after 4, 8, and 12 hours treatment with 5 μM PLB and declined to 25.4%, 18.1%, and 17.6% after 24, 48, and 72 hours treatment of PLB, respectively (). While 5 μM PLB treatment decreased the percentage of PC-3 cells in G1 phase from 62.9% at basal level to 55.9%, 57.0%, and 56.0% after 4, 8, and 12 hours treatment and was increased to 59.3%, 72.4%, and 79.4% after 24, 48, and 72 hours drug treatment, respectively (). There was a significant decrease in the percentage of PC-3 cells in S phase after treatment with PLB for 48 and 72 hours.
Figure 18 Inhibitory effect of PLB on the proliferation of PC-3 and DU145 cells over 72 hours.
Abbreviations: PI, propidium iodide; PLB, plumbagin.
PLB exhibited a differential effect on the cell cycle distribution of DU145 cells. PLB significantly induced G1 arrest with an increase in the percentage of DU145 cells in G1 phase (). In comparison to the control cells (57.3%), the percentage of DU145 cells in G1 phase was increased in a concentration-dependent manner. The values were 58.6%, 55.2%, 67.8%, and 80.4% with the PLB treatment at concentrations of 0.1, 1, 5, and 10 μM, respectively. A significant reduction of the number of cells in G2/M phase was also observed after PLB treatment for 24 hours. The percentage was decreased from 28.9% (control) to 13.8% (10 μM PLB). In addition, when DU145 cells were treated with PLB at 1 and 5 μM for 24 hours, we observed a significant increase in the number of the cell population in S phase; however, incubation with 10 μM of PLB reduced the cell population in S phase (14.0% versus 5.9%) (P<0.001; ).
In addition, treatment of DU145 cells with 5 μM PLB for 4, 8, 12, 24, 48, or 72 hours significantly increased the percentage of cells in S phase from 7.3% at basal level to 10.6%, 11.4%, 9.7%, 10.0%, 10.2%, and 12.7%, respectively (). Although there was no significant change in the percentage of DU145 cells in G2/M and G1 phase, there was an 8.8% and 22.9% decrease in the percentage of DU145 cells in G2/M phase observed when the cells were treated with 5 μM PLB for 48 and 72 hours, respectively.
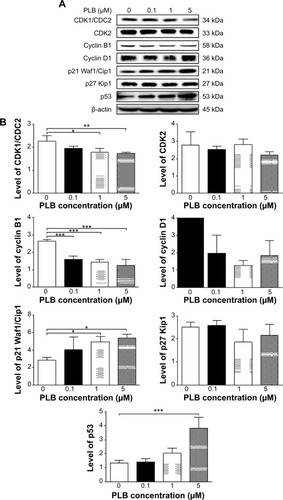
To explore the mechanisms for PLB-induced effects on cell cycle arrest in PC-3 and DU145 cells, the expression levels of key regulators responsible for G1 and G2 checkpoints were examined using Western blot assay. Cyclin B1 and CDK1/CDC2 are two key regulators for G2 to M phase transitionCitation55 and thus their expression levels were determined in PC-3 cells. The expression of cyclin B1 was significantly suppressed in PC-3 cells with the treatment of PLB at concentrations of 0.1, 1, and 5 μM for 24 hours (P<0.001; ). In comparison to the control cells, the expression level of cyclin B1 in PC-3 cells was decreased 2.1-fold when treated with 5 μM PLB for 24 hours. There was a 21.3% and 23.5% reduction in the expression level of CDK1/CDC2 in PC-3 cells incubated with PLB at 1 and 5 μM for 24 hours, respectively (P<0.05 and P<0.01, respectively; ). However, there was no significant change in the expression level of CDK2 and cyclin D1 when PC-3 cells were treated with PLB at 0.1, 1, and 5 μM for 24 hours (P>0.05; ).
Figure 19 PLB regulates the expression of CDK1/CDC2, cyclin B1, CDK2, cyclin D1, p21 Waf1/Cip1, p27 Kip1, and p53 in PC-3 cells.
Abbreviation: PLB, plumbagin.
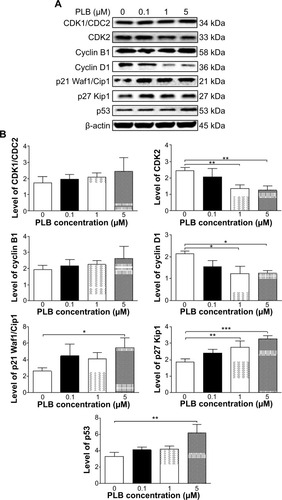
In DU145 cells, the expression levels of key regulators for G1 to S transition including CDK2 and cyclin D1 were determined. A significant inhibitory effect of PLB on the expression of CDK2 and cyclin D1 was observed, which was in a concentration-dependent manner (). Treatment of DU145 cells with PLB at 1 and 5 μM for 24 hours resulted in a 42.1% and 42.0% decrease in the expression of cyclin D1, respectively (P<0.05). A similar inhibitory effect on the expression of CDK2 was also observed (P<0.01; ). A low concentration of PLB (0.1 μM) only slightly decreased the expression of cyclin D1 and CDK2 in DU145 cells. Incubation of DU145 cells with PLB did not significantly alter the expression level of cyclin B1 and CDC2 (P<0.05; ).
Figure 20 PLB regulates the expression of CDK1/CDC2, cyclin B1, CDK2, cyclin D1, p21 Waf1/Cip1, p27 Kip1, and p53 in DU145 cells.
Abbreviation: PLB, plumbagin.
These results have demonstrated that PLB could downregulate CDK1/CDC2, CDK2, cyclin B1, and cyclin D1 in PC-3 and DU145 cells with differential effects. This would contribute to the cell cycle arrest in both cell lines when exposed to PLB.
To further elucidate the mechanisms for the effect of PLB on cell cycle, the expression levels of p21 Waf1/Cip1, p27 Kip1, and p53 in PC-3 and DU145 cells treated with PLB were determined using Western blot assay. The tumor suppressor protein p21 Waf1/Cip1 acts as an inhibitor of cell cycle progression, and it serves to inhibit kinase activity and block progression through G1/S in association with CDK2 complexes.Citation59 During cell cycle stages when CDC2/cyclin B or CDK2/cyclin A are active, p53 is phosphorylated and upregulates p21 Waf1/Cip1 transcription via a p53-responsive element. p27 Kip1 is a member of the Cip/Kip family of cyclin-dependent kinase inhibitors.Citation60 Like p57 Kip2 and p21 Waf1/Cip1, p27 Kip1 enforces the G1 restriction point via its inhibitory binding to CDK2/cyclin E and other CDK/cyclin complexes.Citation60 p53 is a tumor suppressor protein that plays a major role in cellular response to DNA damage and other genomic aberrations.Citation61 Activation of p53 can lead to either cell cycle arrest and DNA repair or apoptosis. p53 is phosphorylated at multiple sites and by several different protein kinases. DNA damage induces phosphorylation of p53 at Ser15 and Ser20 and leads to a reduced interaction between p53 and its negative regulator, mouse double minute 2 homolog.Citation61 As shown in , the expression level of p21 Waf1/Cip1 was concentration-dependently increased in PC-3 cells when treated with PLB for 24 hours. In comparison to the control cells, there was a 1.7- and 1.9-fold increase in the expression of p21 Waf1/Cip1 in PC-3 cells treated with PLB at 1 and 5 μM for 24 hours, respectively (P<0.05; ), and the expression level of p27 Kip1 was increased 1.5- and 1.8-fold in DU145 cells treated with PLB at 1 and 5 μM, respectively. In addition, there was a significant increase (greater than twofold) in the expression level of p21 Waf1/Cip1 in DU145 cells after treatment with PLB at 5 μM for 24 hours (P<0.05; ). Moreover, there was a 2.9- and 1.9-fold increase in the expression level of p53 in PC-3 and DU145 cells when treated with 5 μM PLB for 24 hours, respectively (P<0.01; and ).
These results demonstrate that PLB can upregulate p21 Waf1/Cip1, p27 Kip1, and p53 in PC-3 and DU145 cells. This will contribute to the cell cycle arrest and apoptosis induced by PLB. Importantly, these results have confirmed the regulatory effect of PLB on cell proliferation-related signaling pathways which was predicted by our bioinformatic study and revealed by our SILAC-based proteomic experiment.
PLB induces apoptosis via mitochondrial pathway and autophagy via modulation of PI3K/Akt/mTOR pathway
Apoptosis and autophagy, two types of predominant programmed cell death, have been found to be potential targets of PLB for its cancer cell killing effect.Citation30 We have observed that PLB significantly induces apoptosis and autophagy in PC-3 and DU145 cells in concentration- and time-dependent manners. The apoptosis and autophagy inducing effects of PLB may be through mitochondrial- and mTOR-mediated pathways. It has been reported that PI3K, mTOR, Akt, and p38MAPK are the upstream regulatory factors of apoptosis and autophagy, and cytochrome c is a responsive effector to the variations in PI3K/Akt/mTOR and p38MAPK signaling pathways initiating mitochondria-dependent apoptosis.Citation47,Citation62,Citation63 Released cytochrome c triggers the activation of caspase family, such as caspase 9 and its downstream caspase 3, and shifting the balance of antiapoptotic to proapoptotic status with the involvement of Bcl-2 family proteins contributes to apoptosis. Inhibition of PI3K/Akt/mTOR axis can remarkably promote autophagy.
Following the verification of the inhibitory effect of PLB on cell cycle, we further tested the effect of PLB on the expression and phosphorylation of PI3K, mTOR, Akt, p38MAPK, cytochrome c, caspase 9, caspase 3, Bcl-2, and BAX in PC-3 and DU145 cells. Cells were treated with PLB at concentrations of 0.1, 1, and 5 μM for 24 hours. There was a significant decrease in the phosphorylation level of PI3K, mTOR, and Akt ( and ) after PC-3 and DU145 cells were treated with PLB. In PC-3 cells with the treatment of PLB at 0.1, 1, and 5 μM, the phosphorylation level of PI3K decreased 26.6%, 34.9%, and 35.5%, the phosphorylation level of Akt reduced 20.1%, 28.4%, and 34.3%, and phosphorylation level of mTOR dropped 12.9%, 11.5%, and 31.3%, respectively (). Similarly, the phosphorylation level of PI3K reduced 13.4%, 28.1%, and 35.4%, the phosphorylation level of Akt dropped 46.9%, 58.7%, and 58.0%, and phosphorylation level of mTOR decreased 26.9%, 27.9%, and 36.0%, respectively (). Moreover, the phosphorylation of p38MAPK decreased 25.0%, 40.0%, and 50.7% in PC-3 cells () and 37.6%, 57.4%, and 63.9% in DU145 cells () when treated with PLB at 0.1, 1, and 5 μM, respectively, for 24 hours.
Figure 21 Effects of PLB treatment on the expression and phosphorylation levels of PI3K, Akt, mTOR, p38MAPK, and cytochrome c in PC-3 cells.
Abbreviation: PLB, plumbagin.
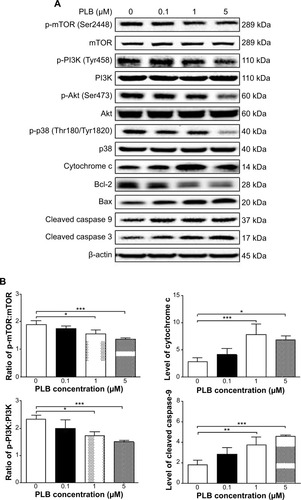
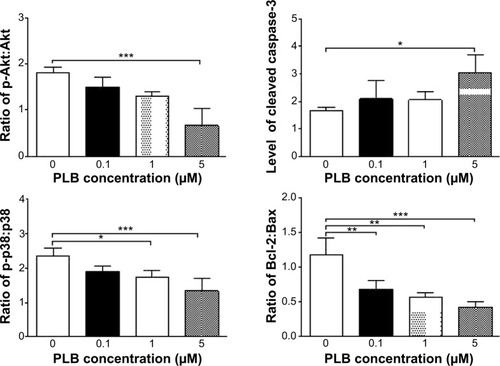
Figure 22 Effects of PLB treatment on the expression and phosphorylation levels of PI3K, Akt, mTOR, p38MAPK, and cytochrome c in DU145 cells.
Abbreviation: PLB, plumbagin.
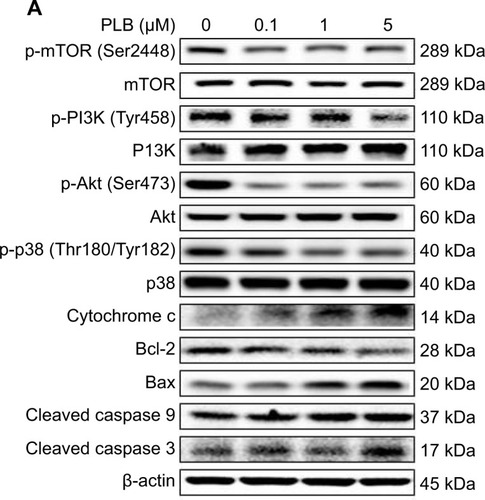
On the other hand, the expression of cytochrome c was significantly increased in PC-3 and DU145 cells with the treatment of PLB ( and ). Increased release of cytochrome c initiates mitochondria-dependent apoptosis through the sequential activation of caspase family and interruption of the balance of antiapoptotic (Bcl-2) and proapoptotic (BAX) proteins. As shown in and , incubation of PC-3 and DU145 cells with PLB significantly increased the cleaved level of caspase 9 and caspase 3. In PC3 cells, there was 1.6-, 2.1-, and 2.6-fold increase in cleaved level of caspase 9, and 1.3-, 1.3-, and 1.8-fold rise in cleaved level of caspase 3 when treated with PLB at 0.1, 1, and 5 μM, respectively (). Similarly, when DU145 cells were treated with PLB at 0.1, 1, and 5 μM, there was 1.2-, 1.4-, and 1.9-fold increase in cleaved level of caspase 9, and 1.1-, 1.4-, and 2.0-fold elevation in cleaved level of caspase 3, respectively (). Moreover, the ratio of Bcl2 over BAX was significantly decreased in both cells treated with PLB. The ratio was decreased 42.4%, 52.0%, and 63.7% in PC-3 cells () and 21.2%, 70.5%, and 80.9% in DU145 cells () with the treatment of PLB at 0.1, 1, and 5 μM, respectively. These results clearly showed that PLB induced apoptosis via mitochondrial pathway and autophagy via PI3K/mTOR pathway in PC-3 and DU145 cells, and these data are in agreement with our proteomic findings.
PLB inhibits EMT in PC-3 and DU145 cells
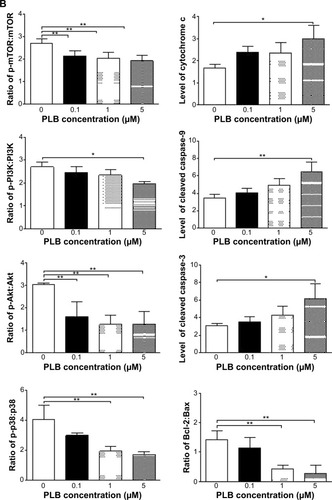
EMT is a critical process involving the initiation, growth, invasion, and metastasis of cancer.Citation20,Citation21,Citation64 EMT depends on a reduction in expression of cell adhesion molecules. E-cadherin is considered an active suppressor of invasion and growth of many epithelial cancers. Tight junctions, or zonula occludens, form a continuous barrier to fluids across the epithelium and endothelium.Citation20,Citation21,Citation64 They function in regulation of paracellular permeability and in the maintenance of cell polarity, blocking the movement of transmembrane proteins between the apical and the basolateral cell surfaces. Tight junctions are composed of claudin and occludin proteins, which join the junctions to the cytoskeleton. ZO-1, 2, and 3 are peripheral membrane adaptor proteins that link junctional transmembrane proteins such as occludin and claudin to the actin cytoskeleton.Citation20–Citation22,Citation64 Cadherins are a superfamily of transmembrane glycoproteins that contain cadherin repeats of approximately 100 residues in their extracellular domain. They mediate calcium-dependent cell–cell adhesion and the classic cadherin subfamily includes N-, P-, R-, B-, and E-cadherins.Citation20,Citation21 The cytoplasmic domain of classical cadherins interacts with β-catenin, γ-catenin, and p120 catenin. Cancer cells often have upregulated N-cadherin in addition to loss of E-cadherin.Citation20–Citation22 Herein, we examined the effect of PLB treatment on EMT-associated markers in PC-3 and DU145 cells using Western blot assay. Incubation of PC-3 cells with PLB resulted in a concentration-dependent increase in the expression level of E-cadherin and decrease in the expression level of N-cadherin (). There was a 1.3- and 1.4-fold increase in the expression of E-cadherin when treated with 1 and 5 μM PLB for 24 hours, respectively; whereas 5 μM PLB suppressed 30.3% expression level of N-cadherin (P<0.05; ). Consequently, with increasing concentration of PLB, an increased ratio of E-cadherin over N-cadherin was observed. The E-cadherin/N-cadherin ratio was increased from 1.4 at basal level to 1.7, 2.4, and 3.0, when PC-3 cells were treated with 0.1, 1 and 5 μM PLB for 24 hours, respectively (P<0.05; ). In DU145 cells, there was a 1.6- and 1.5-fold increase in the expression of E-cadherin when cells were treated with 1 and 5 μM PLB, respectively (). Meanwhile, PLB decreased the expression of N-cadherin, but no significant effect was observed. However, the E-cadherin/N-cadherin ratio was increased from 1.1 to 1.4, 1.9, and 2.0, when DU145 cells were treated with 0.1, 1, and 5 μM PLB, respectively (P<0.05; ).
Figure 23 Dose effect of PLB on the expression level of selected EMT markers in PC-3 cells.
Abbreviations: EMT, epithelial–mesenchymal transition; PLB, plumbagin.
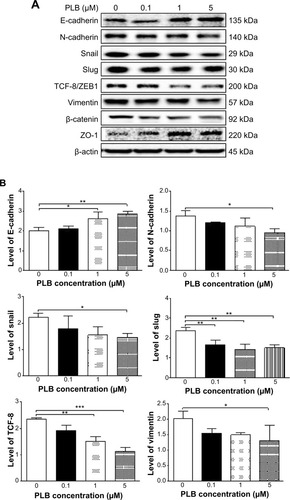
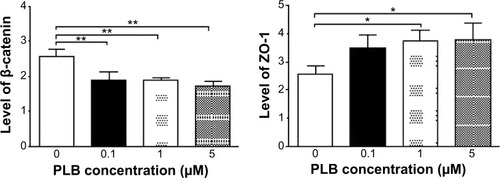
Figure 24 Dose-effect of PLB on the expression level of selected EMT markers in DU145 cells.
Abbreviations: EMT, epithelial–mesenchymal transition; PLB, plumbagin.
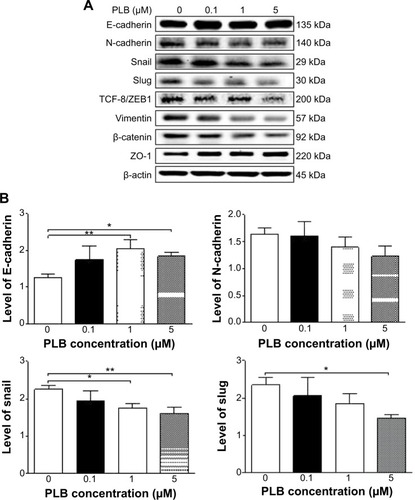
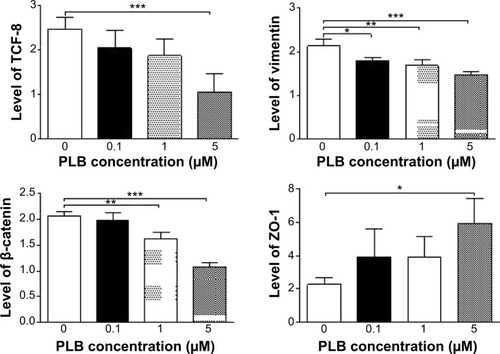
In order to further examine the effect of PLB on EMT in PC-3 and DU145 cells, we measured the expression levels of several key regulators of E-cadherin. Snail and slug (both zinc finger transcriptional factors) together with TCF8/ZEB1 are suppressors of E-cadherin in EMT.Citation20,Citation21 In addition, snail blocks the cell cycle and confers resistance to cell death, and slug protects damaged cells from apoptosis by repressing p53-induced transcription of the proapoptotic Bcl-2 family protein PUMA.Citation20,Citation21 PLB significantly reduced the expression level of snail and slug in both cell lines ( and ). In PC-3 cells, 5 μM PLB significantly suppressed the expression level of snail by 19.6%, 30.8%, and 35.4%, and of slug by 29.2%, 40.0%, and 37.6% when treated with 0.1, 1, and 5 μM PLB for 24 hours, respectively (P<0.01; ). In DU145 cells, 1 and 5 μM PLB significantly suppressed the expression level of snail by 21.8% and 28.9%, respectively. Treatment of cells with 5 μM PLB for 24 hours significantly reduced the expression level of slug by 38.1% (P<0.05; ). Furthermore, PLB induced a concentration-dependent reduction in the expression level of TCF-8/ZEB1 in PC-3 and DU145 cells. In PC-3 cells, 1 and 5 μM PLB significantly suppressed the expression level of TCF-8/ZEB1 by 36.2% and 51.7%, respectively (). Similarly, there was a 57.5% reduction in the expression of TCF-8/ZEB1 in DU145 cells treated with 5 μM of PLB (P<0.001; ).
Vimentin is a type III intermediate filament protein that is expressed in mesenchymal cells.Citation20–Citation22,Citation64 β-catenin can act as an integral component of a protein complex in adherent junctions that helps cells maintain epithelial layers, and β-catenin participates in the Wnt signaling pathway as a downstream target.Citation22,Citation64 Treatment of cells with 5 μM PLB significantly suppressed the expression level of vimentin by 36.0% in PC-3 cells (P<0.05; ). PLB at 0.1 and 1 μM reduced vimentin level by 23.8%−26.4%, but did not achieve statistical significance. In DU145 cells, treatment with PLB at 0.1, 1, and 5 μM for 24 hours resulted in a 10.0%, 19.3%, and 29.7% reduction in vimentin expression levels, respectively (P<0.05–0.001; ).
There was a significant reduction in the expression level of β-catenin in both cell lines treated with PLB at 0.1, 1, and 5 μM for 24 hours. PLB at 0.1, 1, and 5 μM significantly decreased the expression level of β-catenin by 25.7%, 26.2%, and 32.6% in PC-3 cells, respectively (), and 1 and 5 μM PLB significantly reduced β-catenin expression by 21.0% and 47.5% in DU145 cells, respectively ().
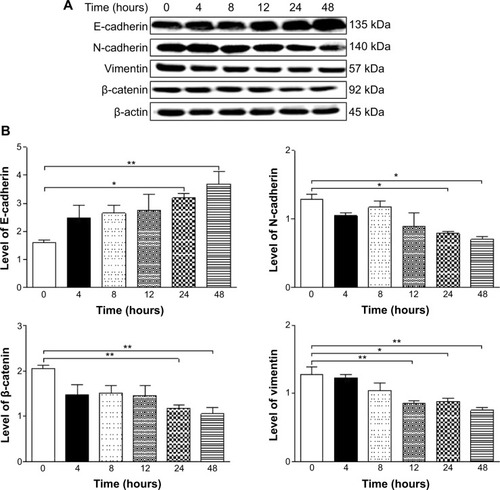
Furthermore, we examined the time course of the effect of PLB on the expression of selected EMT markers in PC-3 and DU145 cells over 48 hours. There was a significant inhibitory effect of PLB on EMT in both cells ( and ). In comparison to the control cells, treatment of PC-3 cells with 5 μM PLB significantly increased the expression of E-cadherin by 1.7- and 2.4-fold, while the expression of N-cadherin was decreased by 49.2% and 58.1% after 24 and 48 hours, respectively, which in turn led to a significant increase in the ratio of E-cadherin over N-cadherin. The expression of vimentin was significantly decreased by 40.0% and 51.4% with the 5 μM PLB treatment for 24 and 48 hours, respectively. Moreover, the expression of β-catenin was reduced by 4.06% and 41.7% with the 5 μM PLB treatment for 24 and 48 hours, respectively (). In DU145 cells, incubation with 5 μM PLB for 24 and 48 hours led to a 2.0- and 2.3-fold increase in the expression of E-cadherin, respectively, and resulted in a 38.8% and 45.3% reduction in the expression of N-cadherin compared to the control cells, respectively. Consequently, it led to an increase in the ratio of E-cadherin over N-cadherin. Moreover, treatment of DU145 cells with 5 μM of PLB induced a time-dependent decrease in the expression of β-catenin and vimentin by 42.8% and 48.6%, and 30.9% and 40.8%, to 24 hour and 48 hour treatment, respectively ().
Figure 25 Effects of PLB on the expression level of selected EMT markers in PC-3 cells over 48 hours.
Abbreviations: EMT, epithelial–mesenchymal transition; PLB, plumbagin.
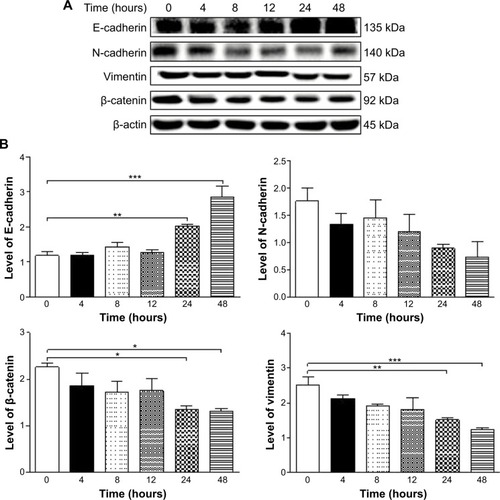
Figure 26 Effects of PLB on the expression level of selected EMT markers in DU145 cells over 48 hours.
Abbreviations: EMT, epithelial–mesenchymal transition; PLB, plumbagin.
Finally, the expression of ZO-1 was examined in PC-3 and DU145 cells exposed to PLB. ZO-1 and -2 are required for tight junction formation and function. In subconfluent proliferating cells, ZO-1 and ZO-2 have been shown to colocalize to the nucleus and play a role in transcriptional regulation, possibly through facilitating nuclear import/export of transcriptional regulators.Citation18,Citation46 There was a significant effect of PLB on the expression of ZO-1 observed in both cell lines ( and ). Treatment of PC-3 cells with 1 and 5 μM PLB for 24 hours resulted in a 1.5-fold increase in ZO-1 expression and 5 μM PLB resulted in a 2.6-fold increase in the expression level of ZO-1 in DU145 cells (P<0.05; and ). These results from Western blot assay are consistent with our proteomic data.
PLB regulates EMT via Sirt1-mediated pathway in PC-3 and DU145 cells
Sirt1 plays an important role in the regulation of EMT and our proteomic data suggest that PLB may regulate Sirt1-mediated signaling pathways. Thus, we speculated that PLB may regulate Sirt1 expression in PC-3 and DU145 cells. We examined the effect of PLB on the expression of Sirt1 in both cell lines and evaluated the effect of STL (an inhibitor of Sirt1Citation65) on the expression of E-cadherin and N-cadherin in PC-3 and DU145 cells. As shown in , incubation of PC-3 and DU145 cells with PLB at 0.1, 1, and 5 μM resulted in a significant decrease in the expression of Sirt1. There was a 32.4% reduction in the expression level of Sirt1 when PC-3 cells were treated with 5 μM PLB (), and a 38.1%, 44.6%, and 56.1% decrease in the expression level of Sirt1 in DU145 cells treated with 0.1, 1, and 5 μM PLB, respectively (). Treatment of PC-3 cells with 25 μM STL alone significantly increased the expression level of E-cadherin by 111.1% and decreased the level of N-cadherin by 46.2% compared to vehicle-treated cells (P<0.05; ), resulting in a significantly increased ratio of E-cadherin/N-cadherin (3.9 versus 1.0). Addition of 25 μM STL caused a 45.3% increase in PLB-induced expression of E-cadherin (P<0.05) while only slightly decreasing the expression level of N-cadherin (by 28.4%) in PC-3 cells compared to cells treated with 5 μM PLB, resulting in a significantly increased E-cadherin/N-cadherin ratio (4.8 versus 2.3; P<0.05; ). The downregulation of Sirt1 by PLB may partially contribute to its autophagy-inducing and EMT-inhibitory effects.
Figure 27 The role of Sirt-1 in PLB-induced EMT inhibition in PC-3 and DU145 cells.
Abbreviations: EMT, epithelial–mesenchymal transition; PLB, plumbagin; STL, sirtinol.
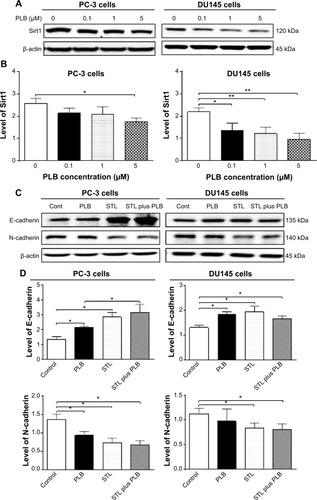
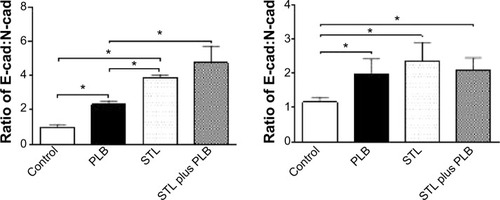
In DU145 cells, STL alone induced a 1.5-fold increase in the expression level of E-cadherin and reduced the level of N-cadherin by 25.3% compared to vehicle-treated cells, resulting in a significantly increased ratio of E-cadherin/N-cadherin (1.2 versus 2.4; P<0.05; ). Incubation of STL together with 5 μM PLB only slightly decreased the expression level of E-cadherin (by 9.7%) but significantly decreased the expression level of N-cadherin by 16.8% compared to PLB-treated cells, resulting in an insignificantly changed E-cadherin/N-cadherin ratio (). These results indicate that inhibition of Sirt1 blocks EMT by restoring the E-cadherin and N-cadherin balance, and that inhibition of Sirt1 augments the inhibitory effect of PLB on EMT in PC-3 cells, but not in DU145 cells. The data from Western blot assay support our findings from our quantitative proteomic study where differences in the proteomic responses to PLB treatment were observed between PC-3 and DU145 cells.
PLB modulates ROS and redox pathways in PC-3 and DU145 cells
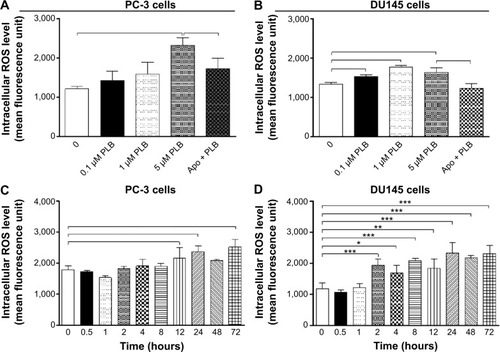
Increased intracellular ROS level can cause cell death through various mechanisms, including mitochondria-mediated apoptosis and modulation of autophagy.Citation66–Citation68 Following the observation and verification of proapoptotic effect of PLB in PC-3 and DU145 cells, we examined the effect of PLB on ROS production in both cell lines. Cells were treated with PLB at 0.1, 1, and 5 μM for 24 hours. The intracellular level of ROS was significantly increased by 1.9-fold in PC-3 cells treated with 5 μM PLB (); in DU145 cells, there was 1.1-, 1.3-, and 1.2-fold elevation in the intracellular level of ROS when cells were treated with PLB at 0.1, 1, and 5 μM, respectively (). Apo, an NADPH oxidase inhibitor, significantly suppressed the PLB-induced ROS production in both cell lines (P<0.05; ). Moreover, there was a significant increase in the intracellular ROS level when cells were treated over 72 hours. After incubation of PC-3 and DU145 cells with 5 μM PLB for 72 hours, there was a 1.4- and 1.9-fold increase in the intracellular level of ROS, respectively (). The ROS-inducing effect of PLB in PC-3 and DU145 cells reveals that PLB induces the generation of ROS in many types of cancer cells, and this may be the shared key mechanism for the anticancer effects of PLB on these types of cancer cells. The data from Western blot assay further confirms our main finding in SILAC-based quantitative proteomic study where ROS-related pathways were regulated by PLB in both PC-3 and DU145 cells.
Figure 28 Effect of PLB on the intracellular ROS generation in PC-3 and DU145 cells.
Abbreviations: Apo, apocynin; PLB, plumbagin; ROS, reactive oxygen species.
Discussion
Treatment of advanced prostate cancer remains a major challenge because of poor efficacy of current therapies and chemotherapy. There is an increased interest in seeking new effective drugs for prostate cancer from natural compounds. PLB has been found to exhibit anticancer activities for prostate cancer in vitro and in vivo, which are attributed to its effects on multiple signaling pathways related to cell cycle arrest, apoptosis, autophagy, EMT, and redox homeostasis.24–28,30,31,46,69,70 In the present study, we compared the global proteomic responses to PLB treatment with regard to cell cycle, programmed cell death, EMT and related molecular targets, and signaling pathways in PC-3 and DU145 cells. The quantitative proteomic study showed that a large number of important proteins regulate cell proliferation, growth, cell death, and migration in both PC-3 and DU145 cells. Importantly, the proteomic analysis showed remarkable differences in the responses to PLB treatment between PC-3 and DU145 cells. Such differences are largely validated by our Western blot analysis, although we could not identify the reasons for such significant differences observed with the two commonly used human prostate cancer cell lines.
Before conducting SILAC-based quantitative proteomic study, we performed a bioinformatic analysis to predict the potential targets of PLB using an established approach, and we have found that PLB might interact with 78 proteins including those involved in cell proliferation and apoptosis; nucleic acid biosynthesis and metabolism; carbohydrate, lipid, steroid, amino acid, and protein metabolism; and signal transduction. In particular, many of the targets predicted based on our bioinformatic tools are associated with cell growth, apoptosis, and related signaling pathways, which have been verified by published data from our group and other groups.Citation25,Citation28,Citation30,Citation46,Citation70
To verify the above bioinformatic data and explore whether PC-3 and DU145 cell lines would respond to PLB treatment in similar or different manners, we further analyzed the interactome and related signaling pathways of PLB in PC-3 and DU145 cells using SILAC-based quantitative proteomic approach. The proteomic results revealed that PLB modulated cell cycle regulators, apoptosis- and autophagy-related signaling pathways, EMT signaling pathways, and redox homeostasis and related signaling pathways, which in turn resulted in an alteration in cell proliferation, cell migration, and cell death with the involvement of a number of function proteins, such as CDK1, CDK2, E-cadherin, PI3K, Akt, mTOR, cytochrome c, caspase 9, caspase 3, Bcl-2, BAX, p53, PPAR, HSP, Erk1/2, Ras, and Rho. Our proteomic analysis also showed that mTOR signaling pathway was one of the top five signaling pathways regulated by PLB in both PC-3 and DU145 cells and that PLB regulated Nrf2-mediated oxidative response signaling pathway in both cell lines. Importantly, these key proteomic data have been verified by subsequent experiments.
Notably, we observed marked differences in proteomic responses to PLB with regard to the number of related pathways of potential targets between PC-3 and DU145 cells. Our proteomic study showed that PLB altered the expression of a large number of proteins that regulate cell cycle regulators, apoptosis, and EMT signaling pathways in PC-3 cells but not in DU145 cells. This is interesting when both cell lines could be killed by PLB via ROS generation. The reasons for the differential proteomic response are unknown, but may be related to origin of cell lines, remarkably different cytogenetics, and other possible factors. PC3 cells were obtained from a patient with a bone metastasis of grade IV prostate cancer and showed a higher metastatic potential compared to DU145 cells, and did not respond to androgens, glucocorticoids, or epidermal or fibroblast growth factors.Citation71 The significantly different cytogenetic characteristics of PC-3 and DU145 cells may be another contributing factor.Citation72,Citation73 PC-3 cells have a unique karyotype in the absence of chromosomes 2, 3, 5, 15, and Y.Citation74 The centromere 8 copy number was substantially different between PC-3 and DU145 cells.Citation75 The copy number of centromere 8 with the highest observed frequency was two (79.4%) in PC-3 cells and three (70.%) in DU145 cells.Citation75 A recent study indicated that DU145 cells have no detectable autophagy upon treatment with a known autophagic inducer, valproic acid, indicating a defect of autophagy in this cell line.Citation76 In addition, the different batches and passages of cells used for separate experiments might also contribute to the different responses to PLB treatment as well.
In the present study, the proteomic data showed differential responses to PLB treatment with regard to cell cycle between PC-3 and DU145 cells. PLB regulated cell cycle at G1 and G2 checkpoints involving a number of cell cycle regulators in PC-3 cells, such as RPL11, RPL5, HDAC2, PA2G4, GNL3, SKP1, YWHAQ, PRKDC, YWHAG, YWHAE, YWHAH, YWHAB, YWHAZ, SFN, SKP1, and CDK1, which consequently result in alterations in cell cycle distribution. However, the proteomic analysis did not show a significant modulating effect of cell cycle signaling pathways in DU145 cells. Indeed, we found a differential effect of PLB on cell cycle distribution in PC-3 and DU145 cells using flow cytometry. PLB concentration-dependently arrested PC-3 and DU145 cells in G2/M and G1 phase, respectively. We further explored the effect of PLB on the key regulators in cell cycle checkpoints including CDC2, cyclin B1, CDK2, and cyclin D in both cell lines. The CDC2–cyclin B1 complex is pivotal in regulating the G2/M phase transition and mitosis. We observed a significant decrease in the expression level of cyclin B1 and CDC2 in PC-3 cells treated with PLB, providing an explanation for the effect of PLB on G2/M phase arrest in PC-3 cells. We observed that the expression of p53 and p21 Waf1/Cip1 was concentration- and time-dependently increased in PC-3 cells treated with PLB, which probably contributes to the inhibitory effect of PLB on cell proliferation and inducing effect on cell cycle arrest in PC-3 cells. For DU145 cells, a significant reduction in the expression of CDK2 and cyclin D was observed. We also found that PLB exhibited a concentration-dependent inducing effect on the expression of p21 Waf1/Cip1 and p27 Kip1 in DU145 cells. Furthermore, PLB increased the expression of p53 in DU145 cells. The results indicate that upregulation of p53, p21 Waf1/Cip1, and p27 Kip1 expression, and suppression of CDK2 and cyclin D by PLB may result in the G1 phase arrest in DU145 cells. These results provide further evidence that both PC-3 and DU145 cells differentially respond to PLB treatment and the cells are arrested in distinct phases.
Previous studies demonstrate that apoptosis and autophagy are two predominant cell death routes regulated by PLB in various cancer cells.Citation25,Citation27,Citation28,Citation30,Citation33,Citation46 In agreement with previous studies, our proteomic findings confirmed that PLB exhibited remarkable regulatory effects on apoptosis and autophagy in both PC-3 and DU145 cells via modulating the expression or activity of apoptotic and autophagic proteins and signaling pathways, including mTOR, p38 MAPK, and mitochondria-dependent pathways. Intriguingly, the apoptotic signaling pathway was only observed in PC-3 cells in response to PLB treatment. On the other hand, our Western blot assay showed similar apoptosis- and autophagy-inducing effects of PLB in both PC-3 and DU145 cells by regulating the expression of cytochrome c, caspase 9, caspase 3, Bcl-2, and BAX and the phosphorylation of PI3K, mTOR, Akt, and p38MAPK. Although the SILAC-based proteomics did not show a direct alteration in apoptosis in DU145 cells, the mitochondria-related apoptosis may be attributed to multiple modulating effects of PLB on other functional proteins and signaling pathways, such as the p53- and p38MAPK-mediated signaling pathways. These data also show that SILAC-based quantitative proteomic analysis is much more sensitive than routine protein quantification assays such as Western blot and enzyme-linked immunosorbent assay in terms of identification of molecular networks and discrimination of various signaling pathways that are involved in the anticancer effects of PLB.
EMT is characterized by epithelial cells that lose their polarization and specialized junction structures, undergoing cytoskeleton reorganization and acquiring morphological and functional features of mesenchymal-like cells.Citation20,Citation21 In clinic, the prostate cancer patient mortality is mainly attributed to the spread of cancerous cells to areas outside the prostate gland and the inadequate strategies to effectively block progression to metastasis; EMT plays a critical role in this process.Citation22 In primary prostate cancer cells, reduction or loss of expression of E-cadherin and β-catenin were observed.Citation22 In our proteomic study, we observed marked regulatory effects of PLB on the expression of a number of functional proteins that modulate epithelial adherent junction signaling pathway in PC-3 cells only. These modulating effects have been validated by our Western blotting experiments. The validation results showed that PLB significantly increased the ratio of E-cadherin over N-cadherin which would result in an EMT inhibition in prostate cancer. Furthermore, PLB increased the expression level of ZO-1 but suppressed the expression of snail, slug, TCF-8, and vimentin in PC-3 cells. Although there was no remarkable alteration in proteomic responses with regard to EMT-related function proteins and signaling pathways in DU145 cells treated with PLB, the validation experiments showed a similar inhibitory effect of PLB on the expression of a number of functional proteins that regulate EMT in DU145 cells. Taken together, our findings suggest that inhibition of EMT progression is one of the beneficial actions of PLB contributing to its anticancer effects in prostate cancer therapy. Again, SILAC-based quantitative proteomic analysis can discriminate the role of EMT modulation in the anticancer effects of PLB on PC-3 and DU145 cells.
Moreover, there is increasing evidence indicating the important role of Sirt1 in the regulation of cancer cell growth, cell death, and metastasis.Citation54,Citation77 Sirt1 deacetylates histones, p300, p53, forkhead box class O family members, and NF-κB, which regulate cellular stress response and cell survival.Citation54 It also regulates PPAR-γ, AMPK, and mTOR with regard to cellular energy metabolism and autophagy.Citation54 Our proteomic findings showed that the PLB regulated PPAR-γ, AMPK, p53, and mTOR-associated signaling pathways, which may be attributed to the regulatory effect of PLB on Sirt1 in PC-3 and DU145 cells. Importantly, the proteomic data showed that PLB treatment had a regulated effect on NAMPT in NAD+ biosynthesis signaling pathway, which is crucial for functional Sirt1. Consistently, our Western blotting results showed that PLB treatment significantly decreased the expression level of Sirt1 in both cell lines. Of note, it has been reported that silencing Sirt1 can promote the shift to an epithelial morphology in prostate cancer cells.Citation23 In agreement with the previous study, we found that inhibition of Sirt1 increased the ratio of E-cadherin over N-cadherin in PC-3 and DU145 cells. The results showed that suppression of Sirt1 prevented EMT progress in prostate cancer cells. Moreover, we observed that inhibition of Sirt1 enhanced the inducing effect of PLB on the ratio of E-cadherin over N-cadherin in PC-3 cells, which indicated that PLB inhibited EMT through a Sirt1-mediated pathway.
Moreover, a number of studies have shown that the ROS-inducing effect of PLB contributes to its cancer cell killing effect in various cancer cell lines.Citation24,Citation30,Citation32–Citation34 Our quantitative proteomic analysis uncovered that PLB modulated several critical signaling pathways related to intracellular ROS generation and oxidative stress, including oxidative phosphorylation, Nrf2-mediated oxidative stress response, and superoxide radical degradation with the involvement of a number of enzymes and proteins. We have confirmed that PLB significantly promoted intracellular ROS generation in PC-3 and DU145 cells. Taken together, these results have revealed that the ROS-inducing effect is one of the key events involved in the anticancer effects of PLB.
Our SILAC-based proteomic approach showed significant advantages over the conventional proteomic methods, such as two-dimensional polyacrylamide gel electrophoresis or surface-enhanced laser desorption/ionization mass spectrometry. Although they were primarily used to analyze the protein expression profiles, they cannot quantitatively and easily identify the individual proteins.Citation36,Citation78 Compared to single-labeled SILAC proteomic approach, our double-labeled approach (13C6-L-lysine and 13C6/15N4-L-arginine) also showed obvious advantages. For example, Everley et alCitation79 identified 444 proteins from the microsomal fractions of prostate cancer cells including PC3M and PC3M-LN4 cells with varying metastatic potential using 13C6-L-lysine SILAC-based proteomic approach. Both of these cell types are derived from PC-3 cells and exhibit low (PC3M) and high (PC3M-LN4) metastatic ability. Of these, 60 were upregulated greater than threefold in the highly metastatic cells, whereas 22 were downregulated by equivalent amounts. We depicted the global proteomic responses to PLB treatment with regard to cell proliferation, cell growth, cell migration, programmed cell death, and ROS production in PC-3 cells via quantification of 1,225 proteins and 341 related signaling pathways, and the double-labeled SILAC-based proteomic approach systematically elicited the network of potential molecular targets and related signaling pathways for PLB in a quantitative manner. Taken together, the double-labeled SILAC-based approach provides a powerful strategy for interactome characterization, new drug target identification, and biomarker determination for diagnosis and treatment of cancer.
Our new findings from the SILAC-based quantitative proteomic analysis have important implications for the subtype classification of prostate-cancer-based protein expression profiles. These SILAC-based data can classify cancer subtypes as well as reveal cancer-specific mechanistic changes. For example, SILAC-based quantitative proteomic assay has been used to classify diffusive large B-cell lymphoma subtypes including activated B-cell-like and germinal-center B-cell-like subtypes.Citation80,Citation81 In one study, SILAC-based proteomic assay yielded a proteome of more than 7,500 identified proteins from mixed cancer cell lines of diffusive large B-cell lymphoma. High accuracy of quantification allowed robust separation of subtypes of diffusive large B-cell lymphoma by principal component analysis. The main contributors to the classification included proteins known to be differentially expressed between the subtypes such as the transcription factors IRF4 and SPI1/PU.1, cell surface markers CD44 and CD27, as well as novel candidates.Citation80 SILAC-based quantification is a promising new technology for tumor characterization and classification. SILAC-based proteomic assay has not been commonly used for the biomarker identification and classification of prostate cancer. Previous proteomic studies have revealed several biomarkers that can discriminate the subtypes of prostate cancer.Citation82–Citation85 For example, lamin A has been found to be a useful discriminatory biomarker for low- and high-grade prostate cancer.Citation85 Platelet factor 4, a chemokine with prothrombolytic and antiangiogenic activities, was identified as a stage-specific serologic biomarker for advanced prostate cancer.Citation82 In agreement with previous proteomic study,Citation82–Citation85 our SILAC-based quantification revealed that PLB regulated the expression of lamin A and its related apoptotic signaling pathway in PC-3 cells only, which further suggests the potential of SILAC-based proteomic approach in biomarker identification and classification of prostate cancer.
Our proteomic data also have implications for personalized cancer treatment. It is well-known that cancer patients respond very differently to chemotherapy and targeted therapies. By incorporating the proteomic data, we can better implement individualized therapies for cancer. A proteomic effort will be necessary to identify useful biomarkers that can classify patient tumor by prognosis and response to therapeutic modalities, and to identify the drivers of tumor behavior that are optimal targets for therapy. An understanding of the effects of targeted therapeutics on signaling networks and homeostatic regulatory loops will be necessary to prevent severe adverse effects as well as to develop rational combinatorial therapies.Citation86,Citation87
In summary, we delineated the differences and similarities in the molecular targets and related signaling pathways responding to PLB treatment using SILAC-based proteomic analysis in PC-3 and DU145 cells. The proteomic responses elicited the molecular interactome of PLB in PC-3 and DU145 cells, indicating that the prostate cancer cell killing effect of PLB was mainly ascribed to the regulatory effects on cell cycle, apoptosis, autophagy, EMT, and ROS generation with the involvement of PI3K/Akt/mTOR, p38 MAPK, and Sirt1-mediated signaling pathways. The data have important implications for: better classification of prostate cancer; identification of new therapeutic targets and new biomarkers for the prognosis and response of prostate cancer; and personalized therapy for prostate cancer. However, more studies are needed to elucidate the underlying mechanisms and identify new targets of PLB for prostate cancer therapy.
Acknowledgments
The authors appreciate the financial support from the Startup Fund of the College of Pharmacy, University of South Florida, Tampa, FL, USA. Dr Zhi-Wei Zhou is a holder of a postdoctoral scholarship from College of Pharmacy, University of South Florida, Tampa, FL, USA.
Disclosure
The authors report no conflicts of interest in this work.
References
- AhmedHUProstate cancer: Time for active surveillance of intermediate-risk disease?Nat Rev Urol20131016823147924
- FerlayJSoerjomataramIErvikMGLOBOCAN 2012 v.10, Cancer Incidence and Mortality Worldwide: IARC CancerBase No. 11. [homepage on the Internet]Lyon, FranceInternational Agency for Research on Cancer2013 Available from: http://globocan.iarc.fraccessed on November 7, 2014
- FerlayJShinHRBrayFFormanDMathersCParkinDMEstimates of worldwide burden of cancer in 2008: GLOBOCAN 2008Int J Cancer2010127122893291721351269
- SoerjomataramILortet-TieulentJParkinDMGlobal burden of cancer in 2008: a systematic analysis of disability-adjusted life-years in 12 world regionsLancet201238098561840185023079588
- GundersonKWangCYWangRGlobal prostate cancer incidence and the migration, settlement, and admixture history of the Northern EuropeansCancer Epidemiol201135432032721167803
- U.S. Cancer Statistics Working Group. [webpage on the Internet]United States Cancer Statistics: 1999–2010 Incidence and Mortality Web-based ReportAtlanta, GA2013 Available from http://apps.nccd.cdc.gov/uscs/Accessed November 7, 2014
- DeSantisCELinCCMariottoABCancer treatment and survivorship statistics, 2014CA Cancer J Clin201464425227124890451
- Cancer Research UK. [homepage on the Internet]Cancer statistics report: Cancer incidence and mortality in the UK for the 10 most common cancers December 2013 Available from http://publications.cancerresearchuk.org/cancerstats/statsincidence/reporttop10incmort.htmlAccessed November 7, 2014
- KlotzLNomogram for predicting survival in men with clinically localized prostate cancer who do not undergo definitive therapyNat Clin Pract Urol20085736236318506150
- AlbertsenPPredicting survival for men with clinically localized prostate cancer: what do we need in contemporary practice?Cancer200811211318000802
- American Cancer Society [webpage on the Internet]Global cancer facts and figures2nd editionAtlanta2011 Available from: http://www.cancer.org/research/cancerfactsfigures/globalcancerfactsfigures/Accessed November 7, 2014
- SaylorPJProstate cancer: The androgen receptor remains front and centreNat Rev Clin Oncol201310312612823381000
- WenSNiuYLeeSOChangCAndrogen receptor (AR) positive vs negative roles in prostate cancer cell deaths including apoptosis, anoikis, entosis, necrosis and autophagic cell deathCancer Treat Rev2014401314023993415
- RodriguesDNButlerLMEstellesDLde BonoJSMolecular pathology and prostate cancer therapeutics: from biology to bedsideJ Pathol2014232217818424108540
- HelfandBTCatalonaWJThe epidemiology and clinical implications of genetic variation in prostate cancerUrol Clin North Am201441227729724725490
- FangYXGaoWQRoles of microRNAs during prostatic tumorigenesis and tumor progressionOncogene201433213514723455326
- FraserMBerlinABristowRGvan der KwastTGenomic, pathological, and clinical heterogeneity as drivers of personalized medicine in prostate cancerUrol Oncol Epub2014422
- CrawfordEDVentiiKShoreNDNew biomarkers in prostate cancerOncology (Williston Park)201428213514224701701
- BarveAJinWChengKProstate cancer relevant antigens and enzymes for targeted drug deliveryJ Control Release2014187C11813224878184
- ZhengHKangYMultilayer control of the EMT master regulatorsOncogene201433141755176323604123
- LamouilleSXuJDerynckRMolecular mechanisms of epithelial- mesenchymal transitionNat Rev Mol Cell Biol201415317819624556840
- NauseefJTHenryMDEpithelial-to-mesenchymal transition in prostate cancer: paradigm or puzzle?Nat Rev Urol20118842843921691304
- BylesVZhuLLovaasJDSIRT1 induces EMT by cooperating with EMT transcription factors and enhances prostate cancer cell migration and metastasisOncogene201231434619462922249256
- PadhyeSDandawatePYusufiMAhmadASarkarFHPerspectives on medicinal properties of plumbagin and its analogsMed Res Rev20123261131115823059762
- SubramaniyaBRSrinivasanGSadullahSSApoptosis inducing effect of plumbagin on colonic cancer cells depends on expression of COX-2PLoS One201164e1869521559086
- NazeemSAzmiASHanifSPlumbagin induces cell death through a copper-redox cycle mechanism in human cancer cellsMutagenesis200924541341819505895
- XuKHLuDPPlumbagin induces ROS-mediated apoptosis in human promyelocytic leukemia cells in vivoLeuk Res201034565866519748668
- SunJMcKallipRJPlumbagin treatment leads to apoptosis in human K562 leukemia cells through increased ROS and elevated TRAIL receptor expressionLeuk Res201135101402140821741707
- ShiehJMChiangTAChangWTPlumbagin inhibits TPA-induced MMP-2 and u-PA expressions by reducing binding activities of NF-kappaB and AP-1 via ERK signaling pathway in A549 human lung cancer cellsMol Cell Biochem20103351–218119319768635
- LiYCHeSMHeZXPlumbagin induces apoptotic and autophagic cell death through inhibition of the PI3K/Akt/mTOR pathway in human non-small cell lung cancer cellsCancer Lett2014344223925924280585
- SinhaSPalKElkhananyAPlumbagin inhibits tumorigenesis and angiogenesis of ovarian cancer cells in vivoInt J Cancer201313251201121222806981
- AzizMHDreckschmidtNEVermaAKPlumbagin, a medicinal plant-derived naphthoquinone, is a novel inhibitor of the growth and invasion of hormone-refractory prostate cancerCancer Res200868219024903218974148
- PowolnyAASinghSVPlumbagin-induced apoptosis in human prostate cancer cells is associated with modulation of cellular redox status and generation of reactive oxygen speciesPharm Res20082592171218018213451
- AbedinpourPBaronVTChrastinaAWelshJBorgstromPThe combination of plumbagin with androgen withdrawal causes profound regression of prostate tumors in vivoProstate201373548949922996809
- OngSEMannMStable isotope labeling by amino acids in cell culture for quantitative proteomicsMethods Mol Biol2007359375217484109
- MannMFunctional and quantitative proteomics using SILACNat Rev Mol Cell Biol200671295295817139335
- OngSEThe expanding field of SILACAnal Bioanal Chem2012404496797622526667
- WangRFangXLuYWangSThe PDBbind database: collection of binding affinities for protein-ligand complexes with known three-dimensional structuresJ Med Chem200447122977298015163179
- YangLLuoHChenJXingQHeLSePreSA: a server for the prediction of populations susceptible to serious adverse drug reactions implementing the methodology of a chemical-protein interactomeNucleic Acids Res200937Web Server issueW406W41219417066
- YangLChenJShiLHudockMPWangKHeLIdentifying unexpected therapeutic targets via chemical-protein interactomePLoS One201053e956820221449
- LuoHChenJShiLDRAR-CPI: a server for identifying drug repositioning potential and adverse drug reactions via the chemical-protein interactomeNucleic Acids Res201139Web Server issueW492W49821558322
- Huang daWShermanBTTanQThe DAVID Gene Functional Classification Tool: a novel biological module-centric algorithm to functionally analyze large gene listsGenome Biol200789R18317784955
- OngSEMannMA practical recipe for stable isotope labeling by amino acids in cell culture (SILAC)Nat Protoc2006162650266017406521
- LecoeurHNuclear apoptosis detection by flow cytometry: influence of endogenous endonucleasesExp Cell Res2002277111412061813
- SunilCDuraipandiyanVAgastianPIgnacimuthuSAntidiabetic effect of plumbagin isolated from Plumbago zeylanica L. root and its effect on GLUT4 translocation in streptozotocin-induced diabetic ratsFood Chem Toxicol201250124356436322960630
- WangCCChiangYMSungSCHsuYLChangJKKuoPLPlumbagin induces cell cycle arrest and apoptosis through reactive oxygen species/c-Jun N-terminal kinase pathways in human melanoma A375.S2 cellsCancer Lett20082591829818023967
- ShanwareNPBrayKAbrahamRTThe PI3K, metabolic, and autophagy networks: interactive partners in cellular health and diseaseAnnu Rev Pharmacol Toxicol2013538910623294306
- MorgenszternDMcLeodHLPI3K/Akt/mTOR pathway as a target for cancer therapyAnticancer Drugs200516879780316096426
- WuWKCoffeltSBChoCHThe autophagic paradox in cancer therapyOncogene201231893995321765470
- FerreiraCGEppingMKruytFAGiacconeGApoptosis: target of cancer therapyClin Cancer Res2002872024203412114400
- FuldaSGalluzziLKroemerGTargeting mitochondria for cancer therapyNat Rev Drug Discov20109644746420467424
- LaplanteMSabatiniDMmTOR signaling in growth control and diseaseCell2012149227429322500797
- DanceyJmTOR signaling and drug development in cancerNat Rev Clin Oncol20107420921920234352
- PreyatNLeoOSirtuin deacylases: a molecular link between metabolism and immunityJ Leukoc Biol201393566968023325925
- MontecuccoFCeaMBauerINicotinamide phosphoribosyltransferase (NAMPT) inhibitors as therapeutics: rationales, controversies, clinical experienceCurr Drug Targets201314663764323531116
- KeumYSChoiBYMolecular and chemical regulation of the Keap1-Nrf2 signaling pathwayMolecules2014197100741008925014534
- MaQRole of nrf2 in oxidative stress and toxicityAnnu Rev Pharmacol Toxicol20135340142623294312
- HuXMoscinskiLCCdc2: a monopotent or pluripotent CDK?Cell Prolif201144320521121535261
- WarfelNAEl-DeiryWSp21WAF1 and tumourigenesis: 20 years afterCurr Opin Oncol2013251525823159848
- YoonMKMitreaDMOuLKriwackiRWCell cycle regulation by the intrinsically disordered proteins p21 and p27Biochem Soc Trans201240598198822988851
- CarvajalLAManfrediJJAnother fork in the road – life or death decisions by the tumour suppressor p53EMBO Rep201314541442123588418
- SettembreCFraldiAMedinaDLBallabioASignals from the lysosome: a control centre for cellular clearance and energy metabolismNat Rev Mol Cell Biol201314528329623609508
- MaesHRubioNGargADAgostinisPAutophagy: shaping the tumor microenvironment and therapeutic responseTrends Mol Med201319742844623714574
- CannitoSNovoEdi BonzoLVBuslettaCColombattoSParolaMEpithelial-mesenchymal transition: from molecular mechanisms, redox regulation to implications in human health and diseaseAntioxid Redox Signal201012121383143019903090
- GrozingerCMChaoEDBlackwellHEMoazedDSchreiberSLIdentification of a class of small molecule inhibitors of the sirtuin family of NAD-dependent deacetylases by phenotypic screeningJ Biol Chem200127642388373884311483616
- BellotGLLiuDPervaizSROS, autophagy, mitochondria and cancer: Ras, the hidden master?Mitochondrion201313315516222750269
- DodsonMDarley-UsmarVZhangJCellular metabolic and autophagic pathways: traffic control by redox signalingFree Radic Biol Med20136320722123702245
- KaminskyyVOZhivotovskyBFree radicals in cross talk between autophagy and apoptosisAntioxid Redox Signal20142118610224359220
- HsuYLChoCYKuoPLHuangYTLinCCPlumbagin (5-hydroxy-2-methyl-1,4-naphthoquinone) induces apoptosis and cell cycle arrest in A549 cells through p53 accumulation via c-Jun NH2-terminal kinase-mediated phosphorylation at serine 15 in vitro and in vivoJ Pharmacol Exp Ther2006318248449416632641
- YangSJChangSCWenHCChenCYLiaoJFChangCHPlumbagin activates ERK1/2 and Akt via superoxide, Src and PI3-kinase in 3T3-L1 cellsEur J Pharmacol20106381–3212820420821
- KaighnMENarayanKSOhnukiYLechnerJFJonesLWEstablishment and characterization of a human prostatic carcinoma cell line (PC-3)Invest Urol19791711623447482
- ChenTRChromosome identity of human prostate cancer cell lines, PC-3 and PPC-1Cytogenet Cell Genet1993622–31831848428522
- NupponenNNHyytinenERKallioniemiAHVisakorpiTGenetic alterations in prostate cancer cell lines detected by comparative genomic hybridizationCancer Genet Cytogenet1998101153579460501
- OhnukiYMarnellMMBabcockMSLechnerJFKaighnMEChromosomal analysis of human prostatic adenocarcinoma cell linesCancer Res19804035245347471073
- BeheshtiBParkPCSweetJMTrachtenbergJJewettMASquireJAEvidence of chromosomal instability in prostate cancer determined by spectral karyotyping (SKY) and interphase fish analysisNeoplasia200131626911326317
- OuyangDYXuLHHeXHAutophagy is differentially induced in prostate cancer LNCaP, DU145 and PC-3 cells via distinct splicing profiles of ATG5Autophagy201391203223075929
- FeldmanJLDittenhafer-ReedKEDenuJMSirtuin catalysis and regulationJ Biol Chem201228751424194242723086947
- WulfkuhleJDLiottaLAPetricoinEFProteomic applications for the early detection of cancerNat Rev Cancer20033426727512671665
- EverleyPAKrijgsveldJZetterBRGygiSPQuantitative cancer proteomics: stable isotope labeling with amino acids in cell culture (SILAC) as a tool for prostate cancer researchMol Cell Proteomics20043772973515102926
- DeebSJD’SouzaRCCoxJSchmidt-SupprianMMannMSuper-SILAC allows classification of diffuse large B-cell lymphoma subtypes by their protein expression profilesMol Cell Proteomics2012115778922442255
- DeebSJCoxJSchmidt-SupprianMMannMN-linked glycosylation enrichment for in-depth cell surface proteomics of diffuse large B-cell lymphoma subtypesMol Cell Proteomics201413124025124190977
- LamYWMobleyJAEvansJECarmodyJFHoSMMass profiling-directed isolation and identification of a stage-specific serologic protein biomarker of advanced prostate cancerProteomics20055112927293815952230
- SardanaGMarshallJDiamandisEPDiscovery of candidate tumor markers for prostate cancer via proteomic analysis of cell culture-conditioned mediumClin Chem200753342943717259234
- Al-RuwailiJALarkinSEZeidanBADiscovery of serum protein biomarkers for prostate cancer progression by proteomic analysisCancer Genomics Proteomics2010729310320335524
- SkvortsovSSchäferGStasykTProteomics profiling of micro-dissected low- and high-grade prostate tumors identifies Lamin A as a discriminatory biomarkerJ Proteome Res201110125926820977276
- Gonzalez-AnguloAMHennessyBTMillsGBFuture of personalized medicine in oncology: a systems biology approachJ Clin Oncol201028162777278320406928
- TianQPriceNDHoodLSystems cancer medicine: towards realization of predictive, preventive, personalized and participatory (P4) medicineJ Intern Med2012271211112122142401