
Abstract
Background
Identifying the potential for drug-induced kidney injury is essential for the successful research and development of new drugs. Newer and more sensitive preclinical drug-induced kidney injury biomarkers are now qualified for use in rat toxicology studies, but biomarkers for clinical studies are still undergoing qualification. The current studies investigated biomarkers in healthy volunteer (HV) urine samples with and without the addition of stabilizer as well as in urine from patients with normoalbuminuric diabetes mellitus (P-DM).
Methods
Urine samples from 20 male HV with stabilizer, 69 male HV without stabilizer, and 95 male DM without stabilizer (39 type 1 and 56 type 2) were analyzed for the following bio-markers using multiplex assays: α-1-microglobulin (A1M), β-2-microglobulin, calbindin, clus-terin, connective tissue growth factor (CTGF), creatinine, cystatin-C, glutathione S-transferase α (GSTα), kidney injury marker-1 (KIM-1), microalbumin, neutrophil gelatinase-associated lipocalin, osteopontin, Tamm–Horsfall urinary glycoprotein (THP), tissue inhibitor of metalloproteinase 1, trefoil factor 3 (TFF3), and vascular endothelial growth factor.
Results
CTGF and GSTα assays on nonstabilized urine were deemed nonoptimal (>50% of values below assay lower limits of quantification). “Expected values” were determined for HV with stabilizer, HV without stabilizer, and P-DM without stabilizer. There was a statistically significant difference between HV with stabilizer compared to HV without stabilizer for A1M, CTGF, GSTα, and THP. DM urine samples differed from HV (without stabilizer) for A1M CTGF, GSTα, KIM-1, microalbumin, osteopontin, and TFF3. A1M also correctly identified HV and DM with an accuracy of 89.0%.
Summary
These studies: 1) determined that nonstabilized urine can be used for assays under qualification; and 2) documented that A1M, CTGF, GSTα, KIM-1, microalbumin, osteopontin, and TFF3 were significantly increased in urine from P-DM. In addition, the 89.0% accuracy of A1M in distinguishing P-DM from HV may allow this biomarker to be used to monitor efficacy of potential renal protective agents.
Keywords:
Introduction
The shortcomings of traditional renal function laboratory biomarkers are illustrated by the fact that kidney function can decrease by more than 50% without any notable elevation in serum creatinine.Citation1–Citation4 Newer and potentially more sensitive and informative assays are now available, many of which have been qualified by regulatory agencies (European Medicines Agency, US Food and Drug Administration, and Pharmaceuticals and Medical Devices Agency) for preclinical/rat studies.Citation5–Citation7 Given the high level of candidate compound attrition during drug development because of kidney toxicity/injury,Citation8 newer biomarkers are now undergoing qualification for use in clinical settings with the goal of earlier detection of drug-induced kidney injury.Citation9
Biomarker qualification for clinical use is a stepwise process.Citation10 Potential biomarkers are identified, commercial assays developed, and summary statistics (95% confidence intervals, inter- and intrasubject variability) are determined for stabilized urine samples, typically collected from healthy volunteers (HVs).Citation9 Thereafter, qualification requires evaluation in disease populations and in subjects exposed to known nephrotoxicants. Sample handling and stability data collected during these studies can also determine the practicality of including these biomarkers in routine clinical assessments.
Given its association with kidney injury/damage, diabetes mellitus is a key disease in which to qualify new kidney biomarkers – reference values are needed for patients with normoalbuminuric diabetes mellitus (P-DM), against which to assess drug effects. In the hospital and medical care setting, α-1-microglobulin (A1M), β-2-microglobulin (B2M), neutrophil gelatinase-associated lipocalin (NGAL), cystatin-C, and kidney injury marker-1 (KIM-1) are known to be increased in people with type 1 and/or 2 diabetes, with A1M, B2M, and NGAL being increased prior to the development of albuminuria.Citation11–Citation17 It remains unknown, however, whether these or any of the other newer biomarkers are altered in P-DM, ie, those participating in typical diabetes-drug clinical trials. Therefore, urine biomarker data from this patient population can advance the renal safety biomarker qualification process. It is also conceivable that these same biomarkers could serve as efficacy biomarkers during the development of drugs targeting the amelioration of diabetic renal disease.
Preanalytical sample variability attributable to sample instability, as well as storage condition effects and sample stabilizer requirements, must be determined during biomarker qualification. The need for the addition of stabilizer at the time of sample collection is important as this will determine the feasibility of retrospective analyses of samples collected in typical clinical studies. Otherwise, qualified urine biomarker analyses in clinical studies would require specification for stabilizer addition and this would limit these analyses to prospective studies. The need to retrospectively analyze samples is particularly relevant should a study unexpectedly uncover a signal suggesting potential kidney injury. Therefore, qualification studies need to determine if samples stored using standard procedures (without stabilizer): yield numerical values similar to samples stored with stabilizer; yield different numerical values that would be interpretable within a given study; or cannot be used. This could mean that separate reference intervals are necessary (with versus without stabilizer) or that the nonstabilized samples must be rejected.
The objectives of the studies reported here included: 1) to determine biomarker values in HVs and to determine whether the addition of a stabilizer (biotrin) alters the biomarker values in urine collected from HVs; and 2) to determine biomarker levels in nonstabilized urine from P-DM (type 1 and type 2) and to compare the values to those obtained from HVs (without stabilizer).
Materials and methods
Clinical studies
The studies in this report were performed in accordance with the ethical principles in the Declaration of Helsinki and Good Clinical Practice, including written informed consent and approval by the appropriate Ethics Review Boards.
There were two separate HV studies: HV study 1 has been previously reported.Citation9 A key feature of this study is that urine samples were processed with stabilizer. HV study 2 was designed to provide a comparator to study 1, with urines collected and stored without stabilizer. The Diabetic Retinopathy Candesartan Trials (DIRECT) program was the source of the samples from P-DM. DIRECT consisted of three studies (Prevent 1: N=1,421, Protect 1: N=1,905, and Protect 2: N=1,905).Citation18–Citation21 Two studies (Prevent 1 and Protect 1) enrolled patients with type 1 diabetes, with the Prevent 1 study enrolling patients without retinopathy and the Protect 1 study enrolling patients with mild to moderate retinopathy. The third study (Protect 2) enrolled patients with type 2 diabetes with mild to moderate retinopathy.
HV studies
Eligibility criteria as well as sample collection methods were the same in HV study 1 and HV study 2 as described in Brott et alCitation9 and were similar to those for a typical Phase I clinical study.
Briefly, urine from 20 males between the ages of 18 and 70 years was processed with stabilizer for HV study 1, and urine from 69 males between the ages of 18 and 55 years was processed without stabilizer for HV study 2.
At approximately 8:00 am, a spot urine sample was collected (up to 120 mL) and placed on ice as soon as possible. Up to 50 mL of urine was centrifuged at 2,000× g at 4°C for 10 minutes, the supernatant was collected, and biotrin urine stabilizer added at a ratio of 1:4 (for HV study 1). Aliquots of 1.5 mL were delivered to labeled tubes and frozen at −80°C until shipment to the analytical laboratory (Rules Based Medicine, Austin, TX, USA) where the samples were thawed and analyzed using multiplex assay/assays for A1M, B2M, calbindin, clusterin, connective tissue growth factor (CTGF), creatinine, cystatin-C, glutathione S-transferase α (GSTα), KIM-1, microalbumin, NGAL, osteopontin, Tamm–Horsfall urinary glycoprotein (THP), tissue inhibitor of metalloproteinase 1 (TIMP-1), trefoil factor 3 (TFF3), and vascular endothelial growth factor (VEGF).
Diabetic studies
The eligibility criteria, materials, and methods for the DIRECT diabetic studies have been previously reported.Citation18–Citation21
Briefly, the trials enrolled patients with stable diabetic control, who were normoalbuminuric (urinary albumin excretion rate [UAER] <20 μg/min), with serum creatinine ≤1.5 mg/dL (men), and who were normotensive (blood pressure ≤130/85 mmHg). Protect 2 also allowed enrolment of hypertensive patients, if controlled (blood pressure ≤160/90 mmHg).
The urine samples from the patients in the DIRECT studies were from overnight timed urine collections at the baseline visit and were processed without stabilizer. The samples were shipped to a central laboratory and stored at −80°C (storage times ranged from 4 to 8 years). The samples were then sent frozen to P Rossing at STENO where the designated samples were thawed and refrozen after an aliquot was forwarded to Rules Based Medicine. There, the urine was again thawed and analyzed using multiplex assays for A1M, B2M, calbindin, clusterin, CTGF, cystatin-C, GSTα, KIM-1, microalbumin, NGAL, osteopontin, THP, TIMP-1, TFF3, and VEGF. The 200 DIRECT samples analyzed were selected at random with stratification for study. Only the samples from the males (n=95) are included in this report so as to allow for comparison with the all-male HV studies.
Data analysis
Summary statistics were assessed for biomarkers in each corresponding database (biomarker concentration). Subsequently, potential outliers were identified and omitted in the summary statistics provided. The P-values were adjusted for multiplicity due to the number of biomarkers, using the Benjamini and Hochberg False Discovery Rate method.Citation22
All analyses were carried out using SAS® 9.3.
Results
Demographics
The subject characteristics were similar for the two HV studies. The mean age of the subjects for these studies was also similar, ie, 38.5 and 34.2 years of age for study 1 (with stabilizer) and study 2 (without stabilizer), respectively ().
Table 1 Study demographics (age)
The eligibility criteria were similar for the two type 1 diabetic studies (Prevent 1 and Protect 1) with the exception that the Prevent 1 study patients did not have retinopathy and the Protect 1 study patients did have retinopathy. The mean age of both studies was similar, ie, 26.5 and 31.7 years for the Prevent 1 and Protect 1 studies, respectively. As expected, the mean age of the type 2 diabetic patients (58.2 years) was older than the HV and diabetic type 1 subjects.
Assay sensitivity
Assay sensitivity, expressed as the percent of values below the lower limit of quantification (LLOQ), is displayed in . The assay for CTGF was deemed nonoptimal (insensitive) since greater than 50% of the subject samples from HV subjects with stabilizer, HV subjects without stabilizer, and P-DM were below the assay LLOQ.
Table 2 Assay sensitivity
The GSTα assay was deemed nonoptimal as none of the HV samples with stabilizer values were below LLOQ, but greater than 50% of the HVs without stabilizer values and P-DM values (without stabilizer) were below LLOQ.
Unexpectedly, it appeared that the TIMP-1 assay may be more sensitive when stabilizer is not added to the samples as 84% of the samples were below LLOQ in HV subjects with stabilizer, while only 36% of the HV samples without stabilizer and 25% of samples from P-DM were below LLOQ.
All of the other parameters had less than 50% of the values below LLOQ for each of the subject/patient types, and the following parameters had less than 10% of the samples below LLOQ for all subject/sample types: A1M, B2M, calbindin, clusterin, creatinine, cystatin-C, KIM-1, osteopontin, THP, and VEGF.
HV samples
Much of the published kidney biomarker qualification data has evaluated samples stored with stabilizer from prospective studies.Citation9 contains concentration values comparing kidney biomarker analyses performed on urine with stabilizer (HV study 1) and urine processed without stabilizer (HV study 2). Only four parameters differed significantly between HV samples without stabilizer as compared to with stabilizer; A1M, CTGF, and GSTα were lower and THP was higher in HV samples without stabilizer. The rest of the parameters had comparable summary statistics with regard to stabilized versus nonstabilized specimens.
Table 3 Summary statistics of HV samples (concentration)
Diabetic patient samples
There were no statistical differences between the kidney biomarker data within the two type 1 diabetic studies (Prevent 1 and Protect 1), nor between the biomarker data within the subjects with type 1 and type 2 (Protect 2) diabetes (data not shown). Accordingly, the data from the three diabetic studies were pooled for statistical analysis.
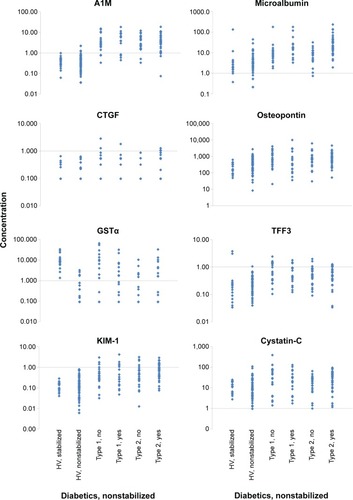
Seven of the 14 biomarkers were significantly higher in the samples from P-DM (without stabilizer) than the HVs without stabilizer (). A1M and GSTα were more than tenfold higher in the P-DM than HVs. Microalbumin concentration was more than fivefold higher in participants with diabetes (27.34±45.57 μg/mL versus 3.97±6.76 μg/mL), even though the subjects were considered normoalbuminuric (UAER <20 μg/min). The following four parameters were significantly increased by more than twofold but less than fivefold: CTGF, KIM-1, osteopontin, and TFF3. In addition to the statistical analysis shown in , the individual data points for A1M, CTGF, Cystatin-C, GSTα, KIM-1, microalbumin, osteopontin, and TFF3 are displayed in . Microalbumin was >20 mg/L in 31% of the diabetic participants, even though each subject was deemed normoalbuminuric based on UAER levels of <20 μg/min. A1M distinguished between HVs and participants with diabetes with an accuracy of 89.0%, sensitivity of 86.3%, and specificity of 94.2%, based on a cutoff of 1.0 μg/mL. The exact same results (accuracy, sensitivity, and specificity) were observed when a cutoff of 1.70 mg A1M/mmol creatinine was used on the normalized A1M data (data not shown).
Table 4 Summary statistics comparing HV and subjects with diabetes
Figure 1 Biomarker comparison of urine from healthy volunteers and subjects with diabetes for A1M, CTGF, Cystatin-C, GSTα, KIM-1, microalbumin, osteopontin, and TFF3.
Abbreviations: A1M, α-1-microglobulin; CTGF, connective tissue growth factor; GSTα, glutathione S-transferase α; HV, healthy volunteer; KIM-1, kidney injury marker-1; TFF3, trefoil factor 3.
Discussion
The objectives of the studies reported here included: 1) to determine biomarker values in HVs and to determine whether the addition of a stabilizer (biotrin) alters the biomarker values in urine collected from HVs; and 2) to determine biomarker levels in nonstabilized urine from P-DM (type 1 and type 2), and to compare the values to those obtained from HVs (without stabilizer).
The assays for CTGF in both stabilized and nonstabilized urine, GSTα in nonstabilized urine, and TIMP-1 in stabilized urine were deemed nonoptimal as the majority of the samples from HVs were below LLOQ. In addition, A1M was lower and THP was higher in HV samples without stabilizer, compared to with stabilizer, indicating that separate stabilized and nonstabilized reference ranges may be required for these biomarkers. In addition, several biomarkers were higher in P-DM than HVs when both urine types were without stabilizer.
Urinary biomarker data can be reported several different ways: as a concentration, as the amount excreted over a specified time period, or normalized to creatinine. We reported all urinary biomarker data as concentrations, consistent with the earlier findings of the preference for concentrations relative to creatinine-normalized data during qualification of the biomarkers.Citation9 The concentration data from the current studies revealed no significant differences between stabilized and nonstabilized urine for the following parameters: B2M, calbindin, clusterin, cystatin-C, KIM-1, microalbumin, NGAL, osteopontin, THP, TFF3, and VEGF. There were differences between HVs stabilized and nonstabilized urine for some of the biomarkers under qualification, including those assays which were deemed optimal. The CTGF and GSTα assay were nonoptimal assays for use with nonstabilized samples since more than 50% of the nonstabilized samples were below the assay LLOQ. Conversely, the THP assay was not optimal for stabilized samples as greater than 80% of these samples were below LLOQ. Although an acceptable assay, TIMP-1 was different in HVs without stabilizer than HVs with stabilizer. There is no apparent explanation for the higher TIMP-1 values in the nonstabilized urine samples, compared to stabilized urine samples.
Since nonstabilized urine was determined to be an acceptable matrix for most of the biomarkers under qualification, comparisons between the stored samples of HVs and P-DM were possible. The biomarkers A1M, CTGF, GSTα, KIM-1, microalbumin, osteopontin, and TFF3 were significantly higher in the diabetic subjects, compared to HVs without stabilizer. There were age differences between subjects with type 1 and type 2 diabetes, but there were no significant bio-marker differences across age groups. This could reflect that the duration of the diabetes was approximately comparable across the three diabetes studies (Prevent 1: 6.7 years; Protect 1: 11 years; Protect 2: 8.8 years).
Our findings are similar to literature reports in that the tubule biomarkers A1M, KIM-1, and TFF3 were higher in patients with normoalbuminuric diabetes, compared to HVs.Citation16,Citation23–Citation28 Diabetic nephropathy is commonly described as “glomerulopathy”,Citation29 but there is debate as to the degree of and timing of tubular nephropathy.Citation26,Citation30–Citation32 UAER and A1M are two biomarkers that have been used to distinguish between glomerular and proximal tubular damage, respectively. UAER reflects glomerular permeability with the large molecular weight protein albumin appearing when there is glomerular injury. The biomarker A1M is a small molecular weight protein (less than 40,000 kd). In the healthy kidney, it is freely filtered through the glomerulus; approximately 95% is then reabsorbed and catabolized by the proximal tubular cells. With tubular injury, tubular reabsorption is decreased so that A1M appears increasingly in excreted urine.Citation33 The subjects with diabetes in our studies were normoalbuminuric based on UAER, but the tubular A1M, KIM-1, and TFF3 biomarkers were increased in these subjects, supporting the hypothesis that tubular injury is an early event in diabetes.
Of interest was the finding that our studies successfully identified HVs and persons with normoalbuminuric diabetes using A1M with 89% accuracy. This suggests that A1M is a biomarker with the potential to discriminate between healthy subjects and diabetics in early stages of nephropathy. It might also serve as a marker of the efficacy of “renal protective agents”. The biomarker differences observed in persons with diabetes compared to HVs could be due to early renal injury, hyperglycemic state, or even age. Further studies will be needed to determine the reason/reasons behind the biomarker differences.
In our studies, the mean level of NGAL in normoalbuminuric diabetic patients was approximately double that found in HVs but was not statistically significantly higher. This is contrary to the findings of Nielsen et alCitation27 who reported urinary NGAL in normoalbuminuric subjects with type 1 diabetes was significantly (P<0.05) higher, more than doubled compared to HVs.
A limitation of our studies comparing the stabilized and nonstabilized preanalytical processing in HV samples is that the data came from two different studies. A study comparing stabilized and nonstabilized samples from the same subject could eliminate interpatient variability or other potential sources of confounding.
The data in the current studies suggest that nonstabilized urine can be used during the qualification process and that nonstabilized urine samples collected in typical clinical trials could be used in the future to evaluate a compound’s potential to induce kidney injury during drug development. However, it may be necessary to generate independent stabilized and nonstabilized reference intervals for some of the biomarkers.
In conclusion, these studies advanced the qualification process of the urinary biomarkers by: 1) determining that non-stabilized urine samples can be used for most of the biomarkers under qualification, which will enable retrospective sample analysis during qualification and urine samples collected in typical standard studies to be used post the qualification process; and 2) documenting increased levels of A1M, CTGF, GSTα, KIM-1, microalbumin, osteopontin, and TFF3 in P-DM. In addition, the 89.0% accuracy of A1M distinguishing P-DM and HVs typically enrolled in clinical trials suggests tubular injury may occur prior to glomerular injury, as well as suggesting that A1M could be further investigated as a bio-marker to monitor efficacy of potential renal protective agents. Therefore, the biomarkers under investigation have passed this qualification step, with biomarker levels (A1M, CTGF, GSTα, KIM-1, microalbumin, osteopontin, and TFF3) being increased in the subjects with diabetes. However, limitations of some biomarkers have been identified: CTGF and GSTα assays are nonoptimal assays for use with nonstabilized urine, although they were higher in subjects with diabetes, and some biomarkers may require separate expected/normal ranges for stabilized and nonstabilized urine. Additional studies are needed in the stepwise qualification process to determine the utility of each biomarker and appropriate cutoffs between normal and injury for each biomarker.
Acknowledgments
In memory of Anne Katrin Sjølie who was the Lead of the Steering Committee and was the Principle Investigator for the DIRECT program.
DIRECT Programme Study Steering Committee: Anne Katrin Sjølie (Odense University Hospital, Odense, Denmark), Rudy Bilous (South Cleveland Hospital, Middles-brough, UK), Nish Chaturvedi (Imperial College School of Medicine, London, UK), Ywonne Fox (AstraZeneca, Molndal, Sweden), John Fuller (University College London, London, UK), Michael George (Takeda, London, UK), Anders Svensson (AstraZeneca, Molndal, Sweden), James W Hainer (AstraZeneca, Wilmington, DE, USA, from September, 2007), Ronald Klein (University of Wisconsin, Madison, WI, USA), Trevor Orchard (University of Pittsburgh, Pittsburgh, PA, USA), Hans-Henrik Parving (University Hospital of Copenhagen, Copenhagen, Denmark), Massimo Porta (University of Turin, Turin, Italy), and Ingrid Warnold (AstraZeneca, Molndal, Sweden).
Disclosure
Authors DAB, STF, SHA, JWH, MP, and RBA were employees of AstraZeneca Pharmaceuticals when the experiments were conducted. The other authors report no conflicts of interest in this work.
References
- GuineeDGJrvan ZeeBHoughtonDCClinically silent progressive renal tubulointerstitial disease during cisplatin chemotherapyCancer19937112405040548508369
- ShemeshOGolbetzHKrissJPMyersBDLimitations of creati nine as a filtration marker in glomerulopathic patientsKidney Int19852858308382418254
- StarRATreatment of acute renal failureKidney Int1998546181718319853246
- UchinoSCreatinineCurr Opin Crit Care201016656256720736825
- DieterleFSistareFGoodsaidFRenal biomarker qualification submission: a dialog between the FDA-EMEA and Predictive Safety Testing ConsortiumNat Biotechnol201028545546220458315
- HarpurEEnnulatDHoffmanDBiological qualification of bio-markers of chemical-induced renal toxicity in two strains of male ratToxicol Sci2011122223525221593213
- OzerJSDieterleFTrothSA panel of urinary biomarkers to monitor reversibility of renal injury and a serum marker with improved potential to assess renal functionNat Biotechnol201028548649420458319
- CookDBrownDAlexanderRLessons learned from the fate of AstraZeneca’s drug pipeline: a five-dimensional frameworkNat Rev Drug Discov201413641943124833294
- BrottDAAdlerSHAraniRLovickSCPinchesMFurlongSTCharacterization of renal biomarkers for use in clinical trials: bio-marker evaluation in healthy volunteersDrug Des Devel Ther20148227237
- MatheisKLaurieDAndriamandrosoCA generic operational strategy to qualify translational safety biomarkersDrug Discov Today20111613–1460060821570476
- FuWJLiBLWangSBChanges of the tubular markers in type 2 diabetes mellitus with glomerular hyperfiltrationDiabetes Res Clin Pract201295110510922015481
- FuWJXiongSLFangYGUrinary tubular biomarkers in short-term type 2 diabetes mellitus patients: a cross-sectional studyEndocrine2012411828821779943
- HongCYHughesKChiaKSNgVLingSLUrinary alpha 1-microglobulin as a marker of nephropathy in type 2 diabetic Asian subjects in SingaporeDiabetes Care20032633834212547859
- MatysUBachorzewska-GajewskaHMalyszkoJDobrzyckiSAssessment of kidney function in diabetic patients. Is there a role for new biomarker NGAL, cystatin C and KIM-1?Adv Med Sci201358235336124384771
- NautaFLBoertienWEBakkerSJGlomerular and tubular damage markers are elevated in patients with diabetesDiabetes Care201134497598121307379
- PetricaLPetricaMVladAProximal tubule dysfunction is dissociated from endothelial dysfunction in normoalbuminuric patients with type 2 diabetes mellitus: a cross-sectional studyNephron Clin Pract20111182c155c16421150223
- ShoreNKhurshidRSaleemMAlpha-1 microglobulin: a marker for early detection of tubular disorders in diabetic nephropathyJ Ayub Med Coll Abbottabad2010224535522455261
- SjølieAKPortaMParvingHHBilousRKleinRDIRECT Programme Study GroupThe Diabetic REtinopathy Candesartan Trials (DIRECT) Programme: baseline characteristicsJ Renin Angiotensin Aldosterone Syst200561253216088848
- SjølieAKKleinRPortaMEffect of candesartan on progression and regression of retinopathy in type 2 diabetes (DIRECT-Protect 2): a randomized placebo-controlled trialLancet200837296471385139318823658
- ChaturvediNPortaMKleinREffect of candesartan on prevention (DIRECT-Prevent 1) and progression (DIRECT-Protect 1) of retinopathy in type 1 diabetes: randomised, placebo-controlled trialsLancet2008374296471394140218823656
- BilousRChaturvediNSjølieAKEffect of candesartan on microalbuminuria and albumin excretion rate in diabetesAnn Intern Med20091511112019451554
- BenjaminiYHochbergYControlling the False Discovery Rate: A Practical and Powerful Approach to Multiple TestingJournal of the Royal Statistical Society. Series B (Methodological)1995571289300
- AstorBCKöttgenAHwangSJBhavsarNFoxCSCoreshJTrefoil factor 3 predicts incident chronic kidney disease: a case-control study nested within the Atherosclerosis Risk in Communities (ARIC) studyAm J Nephrol201134429129721829008
- GalantiLMJamartJDell’omoJDonckierJComparison of urinary excretion of albumin, alpha1-microglobulin and retinol-binding protein in diabetic patientsDiabetes Metab19962253243308896994
- KordonouriOJörresAMüllerCEndersIGahlGMWeberBQuantitative assessment of urinary protein and enzyme excretion – a diagnostic programme for the detection of renal involvement in type I diabetes mellitusScand J Clin Lab Invest19925287817901488617
- PfleidererSZimmerhacklLBKinneRManzFSchulerGBrandisMRenal proximal and distal tubular function is attenuated in diabetes mellitus type 1 as determined by the renal excretion of alpha 1-microglobulin and Tamm-Horsfall proteinClin Investig19937112972977
- NielsenSESchjoedtKJAstrupASNeutrophil Gelatinase-Associated Lipocalin (NGAL) and Kidney Injury Molecule 1 (KIM1) in patients with diabetic nephropathy: a cross-sectional study and the effects of lisinoprilDiabet Med2010271011471150
- WaltonCBodanskyHJWalesJKForbesMACooperEHTubular dysfunction and microalbuminuria in insulin dependent diabetesArch Dis Child19886332442492451477
- MauerSMSteffesMWBrownDMThe kidney in diabetesAm J Med19817036036127011015
- ThomasMCBurnsWCCooperMETubular changes in early diabetic nephropathyAdv Chronic Kidney Dis200512217718615822053
- HongCYChiaKSMarkers of diabetic nephropathyJ Diabetes Complications199812143609442815
- KordonouriOKahlAJörresAHopfenmüllerWMülerCDanneTThe prevalence of incipient tubular dysfunction, but not of glomerular dysfunction, is in creased in patients with diabetes onset in childhoodJ Diabetes Complications1999135–632032410765010
- YuHYanagisawaYForbesMACooperEHCrocksonRAMacLennanICAlpha-1-microglobulin: an indicator protein for renal tubular functionJ Clin Pathol1983362532596186698