
Abstract
Objective
This study was conducted to evaluate the macular status of patients treated with hydroxychloroquine before and after cessation of treatment.
Methods
Forty-two patients with systemic lupus erythematosus underwent ocular examination based on visual acuity evaluation, optical coherence tomography retinal thickness measurements, and multifocal electroretinography (mfERG) records at first visit. The tests were repeated 6 months after treatment withdrawal and compared to the findings at their first visit.
Results
Mean visual acuity (measured in log minimum angle of resolution) of both eyes was statistically increased after hydroxychloroquine discontinuation (difference in means: 0.06 [P<0.0001] and 0.01 [P=0.003] for the right and left eyes, respectively). Retinal response amplitudes of central and peripheral areas were significantly improved for both eyes. The following values were observed for central responses: the difference in means was −19.9 (P<0.0001) and −13.6 (P<0.0001) for the right eye and the left eye, respectively; for peripheral responses, difference in means was −10.3 (P<0.0001) and −9.5 (P<0.0001) for right eye and left eye, respectively, after the 6-month examination. There were no statistically significant differences in the retinal thickness of patients after cessation of treatment. The visual acuity of the patients was correlated to central and peripheral mfERG responses (r=−0.53 [P<0.0001] and r=−0.53 [P<0.0001], for the right eye and the left eye, respectively).
Conclusion
The visual acuity of patients receiving hydroxychloroquine improves along with the amplitudes of the mfERG responses 6 months after discontinuation of the drug, but no difference in retinal thickness is identified.
Introduction
Chloroquine and hydroxychloroquine are the most common antimalarials used for the treatment of autoimmune and connective tissue diseases, including systemic lupus erythematosus, rheumatoid arthritis, psoriatic arthritis, palindromic rheumatism, dermatomyositis, Sjögren’s syndrome, and juvenile chronic arthritis.Citation1 Although chloroquine and hydroxychloroquine are chemically similar 4-aminoquinolines, differing only by an ethyl group, the latter exhibits almost half the efficacy and toxicity as compared with the former.Citation1 Modification of the cellular microenvironment induces changes in inflammatory mediators and receptor activity, as well as changes in production of proteins and autoantibodies.Citation1 The most common side effects of antimalarials include gastrointestinal cramps and nausea, skin lesions, and central nervous system symptoms that are usually reversible.Citation1 Hydroxychloroquine has been also implicated in cardiomyopathy, vacuolar myopathy, and hypoglycemia observed in patients with type 2 diabetes mellitus, while massive liver cell necrosis has been also referred to as a side effect of hydroxychloroquine.Citation2–Citation6 Hyperpigmented deposits of nails, mucosa, and skin, composed of melanin and hemosiderin within histiocytes, are frequently seen 1 year after therapy, while they start fading 2–6 months after cessation of the drug.Citation7
Deposits of antimalarials on cornea, ciliary body, lens, and retina have been associated with ocular side effects, usually reversible after the discontinuation of treatment.Citation8 Antimalarial drug-induced keratopathy patterns vary from diffuse punctuate opacities to radial and whirling lines (Hudson–Stahli line), resulting in halos and photophobia.Citation8 Although defective accommodation and lens opacities have been described with chloroquine, these are rare complications under hydroxychloroquine treatment.Citation8 The prevalence of hydroxychloroquine retinopathy ranges from 0% to 4% and it is related to the daily dose, the duration of treatment, the presence of other retinal disease, as well as the kidney and liver function.Citation9 However, some authors estimate that the percentage of toxic maculopathy reaches up to 13.1%.Citation10 The risk of hydroxychloroquine-induced toxicity has been appreciated to be of very low risk for doses <6.5 mg/kg/day (200–400 mg/day) and a cumulative dose <1,000 g.Citation8,Citation9,Citation11 The toxicity of the drug is based on disturbances in ganglion cells and photoreceptors, in addition to the binding of melanin to the retinal pigment epithelium.Citation9,Citation11 Basic ocular examination is recommended before starting treatment and then, annual examination, including visual acuity measurement, fundoscopy, and visual field examination, should be done.Citation9,Citation11 Fundoscopy is normal in early stages, followed by pigment disturbances, vascular attenuation, and finally, bull’s eye maculopathy in advanced stages.Citation8,Citation9 Visual field examination reveals subtle usually superior scotomas, within ten grades of fixation, which are enlarged over time.Citation9 Retinal dysfunction even in early stages can be defined with multifocal electroretinography (mfERG), while spectral domain optical coherence tomography (spectral domain-OCT) can detect thinning of retinal layers.Citation9,Citation11,Citation12 The follow-up of the patients is essential, given that delayed onset of hydroxychloroquine retinopathy, 1 year after discontinuation of treatment, has also been reported.Citation8,Citation13 The purpose of this study was to identify structural and functional changes in the retina of patients who stopped hydroxychloroquine treatment for 6 months, using optical coherence tomography and mfERG recording.
Patients and methods
Patients
Forty-two patients with systemic lupus erythematosus were included in this retrospective, nonrandomized study, which was conducted at the First University Eye Clinic of General Hospital of Athens G. Gennimatas. All patients received 400 mg/day hydroyxchloroquine (tb Plaquenil 200 mg; Sanofi-Aventis, Laval, QC, Canada) in divided doses and the mean duration of the treatment was 12 months. After the first ocular examination all patients stopped hydroyxchloroquine according to their physician’s advice. The cessation of treatment had been already decided and scheduled for all patients independently of our protocol. No toxicity was mentioned by patients’ physicians. To calculate adjusted daily dose, the lesser of the ideal body weight based on height and actual body weight was used as the operative weight and the formula was daily dose (in mg/day)/[operative weight (in pounds)/(2.2 pounds/kg)]. Three patients were found with dosages higher than the recommended 6.5 mg/kg/day and were excluded from our study. Patients included in the study had a cumulative dose of lower than 1,000 g. The protocol used was approved by the ethics committee of the University Hospital, and all patients gave written informed consent.
Assessment of visual acuity
Best-corrected visual acuity was measured for both eyes of all patients using Snellen optotype at the first visit and 6 months after the cessation of therapy.
OCT examination
OCT examination was performed with the Stratus OCT Model 3000 (Carl Zeiss Meditec, Dublin, CA, USA), using the retinal mapping software. All eyes were scanned in a radial spoke pattern centered on the foveola with scan length of 6 mm.
The retinal thickness was calculated as the distance between the two boundaries along each A-scan, based on the attached automatic boundary detection software. The participants underwent the examination at the first visit and 6 months after the discontinuation of hydroxychloroquine.
Multifocal electroretinography
The records of the mfERG correspond to the combined responses of photoreceptors, bipolar cells, and Muller cells. mfERG was conducted using VERIS III visual evoked response imaging system (Tomey, Nagoya, Japan). The stimulus matrix consisted of 61 pattern scaled segments displayed on a cathode ray tube color monitor (Sony, Tokyo, Japan), driven at a frame rate of 72 Hz. Each hexagon was independently alternated between black and white at a rate of 72 Hz. The radius of the stimulus array was approximately 20° high and 25° wide. The bandwidth of the amplifier was 10–300 Hz and the amplification was ×10,000. The pupils of the patients were dilated using tropicamide 0.5% and phenylephrine 5%, and all patients were optically corrected for near vision. A gold-foil electrode was inserted under the lower eyelid, a reference one was placed on the ipsilateral skin, posterior to the lateral orbital rim, and the ground electrode was attached to the earlobe. The duration of the data acquisition was 4 minutes, divided into four sessions of 60 seconds. Patients’ fixation was monitored using a fundus camera system, while the fellow eye was closed. The recording procedure was repeated whenever there were spurious potentials from eye blinks or whenever ocular movements were recorded.
The response density (amplitude per unit retinal area, in nanovolts per square degree or nV/deg2) of each local response was estimated as the dot product between the normalized response template and each local response. The following anatomic areas were defined for evaluation of the retinal responses: ring 1 to the fovea (0°–2°), ring 2 to the parafovea (2°–7°), ring 3 to the perifovea (7°–13°), ring 4 to the near periphery (3°–22°), and ring 5 to the central part of the middle periphery (22.0°–30.5°). The amplitude of each group was scaled to reflect the angular size of the stimulus hexagon that produces the response. The protocol followed the recommended guidelines of the International Society of Electrophysiology of Vision for basic mfERG. All the patients underwent the examination at the first visit and 6 months after the cessation of hydroxychloroquine.
Statistical analysis
The statistical software SPSS Statistics 22.0 was used for the analysis. The normality of the distribution of all variables was controlled with nonparametric Kolmogorov–Smirnov analysis. Assessing the functional changes in vision related to discontinuation of hydroxychloroquine, individual comparisons of visual acuity measurements were made between the two eyes, based on nonparametric Wilcoxon test. The toxic effect of hydroxychloroquine on retina was also evaluated using paired t-tests for the values of retinal thickness and mfERG responses. The correlation between visual acuity and mfERG responses was expressed using Pearson’s correlation coefficient.
Results
Demographics
Forty-two patients with systemic lupus erythematosus participated in this study, including 18 males (43%) and 24 females (57%), with mean age of 47 years (standard deviation [SD]: 13 years). The mean duration of hydroxychloroquine medication was 12 (SD: 11) months.
Measurements of visual acuity
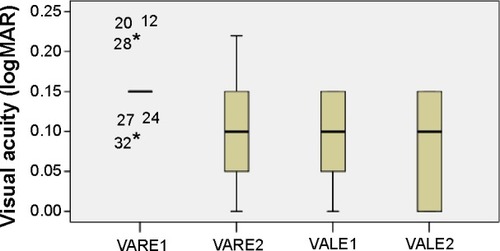
The mean visual acuity (VA in log minimum angle of resolution [logMAR]) at the time of first ocular examination was 0.15 (SD: 0.034) and 0.09 (SD: 0.051) for the right (VARE1) and left (VALE1) eye, respectively. The corresponding values for the right eye (VARE2) were 0.09 (SD: 0.064) and for the left one (VALE2) 0.08 (SD: 0.058) at the second visit (6 months later). The distribution of visual acuity measurements is shown in . Assessing the visual acuity, there is statistically significant increase for the right (difference in means: 0.06, standard error [SE]: 0.011, P<0.0001) and left (difference in means: 0.01, SE: 0.003, P=0.003) eye 6 months later.
Figure 1 VA distribution.
Abbreviations: logMAR, log minimum angle of resolution; VA, visual acuity; VALE1 and 2, VA of left eye at first and second visits, respectively; VARE1 and 2, VA of right eye at first and second visits, respectively.
Retinal thickness
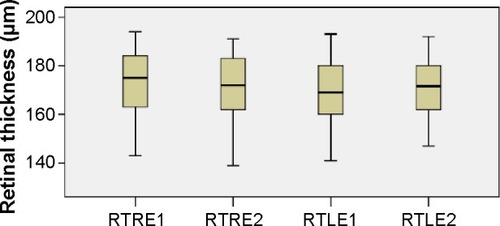
The calculations performed after the OCT revealed that the mean retinal thickness (in micrometers) of the right (RTRE1) and left (RTLE1) eye was 171.0 (SD: 15.2) and 169.1 (SD: 12.1), respectively, at the first examination. Six months later, the corresponding values for the right (RTRE2) and left (RTLE2) eye were 171.1 (SD: 14.3) and 170.4 (SD: 12.2), respectively. The mean values of retinal thickness (in micrometers) at the first and second visits are presented in the boxplots of . Comparing the mean values of retinal thickness between the first examination and the second one 6 months after discontinuation of hydroxychloroquine, no statically significant difference is revealed either for the right eye (difference in means: −0.1, SE: 0.6, P=0.906) or for the left one (difference in means: −1.2, SE: 0.8, P=0.150).
Figure 2 Retinal thickness distribution.
Abbreviations: RTLE1 and 2, retinal thickness of left eye at first and second visits, respectively; RTRE1 and 2, retinal thickness of right eye at first and second visits, respectively.
Records of mfERG
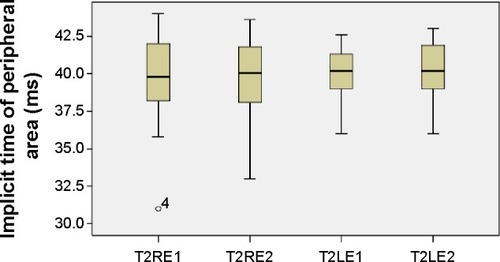
The mean values of the amplitudes (nanovolts per square degree) and implicit times (milliseconds) of both eyes’ central (mf1 and T1, respectively) and peripheral (mf2 and T2, respectively) responses at the first and second (6 months later) visits are presented in and –. There is a statistically significant increase in the central (right eye: difference in means −19.9, SE: 3.4, P<0.0001; left eye: difference in means −13.6, SE: 3.3, P<0.0001) and peripheral (right eye: difference in means −10.3, SE: 2.6, P<0.0001; left eye: difference in means −9.5, SE: 2.3, P<0.0001) amplitudes of both eyes 6 months after discontinuation of hydroxychloroquine. There are no significant differences in the implicit times of central (right eye: difference in means −0.1, SE: 0.1, P=0.254; left eye: difference in means 0.2, SE: 0.1, P=0.037) and peripheral (right eye: difference in means −0.1, SE: 0.2, P=0.650; left eye: difference in means −0.2, SE: 0.3, P=0.554) responses of both eyes after the cessation of medication.
Table 1 Mean values and standard deviation of amplitudes (mf) and implicit time (T) of the central and peripheral responses at the first and second visits
Figure 3 Amplitudes of central responses.
Abbreviations: LE, left eye; RE, right eye; mf, multifocal electroretinography reading; mf1RE1, central area, right eye, first visit; mf1RE2, central area, right eye, second visit; mf1LE1, central area, left eye, first visit; mf1LE2, central area, left eye, second visit; nV/deg2, nanovolts per degree squared.
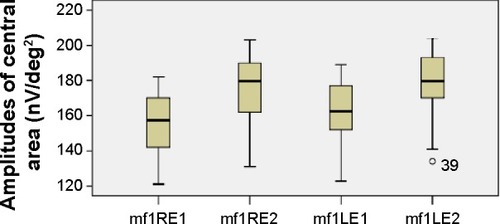
Figure 4 Amplitudes of peripheral responses.
Abbreviations: LE, left eye; RE, right eye; mf, multifocal electroretinography reading; mf2RE1, peripheral area, right eye, first visit; mf2RE2, peripheral area, right eye, second visit; mf2LE1, peripheral area, left eye, first visit; mf2LE2, peripheral area, left eye, second visit; nV/deg2, nanovolts per degree squared.
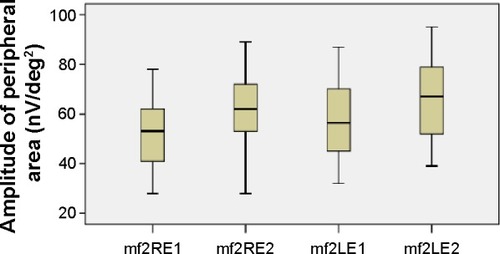
Figure 5 Implicit times of central responses.
Abbreviations: LE, left eye; RE, right eye; T1, time 1; T1LE1, central area, left eye, first visit; T1LE2, central area, left eye, second visit; T1RE1, central area, right eye, first visit; T1RE2, central area, right eye, second visit.
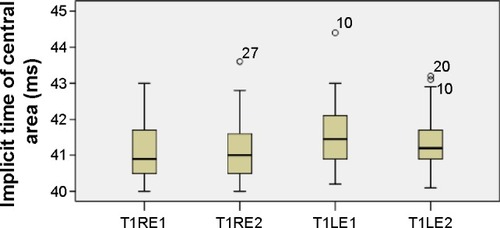
Figure 6 Implicit times of peripheral responses.
Abbreviations: LE, left eye; RE, right eye; T2LE1, peripheral area, left eye, first visit; T2LE2, peripheral area, left eye, second visit; T2RE1, peripheral area, right eye, first visit; T2RE2, peripheral area, right eye, second visit.
Correlation of visual acuity with mfERG responses
The visual acuity of the left eye seems to increase along with the amplitudes of central and peripheral responses (r=−0.55, P<0.0001 and r=−0.46, P=0.002, respectively) at the time of the first examination. However, there is no significant correlation between the aforesaid values assessing the right eye at the same time (r=0.09, P=0.586 and r=0.08, P=0.625, respectively). A significant negative correlation is also detected between the patients’ retinal responses and the visual acuity both at the central (r=−0.53, P<0.0001 and r=−0.53, P<0.0001, for the right and left eyes, respectively) and at the peripheral (r=−0.45, P=0.003 and r=−0.62, P<0.0001, for the right and left eyes, respectively) areas after 6 months without treatment. In addition, the visual acuity of both eyes seems to increase in parallel after the cessation of hydroxychloroquine (r=0.85, P<0.0001), but there is no strong relation at the first examination (r=0.02, P=0.915). Finally, no significant correlation is detected between the visual acuity of the right eye at the first and second visits (r=0.09, P=0.552). However, the visual acuity values of the left eye before and after discontinuation of medication appear to be strongly correlated (r=0.94, P<0.0001).
Discussion
Assessing hydroxychloroquine retinopathy, we presumed that there are statistically significant differences of visual acuity and amplitudes of mfERG responses between the first visit and after discontinuation of the drug 6 months later. Visual acuity (in logMAR) of patients participating in this study was increased for both eyes (right eye: difference in means 0.06, SE: 0.011, P<0.0001; left eye: difference in means 0.01, SE: 0.003, P=0.003) at the second visit. In addition, the amplitudes of the two eyes were significantly improved after treatment cessation for both central (right eye: difference in means −19.9, SE: 3.4, P<0.0001; left eye: difference in means −13.6, SE: 3.3, P<0.0001) and peripheral (right eye: difference in means −10.3, SE: 2.6, P<0.0001; left eye: difference in means −9.5, SE: 2.3, P<0.0001) responses. No statistically significant differences were observed in the implicit times of central and peripheral areas. A significant negative correlation was also detected between visual acuity and patients’ retinal responses after discontinuation of hydroxychloroquine, while the visual acuity of both eyes appears to be improved in parallel at the same time. However, the retinal thickness of both eyes did not present any statistical difference between patients’ examinations.
Abnormalities in mfERG have already been observed in patients taking hydroxychloroquine compared to healthy individuals.Citation14 Central and pericentral depression was detected in patients’ responses, even when the visual acuity was normal.Citation14 The mfERG response is a sensitive functional index representing not only the retinal abnormalities induced by hydroxychloroquine but also the changes observed after treatment withdrawal.Citation15 Improvement in mfERG response occurs along with visual acuity.Citation15 Aliferis et alCitation16 observed that the average implicit times of patients receiving hydroxychloroquine were significantly prolonged, but the amplitudes were not significantly impaired. They presumed that these values do not always change in parallel in toxic maculopathy caused by hydroxychloroquine.Citation16 Melles and MarmorCitation17 have recently reviewed ophthalmic studies that assessed hydroxychloroquine-induced retinopathy based on fundus photography and autofluorescence, visual field examination, spectral domain-OCT, and mfERG. They evaluated the incidence of retinopathy, after classifying the disease in three types: parafoveal (retinal changes 2°–6° from the fovea), pericentral (retinal changes >8° from the fovea), or mixed (retinal changes in both parafoveal and pericentral areas).Citation17 They presumed that the percentages of parafoveal, pericentral, and mixed retinal lesions were 76%, 12%, and 12%, respectively.Citation17
The reduction of mfERG amplitudes seems to correspond to the severity of histologic lesions and morphologic alterations observed in fundus autofluorescence, but the delay in implicit times is less frequent in toxic retinopathy of hydroxychloroquine.Citation18 This observation agrees with the findings of our study. mfERG can reveal early functional abnormalities, which are first detected in cones and the pericentral area, even in normal fundus.Citation18 The alterations of mfERG responses have been correlated with cumulative doses stronger than the daily dose.Citation19 Treatment withdrawal seems to result in improved retinal responses, affecting mainly their amplitudes, as we have also mentioned.Citation20 Moreover, the sensitivity and specificity of mfERG appear greater compared to visual acuity and color vision testing, Amsler grid, and full-field ERG, especially in evaluating cone dysfunction.Citation21,Citation22 Reduced central retinal responses could be helpful in differentiating hydroxychloroquine-induced maculopathy from other retinal diseases such as age-related macular degeneration.Citation22 However, some studies report some variability or low sensitivity in mfERG, which must be taken into account before discontinuing any treatment.Citation23 Patient’s responsiveness shows differential sensitivity according to the test they undergo.Citation24 In contrast to mfERG, the electro-oculogram does not seem helpful in the diagnosis of hydroxychloroquine maculopathy.Citation25 Neubauer et alCitation25 revealed the value of the color test, given that the sensitivity and specificity of tritan color vision in patients with normal fundus or with mild disturbances of pigmentation were found to be 64% and 63%, respectively (upper threshold value of 7%).Citation25 The corresponding percentages in patients with bull’s eye maculopathy were 75% and 94%, respectively (upper threshold value of 14.8%).Citation25 In addition, the P100 latency of visual evoked potentials and photostress recovery time are able to evaluate the retinal toxicity of the drug.Citation26
Although some authors report that mfERG is a more sensitive test compared to spectral domain-OCT and autofluorescence, according to others, automated visual field testing and spectral domain-OCT are also objective methods of detecting hydroxychloroquine-induced maculopathy, appearing to possess high sensitivity and specificity.Citation27 Cukras et alCitation27 assessing the retinal thickness with spectral domain-OCT, observed that patients with toxic retinopathy had thinner retina (<40 μm) than patients without retinopathy. In addition, the visual field mean deviation (10-2 visual field) was 11 dB lower in the affected group.Citation27 The visual field mean deviation has been correlated to mfERG response amplitudes.Citation28 Marmor and MellesCitation29 reported the presence of parafoveal ring scotomas in patients with normal spectral domain-OCT, while all patients with parafoveal lesions on spectral domain-OCT showed parafoveal focal spots of visual field loss. Another study estimated that 10-2 visual field, spectral domain-OCT, and mfERG had high-negative and low-positive predictive values, being able to exclude retinopathy when normal but not able to confirm toxicity if the condition was pathologic.Citation22 Abnormalities in visual field that have been found in patients with hydroxychloroquine-induced retinopathy depend on the test being used, given that central defects are seen in the 24-2 test and paracentral ones in the 10-2 test.Citation30 Frequency-doubling Humphrey perimetry and white-on-white Humphrey visual field perimetry (HVFP) can both be helpful for the diagnosis of retinal abnormalities caused by hydroxychloroquine.Citation31 Microperimetry has detected early toxic lesions even when autofluorescence, HVFP, and mfERG appeared normal.Citation32
Disturbances of the photoreceptors in the level of the inner and outer segment junction have been confirmed with ultra–high-resolution OCT in symptomatic patients affected by hydroxychloroquine retinopathy.Citation33 These abnormalities have been correlated with visual field defects and mfERG responses.Citation33 Spectral domain-OCT changes can be identified not only in the early or late stages of toxic retinopathy but also in the absence of symptoms or fundus lesions.Citation34 Moreover, hydroxychloroquine-induced retinopathy is characterized by thinning of peripapillary retinal nerve fiber layer, perifoveal ganglion cell layer, and inner plexiform layers, which can be independent of functional or structural clinical changes of photoreceptors or retinal pigment epithelial cell layers.Citation35 The importance of recognizing early changes in spectral domain-OCT, before retinal pigment epithelium is affected, is highlighted by Marmor and Hu,Citation36 who diagnosed progressive loss of foveal thickness and cone structure in the retina of patients receiving hydroxychloroquine, even 3 years after the cessation of the drug. In this study, we presumed that visual acuity improves along with the amplitudes of mfERG responses 6 months after the discontinuation of hydroxychloroquine therapy, detecting no differences in retinal thickness. More studies are needed to clarify whether ocular findings should influence the course of therapy. However, almost all authors agree that all patients should undergo a basic ocular examination before starting treatment to serve as a reference point and to diagnose any preexisting maculopathy. Annual screening based on fundus autofluorescence, spectral domain-OCT, and mfERG 5 years after starting hydroxychloroquine therapy is not widely recommended.Citation23,Citation37
Acknowledgments
The authors alone are responsible for the contents of the paper.
Disclosure
The authors report no conflicts of interest in this work.
References
- RynesRIAntimalarial drugs in the treatment of rheumatological diseasesBr J Rheumatol19973677998059255117
- CasadoEGratacósJTolosaCAntimalarial myopathy: an underdiagnosed complication? Prospective longitudinal study of 119 patientsAnn Rheum Dis200665338539016096334
- SteinMBellMJAngLCHydroxychloroquine neuromyotoxicityJ Rheumatol200027122927293111128688
- Costedoat-ChalumeauNHulotJSAmouraZHeart conduction disorders related to antimalarials toxicity: an analysis of electrocardiograms in 85 patients treated with hydroxychloroquine for connective tissue diseasesRheumatology (Oxford)200746580881017202178
- CansuDUKorkmazCHypoglycaemia induced by hydroxychloroquine in a non-diabetic patient treated for RARheumatology (Oxford)200847337837918222983
- MakinAJWendonJFittSPortmannBCWilliamsRFulminant hepatic failure secondary to hydroxychloroquineGut19943545695708175002
- CohenPRHydroxychloroquine-associated hyperpigmentation mimicking elder abuseDermatol Ther (Heidelb)20133220321024318415
- YamJCKwokAKOcular toxicity of hydroxychloroquineHong Kong Med J200612429430416912357
- Geamănu PancăAPopa-CherecheanuAMarinescuBGeamănuCDVoineaLMRetinal toxicity associated with chronic exposure to hydroxychloroquine and its ocular screeningJ Med Life20147332232625408748
- Palma SánchezDRubio VelazquezESoro MarínSReyes GarcíaRRetinal toxicity due to antimalarials: frequency and risk factorsReumatol Clin20139525926223707434
- MarmorMFNew American Academy of Ophthalmology recommendations on screening for hydroxychloroquine retinopathyArthritis Rheum2003486176412794848
- KarkanováMMatuskováVVlkováEDoskováHUhmannováRThe ERG contribution in early diagnosis of chloroquine and hydroxychloroquine maculopathyCesk Slov Oftalmol20106626266 Czech20925239
- LaiWWLamDSChloroquine-induced bull’s eye maculopathyHong Kong Med J2005111555715687518
- SoSCHedgesTRSchumanJSQuirezaMLEvaluation of hydroxychloroquine retinopathy with multifocal electroretinographyOphthalmic Surg Lasers Imaging200334325125812757106
- Rodríguez-HurtadoFJSáez-MorenoJARodríguez-FerrerJMOcular toxicity and functional vision recovery in a patient treated with hydroxychloroquineReumatol Clin201511317017325108668
- AliferisKMermoudCSafranABMultifocal electroretinography in follow up of patients treated with hydroxychloroquineJ Fr Ophtalmol2011347468475 French21549445
- MellesRBMarmorMFPericentral retinopathy and racial differences in hydroxychloroquine toxicityOphthalmology2015122111011625182842
- KellnerURennerABTillackHFundus autofluorescence and mfERG for early detection of retinal alterations in patients using chloroquine/hydroxychloroquineInvest Ophthalmol Vis Sci20064783531353816877425
- LyonsJSSevernsMLDetection of early hydroxychloroquine retinal toxicity enhanced by ring ratio analysis of multifocal electroretinographyAm J Ophthalmol2007143580180917336914
- MoschosMNMoschosMMApostolopoulosMMalliasJABourosCTheodossiadisGPAssessing hydroxychloroquine toxicity by the multifocal ERGDoc Ophthalmol20041081475315104166
- NebbiosoMLivaniMLSteigerwaltRDPanettaVRispoliERetina in rheumatic diseases: standard full field and multifocal electroretinography in hydroxychloroquine retinal dysfunctionClin Exp Optom201194327628320533929
- MaturiRKYuMWeleberRGMultifocal electroretinographic evaluation of long-term hydroxychloroquine usersArch Ophthalmol2004122797398115249360
- BrowningDJImpact of the revised american academy of ophthalmology guidelines regarding hydroxychloroquine screening on actual practiceAm J Ophthalmol20131553418.e428.e23218706
- MarmorMFComparison of screening procedures in hydroxychloroquine toxicityArch Ophthalmol2012130446146922159170
- NeubauerASSamari-KermaniKSchallerUWelge-LübetaenURudolphGBerningerTDetecting chloroquine retinopathy: electro-oculogram versus colour visionBr J Ophthalmol200387790290812812896
- HeravianJSaghafiMShoeibiNHassanzadehSShakeriMTSharepoorMA comparative study of the usefulness of color vision, photostress recovery time, and visual evoked potential tests in early detection of ocular toxicity from hydroxychloroquineInt Ophthalmol201131428328921748532
- CukrasCHuynhNVitaleSWongWTFerrisFL3rdSievingPASubjective and objective screening tests for hydroxychloroquine toxicityOphthalmology2015122235636625444344
- LaiTYNgaiJWChanWMLamDSVisual field and multifocal electroretinography and their correlations in patients on hydroxychloroquine therapyDoc Ophthalmol2006112317718716804707
- MarmorMFMellesRBDisparity between visual fields and optical coherence tomography in hydroxychloroquine retinopathyOphthalmology201412161257126224439759
- AndersonCBlahaGRMarxJLHumphrey visual field findings in hydroxychloroquine toxicityEye (Lond)201125121535154522094300
- TangaLCentofantiMOddoneFRetinal functional changes measured by frequency doubling technology in patients treated with hydroxychloroquineGraefes Arch Clin Exp Ophthalmol2011249571572121253758
- JivrajkaRVGeneadMAMcAnanyJJChowCCMielerWFMicroperimetric sensitivity in patients on hydroxychloroquine (Plaquenil) therapyEye (Lond)20132791044105223764990
- Rodriguez-PadillaJAHedgesTR3rdMonsonBHigh-speed ultra-high-resolution optical coherence tomography findings in hydroxychloroquine retinopathyArch Ophthalmol2007125677578017562988
- KorahSKuriakoseTOptical coherence tomography in a patient with chloroquine-induced maculopathyIndian J Ophthalmol200856651151318974527
- PasadhikaSFishmanGAEffects of chronic exposure to hydroxychloroquine or chloroquine on inner retinal structuresEye (Lond)201024234034619373270
- MarmorMFHuJEffect of disease stage on progression of hydroxychloroquine retinopathyJAMA Ophthalmol201413291105111224922444
- MarmorMFKellnerULaiTYLyonsJSMielerWFAmerican Academy of OphthalmologyRevised recommendations on screening for chloroquine and hydroxychloroquine retinopathyOphthalmology2011118241542221292109