
Abstract
Purpose
Several medications are known to cause vitamin D deficiency. The aim of this study is to describe vitamin D testing and supplementation in patients using these “risk medications”, thereby assessing adherence to medical guidelines.
Patients and methods
A database with electronic health records for the population in a Swedish County (≈240,000 inhabitants) was screened for patients prescribed the pre-defined “risk medications” during a 2-year period (2014–2015). In total, 12,194 patients were prescribed “risk medications” pertaining to one of the three included pharmaceutical groups. Vitamin D testing and concomitant vitamin D supplementation, including differences between the included pharmaceutical groups, was explored by matching personal identification numbers.
Results
Corticosteroids were prescribed to 10,003 of the patients, antiepileptic drugs to 1,101, and drugs mainly reducing vitamin D uptake to 864. Two hundred twenty-six patients were prescribed >1 “risk medication”. Seven hundred eighty-seven patients (6.5%) had been tested during the 2-year period. There were no differences regarding testing frequency between groups. Concomitant supplements were prescribed to 3,911 patients (32.1%). It was more common to be prescribed supplements when treated with corticosteroids. Vitamin D supplementation was more common among tested patients in all three groups. Women were tested and supplemented to a higher extent. The mean vitamin D level was 69 nmol/L. Vitamin D deficiency was found in 24.1% of tested patients, while 41.3% had optimal levels. It was less common to be deficient and more common to have optimal levels among patients prescribed corticosteroids.
Conclusion
Adherence to medical guidelines comprising testing and supplementation of patients prescribed drugs causing vitamin D deficiency needs improvement in Sweden.
Introduction
Less than a decade ago, vitamin D levels were for the first time associated with all-cause mortality in the Nordic countries.Citation1 Ever since, there has been a strong interest in exploring risk factors associated with low levels of vitamin D. Several recent cross-sectional studies have described the correlation between prescribed medications and vitamin D deficiency. In these studies, the number of prescribed drugs, as well as the use of certain pharmaceutical groups/substances, was associated with low levels of vitamin D.Citation2–Citation4
A decrease in intestinal uptake of vitamin DCitation5 and an induction of hepatic enzymes which transform vitamin D into inactive metabolitesCitation6 are examples of pharmacological mechanisms involved in this direct adverse drug reaction. Furthermore, indirect interactions where drugs counteract the effects of vitamin D are described.Citation7
Nordic medical guidelines,Citation8 as well as medical decision support systems,Citation9,Citation10 emphasize the risk of vitamin D deficiency when prescribing these types of “risk medications” and suggest monitoring by testing for vitamin D and/or prescribing vitamin D supplements. These guidelines, published by national medical authorities,Citation8 as well as guidelines developed within health care,Citation9 together with the recommendations in decision support systemsCitation10 all derive from peer-reviewed articles on “risk medication” as well as from international guidelines on management of vitamin D deficiency.Citation7,Citation11
Reports on adherence to these risk management recommendations are, however, very sparse. Data for the number of patients prescribed the various “risk medications” can be provided by the health care authorities,Citation12 whereas data for the number of vitamin D tests performed by laboratories and the vitamin D results/levels can be provided by Clinical Chemistry departments. Pharmacy sales figures on supplementation therapy can provide some information on the volume of vitamin D used in a population. This information could serve as a foundation for estimating the adherence to the guidelines, but the various data sources lack coupling. To our knowledge, connecting prescriptions with testing, test results, and supplementation in this field of medicine has not been previously performed.
In this paper, a big data approach on an electronic health record (EHR) system in a Swedish County is used to determine the frequency of testing for vitamin D and the concomitant use of supplementation therapy, thereby assessing adherence to medical risk management guidelines.
Material and methods
Study design
A population-based cross-sectional study matching prescription of “risk medication” with supplementation, laboratory analyses, and test results.
Study population
Included “risk medications” and supplements
Pharmaceutical substances listed as “drugs causing vitamin D deficiency”, in a commonly used medical decision-support website in Sweden,Citation9 was defined as “risk medications”. The following pharmaceutical substances were thus considered to be “risk medications” (ATC-code): prednisolone (H02AB06), prednisone (H02AB07), phenytoin (N03AB02), phenobarbital (N03AA02), carbamazepine (N03AF01), cholestyramine (C10AC01), colestipol (C10AC02), sevelamer (V03AE02), orlistat (A08AB01), and efavirenz (J05AG03).
The substances were allocated to one of three pharmaceutical groups. The first group (C) included the corticosteroids (prednisolone and prednisone), the second group (A) included the antiepileptic drugs (phenytoin, phenobarbital, and carbamazepine), and the third group (O) included the other substances (cholestyramine, colestipol, sevelamer, orlistat, and efavirenz). The first two groups mainly induce liver enzymes, whereas the third group mainly reduces the uptake of vitamin D from the gut.Citation7
The following pharmaceutical substances were regarded as vitamin D supplementation (ATC-code): dihydrotachysterol (A11CC02), alfacalcidol (A11CC03), calcitriol (A11CC04), cholecalciferol (A11CC05), oral vitamin D drops, (A11CC), a combination of vitamins including vitamin D (A11JB), and a combination of calcium and cholecalciferol (A12AX).
Vitamin D testing
Vitamin D status was assessed by using total serum 25-hydroxyvitamin D (25-OH-vitamin D2 + 25-OH-vitamin D3), which was measured by tandem mass spectrometry (LC-MS/MS) using the API 4000 instrument with an atmospheric pressure chemical ionization source (AB Sciex, Concord, ON, Canada) and Prominence UFLC (Shimadzu, Kyoto, Japan). The calibrators used were traceable to the National Institute of Standards and Technology, standard reference material 972a, vitamin D in human serum.
The laboratory participated among other laboratories (n=997, April 2014) in the vitamin D external quality assessment scheme and was within ±1 SD of the target value and method mean (LC-MS/MS) during the study period. The laboratory met the criteria for a proficiency certificate available to successful participants.
The prevalence of vitamin D deficiency depends on the cutoff point used. The American Endocrine Society Clinical Practice Guideline, published in 2011, was used and defined the optimal vitamin D level as a level of 25(OH)D>75 nmol/L. Vitamin D insufficiency was set at a 25(OH)D level between 50 and 75 nmol/L, while vitamin D deficiency was defined as a 25(OH)D level <50 nmol/L. Highly deficient status was set at a 25(OH)D level <25 nmol/L.
Included patients and data
Patients having an active prescription of at least one of the predefined “risk medications” at any time between January 1, 2014 and December 31, 2015 were collected by screening a database consisting of data from >200,000 subjects in Kalmar County, an urban and rural area in southeastern Sweden with a population of ~240,000. Medical data were transferred from CAMBIO COSMIC (the EHR system) to a separate data storage file, and SAP Business Objects screened this file. The screening was performed on January 1, 2016.
Data for concomitant supplementation (having an active prescription of at least one of the predefined supplements during the same time period as above), testing for vitamin D (any time during the same period), and levels of vitamin D were collected by matching personal identity numbers.
Ethical approval
The study was approved by the Regional Ethical Review Board of Linköping University linked to a study on vitamin D status among elderly people in Kalmar County (dnr 2013/404-31). Due to the nature of this study with >200,000 subjects screened, it was not possible to obtain informed consent statements. The data accessed were maintained with confidentiality.
Statistics
The results for variables are presented as the mean (SD), the median (range), and for categorical variables as counts (%). Differences in frequencies between pharmaceutical risk groups as well as differences between genders, vitamin D supplementation, or testing of vitamin D levels were corrected for age (and gender if applicable) using logistic regression and differences between vitamin D levels were likewise age- and gender-adjusted and assessed using analysis of covariance. Statistical analyses were performed using Statistica (version 12, StatSoft®, Tulsa, OK, USA), and P-values <0.05 in the inference statistics were considered statistically significant.
Results
Characteristics of included patients
In , characteristics of patients in Kalmar County, prescribed at least one of the predefined “risk medications” in the EHR system CAMBIO COSMIC during the period from January 1, 2014 to December 1, 2015, are presented. A vast majority (10,003 of 12,194) of the patients were prescribed corticosteroids (prednisolone or prednisone) (group C), 1,101 patients were prescribed one of the antiepileptic substances (phenytoin, phenobarbital, or carbamazepine) (group A), and 864 patients were treated with one of the other included “risk medicines” (cholestyramine, colestipol, sevelamer, orlistat, or efavirenz) (group O). Two hundred twenty-six patients were prescribed a combination of several “risk medications” during the period (group Comb). The median age of the included patients was 66 years (0–100), and almost one in two patients were males (46 %).
Table 1 Characteristics of 12,194 patients in Kalmar County prescribed (2014–2015) medication causing vitamin D deficiency and the adherence to medical risk management (concomitant vitamin D testing and supplementation) guidelines per pharmaceutical risk group
Vitamin D testing in patients prescribed “risk medication”
In , the 787 patients (6.5% of the included patients) tested for vitamin D levels during the period are described. displays age-adjusted testing proportions with regards to gender and pharmaceutical group. It was generally more common among women than among men to have been tested (P<0.001). This difference was seen in two of the pharmaceutical groups, C and A (P<0.001 and P<0.001, respectively). In the O group, there were no differences regarding testing (P=0.09).
Figure 1 (A) Age-adjusted proportions of vitamin D testing with regards to gender and pharmaceutical risk group. (B) Age-adjusted proportions of vitamin D supplementation with regards to gender and pharmaceutical risk group. (C) Age- and gender-adjusted proportions of supplementation with regards to testing and pharmaceutical risk group. (D) Age- and gender-adjusted mean vitamin D levels with regards to supplementation and pharmaceutical risk group. (E) Age- and gender-adjusted proportions of patients with vitamin D deficiency (<50 nmol/L) with regards to supplementation and pharmaceutical risk group. (F) Age- and gender-adjusted proportions of patients with optimal vitamin D levels (>75 nmol/L) with regards to supplementation and pharmaceutical risk group.
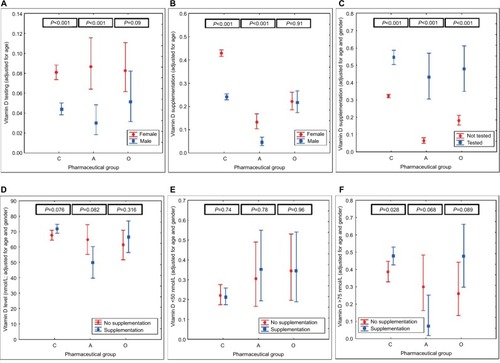
Table 2 Characteristics (including vitamin D levels/status) of 787 patients tested for vitamin D (2014–2015) among patients prescribed medication causing vitamin D deficiency, with or without concomitant vitamin D supplement in Kalmar County
There were no differences in testing proportions in general when comparing pharmaceutical groups (P=0.18) (C vs A, P=0.56, C vs O, P=0.56, A vs O, P=0.48) ( and ) and no differences between the groups regarding testing month was seen (not shown; Kruskal–Wallis ANOVA 0.73).
Concomitant vitamin D supplementation
There were 3,911 (32.1%) patients in total with a prescription of vitamin D supplement during the same time period (). displays age-adjusted supplementation proportions with regards to gender and pharmaceutical group. It was generally more common among women than among men to have been prescribed supplements (P<0.001). This difference was seen in two of the pharmaceutical groups, C and A (P<0.001 and P<0.001, respectively). In the O group, there were no differences regarding supplementation (P=0.91).
Differences were seen in supplementation proportions with regards to pharmaceutical groups (P<0.001). It was more common to be on concomitant supplementation in group C compared to group O (P<0.001) and least common in group A (P<0.001) ( and ).
presents age- and gender-adjusted vitamin D supplementation proportions with regard to pharmaceutical risk group and vitamin D testing. Supplementation was more common among tested patients in general (P<0.001). This was evident in all three groups (C, P<0.001, A, P<0.001, and O, P<0.001). The same pattern regarding differences in supplementation proportions between pharmaceutical groups (C>O>A) was found among the subgroup of patients tested for vitamin D (P<0.001) as in the entire patient population.
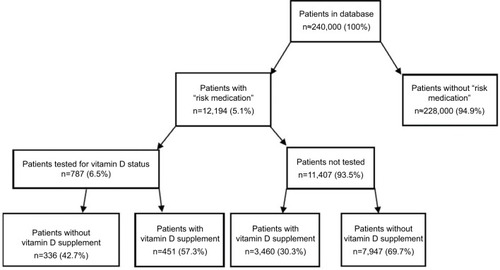
summarizes testing and supplementation on a general level in the risk group.
Figure 2 Flow chart describing the prevalence of patients prescribed “risk medication” (2014–2015), the concomitant testing, and supplementation of vitamin D in Kalmar County.
Vitamin D levels in patients prescribed “risk medication”
In , the vitamin D levels/status among the tested patients are presented. Seven patients (of 787 patients tested for vitamin D levels) were excluded in the statistical analysis of vitamin D results due to missing/inconclusive test results. The mean and median serum levels of 25(OH)D were 69.7 and 69.0 nmol/L, respectively. In patients without concomitant vitamin D supplementation, the mean and median levels of 25(OH)D were 67.3 and 67.0 nmol/L, respectively.
When analyzing the levels of vitamin D related to testing month in the patient group (780 test results), the highest mean level, 80 nM/L, was found in August, and the lowest mean value being 62 nM/L was measured in March.
In , age- and gender-adjusted mean vitamin D levels, with regards to supplementation and pharmaceutical group, are presented. No general differences in vitamin D levels regarding supplementation were seen (P=0.18). Further, no differences were observed in either of the pharmaceutical risk groups (C, P=0.076, A, P=0.082, and O, P=0.316) with regards to supplementation.
When comparing the age- and gender-adjusted mean levels of 25(OH)D between the three pharmaceutical groups (regardless of supplementation), it was found that the level was higher among patients with corticosteroids (C) than those with antiepileptic drugs (A) (P=0.001). There were no other differences when comparing pharmaceutical groups (C vs O, P=0.137, and A vs O, P=0.244) ( and ).
Vitamin D status in patients prescribed “risk medication”
In total, 187 (29+158) patients (24.1%) of those tested were vitamin D deficient (25(OH)D levels <50 nmol/L) ().
When, as in , comparing the age- and gender-adjusted proportions of patients with vitamin D deficiency, no differences were found with regard to concomitant supplementation in general (P=0.91). Further, no differences were observed in either of the pharmaceutical risk groups (C, P=0.74, A, P=0.78, and O, P=0.96) with regards to supplementation.
When comparing the age- and gender-adjusted proportions of deficient patients in the pharmaceutical groups (regardless of supplementation), results showed that it was less common to be deficient among patients with corticosteroids (C) than among patients prescribed other medications (O) (P=0.035) and borderline significant (P=0.058) compared to patients with antiepileptic drugs (A).
When instead focusing on patients with optimal vitamin D levels, it was found that 322 patients (41.3%) had levels >75 nmol/L (). As shown in , the age- and gender-adjusted proportions of patients having optimal levels were compared. Here, a difference was found with regard to concomitant supplementation in general (P=0.033), powered by a difference in group C (P=0.028). No other differences were observed (A, P=0.068 and O, P=0.089) with regards to supplementation.
When comparing the age- and gender-adjusted proportions of patients with optimal levels in the pharmaceutical groups (regardless of supplementation), the results displayed that it was more common among patients with corticosteroids (C) than among patients prescribed antiepileptic drugs (A) (P<0.001). Further, it was more common to have optimal levels among patients with other medications (O) compared to patients prescribed antiepileptic drugs (A) (P=0.039). There was no difference in proportion of patients with optimal levels of vitamin D between group C and O (P=0.348).
Discussion
There is an ongoing debate among physicians in Sweden as to when to test for vitamin D and when to treat with supplementation.Citation13 Nordic guidelines dissuade from general screening. Instead, testing among risk groups is suggested. Patients prescribed “risk medication” (all of the pharmaceutical substances included in the present study) comprise one of those risk groups.Citation9 Clinical Chemistry laboratories also state that use of “risk medications” motivates vitamin D testing.Citation10,Citation14,Citation15
The present study showed that the adherence to the guidelines regarding testing was poor, as only a very small proportion of patients prescribed “risk medication” were tested for vitamin D. There were no differences between the pharmaceutical groups regarding testing in the present study.
One can assume that patients with a vitamin D deficiency benefit more from supplementation than patients with near-normal levels. In order to determine which patients suffer from deficiency, patients have to be tested. In the present study, tested patients were more often prescribed supplements. Valmadrid et al also found that neurologists who tested for vitamin D more often were more likely to prescribe supplements as well.Citation16
In the present study, less than half of the patients had optimal levels of vitamin D, stressing that supplementation is underutilized among tested patients. These results are in line with a previous Swedish study by Kallner.Citation13
The mean vitamin D levels were close to optimal level (69.4 nM) in the present study. This has to be interpreted with caution, as only a small fraction of patients were tested. Even though the mean level appears satisfactory, a quite large portion of patients in the current risk group were in fact vitamin D deficient. This will never be acknowledged if patients are not tested.
As for the guideline recommendation regarding concomitant prescription of vitamin D supplements, the proportion of patients prescribed vitamin D supplement in the present study was relatively low, even though differences between pharmaceutical groups were displayed. Thus, for the population in the present study, it was more common to be supplemented when having been prescribed corticosteroids.
In general, the associations between vitamin D-levels/status and supplementation were weak in the present study. The mean levels did not differ, nor did the proportion of patients being vitamin D deficient. This could be the result of testing or treatment bias. Vitamin D supplementation was, however, associated with patients having optimal levels of vitamin D in the present study.
Vitamin D fortification in food has recently been reviewed pointing out a gap between nutritional guidelines and the prevalence of vitamin D deficiency in the general population.Citation17 When determining the dietary reference values for vitamin D, 37 of the 65 studies that formed the knowledge base excluded patients prescribed “risk medication”.Citation18
The main focus of treating vitamin D deficiency still seems to be bone health, ie, to avoid osteoporosis and fractures even though numerous studies on vitamin D levels and nonclassical effects, eg, effects on the immune system of vitamin D, have been published in recent years.Citation19–Citation21
It is well known that women are more likely to develop osteoporosis and contract low energy fractures.Citation11,Citation22 This could explain the fact that it was more common for women to be tested and supplemented in the present study. Age is regarded as a risk factor for vitamin D deficiency and older patients may require higher dosage of vitamin D to prevent fractures.Citation23 The results on testing, supplementation, and vitamin D levels/status were adjusted with regards to gender and age in order to avoid such biases in the present study.
Drug-induced osteoporosis and vitamin D deficiency is not a recent discovery. The effects of bone health on corticosteroids was first described in the early 1930s.Citation24 Since then, the mechanisms involved have been extensively explored, resulting in a cascade of effects on calcium homeostasis, as well as effects on osteoblasts, sex hormones, and bone.Citation7,Citation25,Citation26 These effects counteract the effect of vitamin D. Furthermore, some corticosteroids have a more direct effect on vitamin D, by inducing catabolic enzymes which metabolize vitamin D leading to lower levels of vitamin D.Citation7,Citation27 Recommendations of concomitant vitamin D (and calcium) supplementation in international clinical guidelines for preventing glucocorticoid-induced osteoporosis start from at least 2.5 mg for a 3-month period.Citation28 In Sweden, the recommendation is valid for doses corresponding to at least 5 mg daily of prednisolone for 3 months.Citation22 In a survey among North American physicians practicing pediatric rheumatology, 80% of the physicians reported that they “frequently” or “always” prescribed vitamin D supplements for patients on long-term corticosteroid treatment.Citation29 In the NHANES study, the association between vitamin D deficiency (<10 ng/mL = <25 nmol/L) and corticosteroid use was assessed in a total of >20,000 American inhabitants.Citation30 The OR of being deficient was twice as high among patients on corticosteroids (n=181). In the NHANES study, 11% of the patients prescribed corticosteroids were deficient (<25 nmol/L) and 75% had less than optimal levels (<75 nmol/L) compared to the present study, where <3% were highly deficient (<25 nmol/L) and 55.4% had less than optimal levels.Citation30 One explanation for the differences could be concomitant vitamin D supplementation. In the NHANES study, 23% had supplementation, and those patients were less likely to be deficient (OR 0.16–0.25) compared to the present study, where 35.6% of the patients on corticosteroids had vitamin D supplements. The present study also presented differences in proportion of patients with optimal levels of vitamin D with regards to concomitant supplementation in patients prescribed corticosteroids.
The association between rickets/fractures, vitamin D, and antiepileptic drugs was first documented almost 50 years ago among institutionalized children with epilepsy.Citation31,Citation32 Since then, it has been demonstrated that, in addition to the increase in seizure-related fractures, antiepileptic drugs induce osteoporosis by several mechanisms.Citation33 One of these mechanisms is the induction of catabolic liver enzymes which results in vitamin D deficiency.Citation6 Other mechanisms are direct effects on osteoblasts and osteoclasts, and effects on sex hormones.Citation7 American neurologists were asked about their practice patterns regarding issues of bone health among epileptic patients. Three percent of the neurologists frequently tested for vitamin D levels and <10% prescribed prophylactic vitamin D.Citation16 Vitamin D levels among patients with epilepsy, and on antiepileptic drugs, have been studied. He et al presented an increased risk of vitamin D deficiency among 51 Chinese epileptic children.Citation34 The difference was caused by treatment with antiepileptic drugs rather than other factors associated with epilepsy. At follow-up (2 months after treatment initiation), 71% of the children had vitamin D deficiency (<25 nmol/L), 29% had insufficient levels (25–50 nmol/L), whereas 0% had sufficient levels (<50 nmol/L). In the present study, only enzyme-inducing antiepileptic drugs were included, since those were included in the medical decision support system.Citation9 A mean level of 59 nmol/L was found in the present study, which was slightly higher compared to Teagarden et al,Citation35 and 33% had levels below 50 nmol/L = 20 ng/mL, which was slightly lesser than in Teagarden et al’s American study. However, in the present study, no difference in mean levels of vitamin D with regard to supplementation was seen, in contrast to Teagarden et al’s study.
As for the third included pharmaceutical group, it was more diverse than the other two groups, but mainly included drugs that decrease the uptake of fat-soluble vitamins. The two included substances usually prescribed to lower levels of cholesterol (cholestyramine and colestipol) are currently used for selected patient groups, and not considered to be the first-line choice. Even though they are included among “risk medication” in guidelines, very few studies have been performed to assess the clinical relevance of their risk profile. Orlistat is used for weight loss among overweight patients, and is one of the included drugs that are also available over the counter (OTC) in Sweden. Preceding bariatric surgery, orlistat is sometimes used to reach some initial weight loss among obese patients. Sevelamer is used to regulate phosphor levels in patients with kidney failure, and only when vitamin D supplements are used concurrently is secondary hyperparathyroidism avoided in patients on hemodialysis.Citation36 Efavirenz is used in the treatment of HIV, and mainly inhibits reverse transcriptase known to cause vitamin D deficiency.Citation37–Citation39
To summarize, group C stands out in several aspects. There are many more patients prescribed corticosteroids than the other pharmaceutical risk groups in the present study; they are more often prescribed concomitant vitamin D supplements, it is rare to have a vitamin D deficiency; and patients prescribed corticosteroids more often have optimal levels of vitamin D. It was less common for men to be tested and supplemented compared to women in group C.
Patients being prescribed antiepileptic drugs (group A) had the lowest mean level of vitamin D, fewest reached optimal vitamin D levels, and fewest received supplementation in the present study. It was less common for men to be tested and supplemented compared to women in group A.
Group O seems to have a position in between group C and group A when it comes to supplementation and optimal vitamin D-levels. Furthermore, no gender differences were seen in group O regarding testing and supplementation.
Usage of the large amounts of medical data stored in electronic systems represents a paradigm shift in research, with both new opportunities and challenges.Citation40 EHR systems in combination with big data analyses can also be used to improve quality and patient outcomes in health care. In the current study, the application Business Objects was used to scan data derived from CAMBIO COSMIC, the EHR system utilized in Kalmar County for patient data. The results of the present study demonstrate the value of a big data approach to assess adherence to the medical risk management guidelines, as opposed to time-consuming manual medical journal reviews.
Major limitations of the present study are the cross-sectional design and the time period studied. Prescription of concomitant use of vitamin D supplement is probably overestimated since a 2-year period was screened without relating testing and supplementation to the exact prescription period of the “risk medication”. Even though the entire health record system used in Kalmar County (including ~240,000 patients) was screened, there are few caregivers who prescribe medications in other electronic systems. This is also the case for patients with dose-dispensed drugs (n≈5,000). As for supplementation, access to data on prescriptions was available, thus leaving out OTC-supplements. This could imply a possible underestimation of the number of patients using vitamin D supplements. Furthermore, differences in doses or treatment periods were not taken into account.
Although we recognize some limitations in the study design, the study is to the best of our knowledge the first to compare differences in risk management and vitamin D status between various pharmaceutical groups in a population-based study using a big data approach. Previous studies on this topic have included significantly fewer patients.
Conclusion
The present study found that guidelines had not been followed, as very few patients with “risk medication” had been tested for vitamin D deficiency, and few had been substituted with vitamin D. The adherence to medical guidelines recommendations when prescribing drugs causing vitamin D deficiency needs to be improved. In order to do so, reasons for the poor adherence require further investigation. To our knowledge, this is the first time that the clinical management of patients prescribed drugs causing vitamin D deficiency has been systematically assessed using a big data approach.
Acknowledgments
This study was funded by the Kamprad Family Foundation for Entrepreneurship, Research and Charity and by Region Kalmar County. We would like to thank system administrators Dick Hedberg and Olof Björneld for providing the raw data files and Region Kalmar County for providing the possibility to perform this study.
Disclosure
The authors report no conflicts of interest in this work.
References
- HutchinsonMSGrimnesGJoakimsenRMFigenschauYJordeRLow serum 25-hydroxyvitamin D levels are associated with increased all-cause mortality risk in a general population: the Tromsø studyEur J Endocrinol2010162593594220185562
- van Orten-LuitenACJanseADhonukshe-RuttenRAWitkampRFVitamin D deficiency as adverse drug reaction? A cross-sectional study in Dutch geriatric outpatientsEur J Clin Pharmacol201672560561426873590
- SohlEvan SchoorNMde JonghRTde VriesOJLipsPThe impact of medication on vitamin D status in older individualsEur J Endocrinol2012166347748522170799
- CarlssonMWanbyPBrudinLOlder Swedish adults with high self-perceived health show optimal 25-hydroxyvitamin D levels whereas vitamin D status is low in patients with high disease burdenNutrients2016811717
- KnodelLCTalbertRLAdverse effects of hypolipidaemic drugsMed Toxicol19872110323547004
- WangZSchuetzEGXuYThummelKEInterplay between vitamin D and the drug metabolizing enzyme CYP3A4J Steroid Biochem Mol Biol2013136545822985909
- GröberUKistersKInfluence of drugs on vitamin D and calcium metabolismDermatoendocrinol20124215816622928072
- BrotCForebyggelse, diagnostik och behandling AF D-vitaminmangel2010 Available from: https://www.sst.dk/da/rationel-farmakoterapi/maanedsbladet/2010/maanedsblad_nr_6_juni_2010/forebyggelse_diag-nostik_og_behandling_af_d-vitaminmangeAccessed February 18, 2019
- OsmancevicAD-vitaminbrist2016 Available from: www.internet-medicin.seAccessed February 18, 2019
- Sfinx interaktionstjänstStockholms läns landsting Available from: http://www.janusinfo.se/Beslutsstod/Interaktioner/Interaktioner-Sfinx/Accessed February 18, 2019
- HolickMFBinkleyNCBischoff-FerrariHAEvaluation, treatment, and prevention of vitamin D deficiency: an endocrine society clinical practice guidelineJ Clin Endocrinol Metab20119671911193021646368
- The National Board of Health and Welfare2017 Available from: http://www.socialstyrelsen.se/statistikAccessed February 18, 2019
- KallnerAEstoniusMEn retrospektiv studie AV beställningsmönster för mätning AV D-vitaminKlinisk biokemi i Norden201432633
- Karolinska UniversitetslaboratorietHydroxi-vitamin D, 25-, S Available from: https://www.karolinska.se/KUL/Alla-anvisningar/Anvis-ning/9123Accessed February 18, 2019
- BjörnsdottirSPalmérMSääfMToviJLitnäsED-vitaminbrist, Viss, Stockholms läns landsting2017 Available from: http://www.viss.nu/handlaggning/vardprogram/endokrina-organ/d-vitaminbrist/Accessed February 18, 2019
- ValmadridCVoorheesCLittBSchneyerCRPractice patterns of neurologists regarding bone and mineral effects of antiepileptic drug therapyArch Neurol2001589136911559307
- PilzSMärzWCashmanKDRationale and plan for vitamin D food fortification: a review and guidance paperFront Endocrinol20189373
- EFSA Panel on Dietetic Products, Nutrition and Allergies (NDA)Dietary reference values for vitamin DEFSA J20161410e04547
- ZittermannAGummertJFNonclassical vitamin D actionNutrients20102440842522254030
- WackerMHolickMFVitamin D – effects on skeletal and extraskeletal health and the need for supplementationNutrients20135111114823306192
- PeelenEKnippenbergSMurisAHEffects of vitamin D on the peripheral adaptive immune system: a reviewAutoimmun Rev2011101273374321621002
- Svenska osteoporossällskapetVårdprogram för osteoporos2015 Available from: www.svos.se/site/wp-content/uploads/2015/12/SVOS-v%C3%A5rdprogram-osteoporos-20151.pdf
- Bischoff-FerrariHAWillettWCOravEJA pooled analysis of vitamin D dose requirements for fracture preventionN Engl J Med20123671404922762317
- CushingHThe basophil adenomas of the pituitary body and their clinical manifestations (pituitary basophilism). 1932Obes Res19942548650816353601
- KleinGLThe effect of glucocorticoids on bone and muscleOsteoporos Sarcopenia201511394526557727
- ZieglerRKasperkCGlucocorticoid-induced osteoporosis: prevention and treatmentSteroids1998635–63443489618799
- LundBStormTLLundBBone mineral loss, bone histomorphometry and vitamin D metabolism in patients with rheumatoid arthritis on long-term glucocorticoid treatmentClin Rheumatol1985421431494006384
- BuckleyLGuyattGFinkHA2017 American College of Rheu-matology Guideline for the prevention and treatment of glucocorticoid-induced osteoporosisArthritis Rheumatol20176981521153728585373
- SoybilgicATesherMWagner-WeinerLOnelKBA survey of steroid-related osteoporosis diagnosis, prevention and treatment practices of pediatric rheumatologists in North AmericaPediatr Rheumatol Online J20141212425053923
- SkverskyALKumarJAbramowitzMKKaskelFJMelamedMLAssociation of glucocorticoid use and low 25-hydroxyvitamin D levels: results from the National Health and Nutrition Examination Survey (NHANES): 2001–2006J Clin Endocrinol Metab201196123838384521956424
- DentCERichensARoweDJStampTCOsteomalacia with long-term anticonvulsant therapy in epilepsyBr Med J19704572769725312062
- KruseROsteopathies in antiepileptic long-term therapy (preliminary report)Monatsschr Kinderheilkd196811663783814304972
- ValsamisHAAroraSKLabbanBMcFarlaneSIAntiepileptic drugs and bone metabolismNutr Metab20063136
- HeXJiangPZhuWEffect of antiepileptic therapy on serum 25(OH)D3 and 24,25(OH)2D3 levels in epileptic childrenAnn Nutr Metab201668211912726812357
- TeagardenDLMeadorKJLoringDWLow vitamin D levels are common in patients with epilepsyEpilepsy Res201410881352135625060996
- ChertowGMDillonMAAminNBurkeSKSevelamer with and without calcium and vitamin D: observations from a long-term open-label clinical trialJ Ren Nutr200010312513210921533
- BrownTTMcComseyGAAssociation between initiation of antiretroviral therapy with efavirenz and decreases in 25-hydroxyvitamin DAntivir Ther201015342542920516561
- NylénHHabtewoldAMakonnenEPrevalence and risk factors for efavirenz-based antiretroviral treatment-associated severe vitamin D deficiency: a prospective cohort studyMedicine20169534e463127559961
- WelzTChildsKIbrahimFEfavirenz is associated with severe vitamin D deficiency and increased alkaline phosphataseAIDS201024121923192820588161
- WangSDOpportunities and challenges of clinical research in the big-data era: from RCT to BCTJ Thorac Dis20135672172324409345