
 ?Mathematical formulae have been encoded as MathML and are displayed in this HTML version using MathJax in order to improve their display. Uncheck the box to turn MathJax off. This feature requires Javascript. Click on a formula to zoom.
Abstract
Background:
Fibrocalculous pancreatic diabetes (FCPD) is a secondary form of diabetes seen in patients with tropical chronic pancreatitis. Insulin deficiency plays a major role in the etiopathogenesis of FCPD. Limited data suggest a possible role of insulin resistance (IR) in the pathogenesis of FCPD. Sparse data exist on measures of insulin sensitivity (IS) and secretion in patients with FCPD and its comparison to type 2 diabetes mellitus (T2D) patients.
Method:
Eighty patients with FCPD, 36 patients with T2D and 36 healthy subjects were included. A 75 g oral glucose tolerance test (OGTT) was performed in the morning after an overnight fast. We evaluated IS and secretion using indices derived from fasting (homeostasis model assessment of insulin resistance [HOMA-IR], quantitative insulin sensitivity check index [QUICKI] and homeostasis model assessment of beta-cell function [HOMA-ß]) and OGTT (Matsuda, insulin sensitivity index by Kanauchi [ISI-K], oral glucose insulin sensitivity index [OGIS], Stumvoll, insulinogenic index and oral disposition index [ODI]) measurements of glucose and insulin.
Results:
HOMA-IR was significantly higher and QUICKI significantly lower in patients with FCPD and T2D than in healthy controls (P<0.001). Matsuda, ISI-K, OGIS and Stumvoll were significantly lower in patients with FCPD and T2D than in healthy controls (P<0.001), indicating reduced IS in both FCPD and T2D patients. HOMA-ß, insulinogenic index and ODI were significantly lower in patients with FCPD and T2D compared to healthy controls (P<0.001).
Conclusion:
FCPD is associated with reduced IS as assessed by fasting and OGTT-based indices. FCPD is also associated with a greater degree of impairment in insulin secretion than in T2D. IR may play a role in the pathogenesis of FCPD.
Introduction
Diabetes of the exocrine pancreas (DEP) is far more common than previously recognized and accounts for 1–5% of all cases of diabetes.Citation1,Citation2 Chronic pancreatitis (CP) and pancreatic neoplasia are the two most common causes of DEP.Citation3 Tropical chronic pancreatitis (TCP) is a common cause of CP in tropical countries such as India, and the associated diabetes is termed fibrocalculous pancreatic diabetes (FCPD).Citation4 Although the etiology and pathophysiology of TCP are poorly understood, genetic alterations of serine protease inhibitor Kazal type 1 (SPINK1 N34S), cationic and anionic trypsinogen (PRSS1, PRSS2), oxidative stress, micronutrient deficiencies and environmental toxins have been postulated to play a role.Citation4–Citation7
The clinical presentation of FCPD encompasses a wide spectrum, ranging from impaired glucose tolerance (IGT) to overt diabetes mellitus, an insidious onset to rapid progression, and requiring only diet/oral medications to insulin for survival.Citation4,Citation6,Citation7 Progression to diabetes usually occurs in the second or third decade of life. As in other forms of DEP, insulin deficiency is a definitive crux. A few reports in the past two decades have suggested the possible role of insulin resistance (IR) in the glucose metabolism of FCPD.Citation8,Citation9 However, the results were inconsistent on the contribution of IR to FCPD and other reports did not find IR to be a major feature of FCPD.Citation10,Citation11 Small sample sizes and lack of control groups contributed to these inconsistencies and the relative importance and contribution of IR in the clinical presentation of FCPD remain unknown. The presence of IR not only is important from a pathophysiological perspective, but also has management implications as regards the potential role of medications that target IR, and may confer additional morbidity and cardiovascular risk independent of glycemic control, as in patients with type 2 diabetes (T2D).Citation12
The hyperinsulinemic euglycemic clamp (HIEC) technique is considered the reference standard for estimation of insulin sensitivity (IS), but it is expensive, requires expertise, is laborious and is not suitable for epidemiological purposes. For epidemiological studies, simpler alternatives include steady-state fasting glucose and insulin-derived measures of IS, such as the homeostatic model assessment of insulin resistance (HOMA-IR) and quantitative insulin sensitivity check index (QUICKI), and several dynamic oral glucose tolerance test (OGTT)-derived indices such as the Matsuda index (Matsuda-ISI), insulin sensitivity index by Kanauchi (ISI-K), Stumvoll index and oral glucose insulin sensitivity index (OGIS).Citation13–Citation15 Both static and dynamic indices of IS have been used extensively, and, in general, shown to have good correlation with HIEC and demonstrated to be valid indicators in subjects with a wide range of glucose tolerance statuses, including those with normal glucose tolerance, obesity and IGT.Citation16–Citation24 Limited data suggest that these surrogate indices of IS have good correlation with clamp-derived IS (SIclamp) in patients with T2D.Citation24–Citation30
Similarly, indices for insulin secretion based on fasting parameters, such as the homeostatic model assessment of beta-cell function (HOMA-ß), and those derived from insulin responses to the OGTT, such as the insulinogenic index (IGI) and oral disposition index (ODI), have been used as markers of insulin secretion and beta-cell function in subjects with varying glucose tolerance status and diabetes.Citation31–Citation36
We hypothesized that simultaneous measurements of indices of IS and insulin secretion in patients with FCPD and their comparison with healthy non-obese controls and patients with T2D would provide a reasonably accurate assessment of the presence of IR and its relative contribution in comparison to beta-cell dysfunction. Previous studies on IS in FCPD involved different techniques and fewer subjects, and did not simultaneously assess IR and insulin secretion. Furthermore, these parameters were not studied in relation to T2D and healthy controls. Hence, we undertook this study to assess IR and insulin secretion in patients with FCPD and to compare them with T2D and healthy controls.
Research design and methods
Study design
Subjects
The present study was conducted at a tertiary care referral hospital in southern India. The study design was approved by Vydehi Institutional Ethics Committee and written informed consent was obtained from each subject. This study was carried out in accordance with the Declaration of Helsinki and US Federal Policy for the Protection of Human Subjects. The inclusion criteria were: patients with a diagnosis of FCPD or T2D, age between 18 and 65 years, HbA1c 6–12% and body mass index (BMI) <25 kg/m2. The exclusion criteria included subjects under treatment for coronary heart disease, systemic disorders such as chronic liver disease or chronic kidney disease or endocrine disorders (except hypothyroidism), and alcohol or substance abuse.
The diagnosis of FCPD was established based on the fulfillment of all three of the following criteria:Citation37 1) evidence of chronic pancreatitis: pancreatic calculi on X-ray or at least three of the following: abnormal pancreatic morphology on ultrasonography or computed tomography scan, chronic abdominal pain since childhood, steatorrhea and abnormal exocrine pancreatic function test; 2) diabetes defined according to the criteria of the American Diabetes Association; and 3) absence of other causes of chronic pancreatitis, such as autoimmune disorders, tumors, ischemia, hyperparathyroidism, pancreatic carcinoma, alcohol-related pancreatic diabetes, hypertriglyceridemia, hypercalcemia and biliary duct stone.
Initially, we recruited 80 consecutive consenting patients with FCPD between March 2017 and June 2018 attending the endocrine clinic. Subsequently, 36 patients with T2D matched for age, duration of diabetes and HbA1c, and consenting for the study were recruited. The patients with FCPD were further subgrouped into group A, with BMI <18.5 kg/m2 (n=37), and group B, with BMI >18.5 kg/m2 (n=43). Twenty-one patients with FCPD were newly diagnosed; the others had been under our treatment and on enzyme replacement for at least 3 months prior to the study. Thirty-six age-matched healthy subjects without any prior history of pancreatitis or family history of diabetes, and with BMI <25 kg/m2 and normal OGTT were recruited as controls. The controls were matched for BMI with FCPD group B. Eight subjects in our study were smokers and none of the participants in this series gave a history of habitual alcohol consumption.
Study measures
A detailed clinical history and demographic data were obtained from all the participants. Cigarette smoking status was assessed as per the National Health Interview Survey criteria and included both former and current smokers.Citation38 Alcohol status was assessed based on the Alcohol Use Disorders Identification Test, which includes 11 questions, and positive responses to any two questions are considered as abnormal.Citation39 Height, body weight and BMI were determined following the standard procedures.
OGTT
All subjects underwent a 2-hour OGTT in the morning at 08:00 h after a 12-hour overnight fast. Patients with FCPD and T2D were admitted at least 3 days prior to the study and were switched to a basal-bolus insulin regimen and titrated to maintain fasting plasma glucose (FPG) <130 mg/dL and 2-hour postprandial plasma glucose (PPG) in the range of 140–180 mg/dL. Subjects were asked to withhold oral anti-diabetic medications for 36 hours prior to the test. Long-acting and intermediate-acting insulins were withheld for 24 hours prior to the test. Hyperglycemia was corrected for 24 hours prior to the test using multiple short-acting insulin injections or insulin infusion, with blood glucose levels maintained in the range of 120–160 mg/dL. The last dose of short-acting insulin was given 8 hours prior to the study. All subjects were asked to abstain from the use of tobacco, caffeine and strong physical activity for 12 hours prior to the test. Fasting samples for blood glucose and insulin were obtained, and then 75 g of anhydrous glucose diluted in 300 mL of water was given to the patient, to be consumed over 5 minutes. Blood samples were drawn at 30, 60, 90 and 120 minutes after the ingestion of glucose for estimation of plasma glucose and serum insulin levels. About 2 mL of blood sample was drawn into fluoride Monovette tubes for glucose and 3 mL was drawn into serum separator tubes for insulin levels and cold centrifuged within 1 hour. Plasma glucose was analyzed by the hexokinase enzymatic reference method using a fully automated Beckman Coulter DXC-860i, and insulin levels were analyzed by chemiluminescence immunoassays on the same day using a Beckman Coulter DXI 600 Auto-Analyzer (Beckman Coulter, Brea, CA, USA).
Estimation of surrogate indices
Glucose and insulin areas under the curve (G AUC and I AUC) during the OGTT were computed using the trapezoidal method in Microsoft Excel. Surrogate indices of IS and insulin secretion were calculated according to previously published formulaeCitation16,Citation21,Citation23,Citation24,Citation26,Citation33,Citation40,Citation41 ().
Table 1 Insulin sensitivity and beta-cell function indices derived from fasting and OGTT measurements of glucose and insulin
Other investigations
Fasting samples for HbA1c, lipids, serum creatinine, serum calcium, serum inorganic phosphorus, serum albumin, hemoglobin and vitamin B12 were also collected and analyzed using a fully automated Beckman Coulter DXC-860i Auto-Analyzer (Beckman Coulter, Brea, CA, USA).
Statistical analyses
Descriptive statistics are presented as mean ± SD for continuous variables that are normally distributed, and median (25th and 75th percentiles) for the variables that are non-normally distributed. Categorical variables are reported as count (percentage). Assessment of the assumption of normality was assessed using Q-Q plot, Kolmogorov–Smirnov and Shapiro–Wilk tests. ANOVA was used to compare the outcome measures between the groups for normally distributed variables. Pairwise comparisons between the groups for normally distributed variables were performed using Bonferroni post-hoc tests. The Kruskal–Wallis test was used to compare the outcome measures of parameters with non-normal distribution. The Mann–Whitney U-test was used for post-hoc analysis of variables with non-normal distribution. The Pearson and Spearman rank correlation tests were used to estimate the correlation between the variables. A P-value <0.05 was considered statistically significant. All statistical analyses were performed using SPSS version 21.0 (IBM Corp., Armonk, NY, USA).
Results
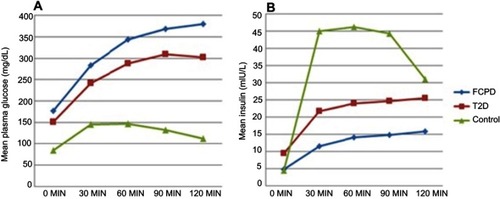
Baseline clinical and biochemical characteristics of the patients in each group are presented in . The FCPD and T2D groups were matched for age, gender and duration of diabetes. In the FCPD group, six patients were on metformin, two patients on sulphonylureas, three patients on a combination of sulphonylurea and insulin, eight patients on a combination of metformin and insulin, and the rest were on insulin alone. In the T2D group, 30 patients were on metformin, 18 patients on sulphonylureas, 12 patients on DPP4 inhibitors and 15 patients were on insulin in different combinations. The mean FPG and HbA1c levels were not significantly different between the two groups. Patients with FCPD had lower BMI compared to the T2D and control groups (P<0.001). However, the BMI of FCPD Group B was not significantly different from controls and both were significantly lower than the T2D group. Serum triglyceride and low-density lipoprotein levels were significantly higher in patients with T2D compared to FCPD (P<0.001). I AUC was significantly lower and G AUC significantly higher in the FCPD group compared to the T2D and control groups (P<0.05). Plasma glucose and insulin responses to OGTT are presented in .
Table 2 Baseline characteristics of the study population
Figure 1 Plasma glucose and insulin responses during the oral glucose tolerance test. (A) Glucose excursion; (B) insulin excursion.
Indices of insulin sensitivity
The comparison of insulin sensitivity indices is presented in . HOMA-IR was significantly higher in patients with T2D and FCPD compared to controls, and higher in T2D in comparison to patients with FCPD. QUICKI was significantly lower in the FCPD and T2D groups compared to controls, and higher in patients with FCPD compared to T2D (P<0.001). Matsuda-ISI was significantly lower in patients with FCPD and T2D compared to controls, and higher in patients with FCPD compared to patients with T2D. IS assessed using ISI-K was significantly lower in the FCPD and T2D groups than in the controls (P<0.001). OGIS also showed significantly reduced IS in patients with FCPD and T2D compared to the controls (P<0.001). Both ISI-K and OGIS were lower in the FCPD group compared to T2D. The Stumvoll index also showed significantly decreased IS in patients with FCPD and T2D compared to controls (P<0.001). The Stumvoll index was significantly lower in group B compared to group A (P<0.05). However, other insulin sensitivity indices were not significantly different between the two FCPD groups. Since BMI is a major determinant of Stumvoll index, an intergroup comparison was made between BMI-matched FCPD group B and controls, and it was significantly lower in group B (P<0.05). No significant difference was observed in the IS indices among FCPD patients with or without pancreatic enzyme replacement.
Table 3 Comparison of indices of insulin sensitivity between the three study groups
Indices of insulin secretion
The mean HOMA-ß was significantly lower in patients with FCPD and T2D compared to controls, and lower in the FCPD group in comparison to T2D (P<0.001). Both IGI and ODI were significantly lower in the FCPD group and T2D compared to controls (P<0.001). IGI was lower in the FCPD group in comparison to the T2D group. Comparisons of indices of insulin secretion are shown in . Subgroup analysis among patients with FCPD with or without pancreatic enzyme replacement revealed significantly lower IGI and ODI in the former group (P<0.05).
Table 4 Comparison of indices of beta-cell function between the three study groups
HOMA-IR and HOMA-ß showed significant positive correlation and QUICKI showed significant negative correlation with BMI in the control group (P<0.05) (data not shown). HOMA-IR showed significant negative correlation with age and HbA1c in patients with FCPD. QUICKI showed positive correlation with age and negative correlation with HbA1c in patients with FCPD (P<0.05). No significant correlation was observed between the indices of IS and insulin secretion with other clinical parameters, including HbA1c and duration of diabetes in patients with T2D.
Discussion
We evaluated the IS and insulin secretion in a large cohort of FCPD subjects and compared them with T2D and healthy controls. The results of our study indicate reduced IS in patients with FCPD. We also found that insulin secretion was decreased to a greater extent in patients with FCPD in comparison to patients with T2D.
HOMA-IR and QUICKI are largely determined by hepatic glucose output (HGO) and are considered as reliable measures of hepatic IR both in healthy subjects and in patients with diabetes.Citation25,Citation42–Citation44 QUICKI has been shown to be significantly lower, whereas HOMA-IR is significantly higher in patients with T2D than in healthy controls.Citation29 Likewise, several studies demonstrated a good correlation of these indices with SIclamp in subjects with T2D, although SIclamp is a measure of peripheral glucose uptake (PGU).Citation17,Citation19,Citation25,Citation27–Citation30,Citation45 Concerns regarding their utility in patients with T2D pertain to the fact that the linear correlation of HOMA-IR with SIclamp is lost and IR is underestimated in patients with fasting hyperglycemia and significantly impaired beta-cell function. QUICKI has been shown to offer a reasonable correction in such a situation, provided its reference values are established for each laboratory for healthy controls, because of significant interlaboratory variations in insulin estimations and/or possible population-specific differences.Citation46,Citation47 We recruited healthy controls for comparison and excluded patients with longer duration of diabetes to minimize this effect. Our results show that values of HOMA-IR and QUICKI in FCPD were in between those of T2D and controls. The HOMA-IR (median =1.72) clearly suggests the presence of IR in patients with FCPD compared to controls (median HOMA-IR =0.94). The results of our study are in concordance with an earlier study, which reported significantly higher HOMA-IR (>2) in 77.4% of patients with FCPD.Citation9 However, in a previous study, IR assessed by HOMA-IR was seen only in a minority of patients with CP.Citation11 In the same study, patients with CP were further classified into subgroups of alcoholic CP and tropical CP, and no significant differences were observed between the groups.
Reduced IS in the T2D group compared to FCPD using these measures could be attributed to higher BMI, higher triglyceride levels, and higher visceral and liver fat in the former group. Serum levels of triglyceride correlate with visceral fat and have been shown to be associated with IR in T2D patients.Citation48 However, the presence of hepatic IR in patients with FCPD with steatorrhea, lower BMI and lower triglyceride levels demands a different explanation. Three pathogenic mechanisms for hepatic IR have been proposed for patients with CP that can be extrapolated to FCPD. First, pancreatic polypeptide (PP) was shown to regulate the expression of the insulin receptor genes in the liver, and deficiency of PP due to pancreatic destruction reduced receptor expression and induced IR in experimental studies.Citation49 In support of this observation, reversal of hepatic IR following infusion of PP in patients with CP has also been demonstrated.Citation50 The second mechanism invokes impaired insulin-mediated downregulation of GLUT2 as a contributor to increased HGO in patients with CP.Citation51 Lastly, altered hepatic insulin action in CP has also been linked to the inflammation-based activation of hepatocyte I-κB kinase-β and nuclear factor-κB (NF-κB).Citation52 Blockade of NF-κB activation resulted in improved hepatic IS in rodents.Citation53
Glucose and insulin excursions during OGTT can be used to derive indices of IS that exploit the hyperbolic feedback relationship between IS and beta-cell function.Citation54 These indices provide a reasonable estimate of IS using a minimally invasive procedure and are applicable for large-scale screening and epidemiological studies without the need for more complex and invasive protocols. Plasma glucose excursions during OGTT reflect both HGO and PGU, as the suppression of HGO is not complete, unlike that observed with HIEC and also because some of these indices take into account both fasting and post-glucose load plasma glucose/insulin levels. This explains the lack of excellent correlation between these indices and HIEC, which estimates only PGU. All four OGTT-based indices of IS used in our study suggest reduced IS in patients with FCPD and T2D in comparison to controls. The values of Matsuda-ISI in the FCPD group were interposed between patients with T2D and controls, whereas the values of ISI-K and OGIS were lower in patients with FCPD compared to patients with T2D. These indices were chosen because of prior data in patients with T2D, including correlation with clamp studies.Citation24,Citation26,Citation30 Matsuda-ISI, a measure of whole-body IS, shows robust correlation with SI clamp, is a useful tool in characterizing IR status, and has previously been shown to be lower in patients with T2D than in healthy controls.Citation55,Citation56 Initially proposed as an index applicable even in advanced T2D, ISI-K was derived through multiple regression analysis of IS indices proposed by MatsudaCitation21, Gutt et alCitation57 and StumvollCitation23 et al, and estimates IS that is corrected for insulin deficiency, which is of relevance in patients with T2D in whom IR and insulin deficiency coexist. In a study conducted by Kanauchi et al, ISI-K decreased significantly with progression from IGT to T2D and showed high correlation with the HIEC (r=0.762) in T2D.Citation26 OGIS, which is based on a physiological model of glucose kinetics and insulin action, has shown results comparable to those of clamp, with significant correlation in subjects with T2D.Citation24 The values of OGIS in our study were comparable to those previously reported in T2D patients.Citation58 Likewise, Stumvoll yielded results comparable to those reported previously in patients with T2D.Citation59 In addition, when the patients were matched for BMI, the Stumvoll index was significantly lower in patients with FCPD in group B compared to T2D and controls. Since HGO and PGU contribute to a variable extent to the different OGTT-derived indices, and additional factors such as BMI determine the results of some of the indices, direct quantitative comparison of the results between FCPD and T2D is not possible.
IR has previously been demonstrated in smaller cohorts of FCPD using different techniques. Mohan et al assessed IS using an insulin tolerance test and showed that the mean glucose disposal rate was lower in FCPD compared to controls but higher than T2D.Citation8 Two euglycemic clamp studies conducted among patients with chronic calcifying pancreatitis and pancreatogenic diabetes found evidence of IR in CP and DEP.Citation60,Citation61 In another clamp study, IR was detected in three quarters of patients with CP even in the absence of obesity.Citation62 In contrast, a study that used continuous infusion of glucose with model assessment (CIGMA) did not find IR in patients with FCPD.Citation10 The potential mechanisms underlying peripheral IR in CP and FCPD are poorly understood, although chronic inflammatory mediators may play a role. A previous study that evaluated islet cell histology in FCPD patients reported a decrease in islet cell mass as well as paucity of alpha and beta cells.Citation63 In contrast, histological studies involving T2D patients showed a decrease in pancreatic beta-cell volume density and an increase in alpha-cell volume density.Citation64 Further studies are needed to elucidate the underlying mechanisms of peripheral IR in FCPD and the differences from those implicated in T2D.
The results of our study utilizing both static and OGTT-derived indices for insulin secretion showed significantly decreased insulin secretion in patients with FCPD and T2D compared to controls. Our results also suggest more severe impairment of beta-cell function in patients with FCPD compared to patients with T2D. IGI, a measure of early-phase insulin response, has previously been shown to be lower in T2D subjects compared to healthy subjects.Citation36 The ODI measures the beta-cell function adjusted for insulin sensitivity and has been shown to decrease progressively from normal glucose tolerance to IFG to T2D.Citation33 The IGI and ODI values were significantly lower in patients with FCPD on pancreatic enzyme replacement compared to FCPD patients not on replacement. FCPD patients not on enzyme replacement represent newly diagnosed cases, and hence the relatively higher values of insulin secretion indices among them reflects relative preservation of beta-cell function in the early stage of diabetes.
The findings of our study are in concordance with previous observations in FCPD using different measures of insulin secretion. Mohan et al reported that the mean fasting C-peptide level was significantly lower in the FCPD group than in the T2D and control groups.Citation8 In another study, C-peptide concentrations in patients with FCPD were significantly lower than the values in healthy controls and T2D patients, but were significantly higher than those with type 1 diabetes.Citation65 Yajnik et al found a reduced C-peptide response to OGTT in FCPD that improved after treatment.Citation66 Finally, a study that assessed beta-cell function using CIGMA in patients with TCP found that beta-cell function negatively correlated with the duration of pancreatitis.Citation10
The merits of this study are a relatively large sample size given the rarity of FCPD, and simultaneous assessment of insulin sensitivity and beta-cell function in comparison to T2D and healthy controls. In addition, the tests were performed under physiological conditions and define the IS and insulin secretion from a clinical standpoint. Our study findings help to further our understanding of the role of IR in the pathogenesis of FCPD. The study findings could be of importance in planning preventive strategies to reduce IR and exploring the potential role of medications that target IR.
Our study has a few limitations. The results of OGTT-based IS indices may have been potentially confounded by physiological factors such as variations in the rate of glucose absorption, incretin-stimulated insulin secretion, beta-cell function and non-insulin-mediated glucose uptake. Similarly, in patients with severe insulin secretory defect, the hyperbolic relation between IS and insulin secretion is lost and the curve is shifted leftwards and downwards.Citation54 This results in overestimation of IS using OGTT-based indices and may have potentially confounded our results. However, we excluded patients with longstanding diabetes to minimize this effect. Patients with FCPD had lower BMI compared to patients with T2D, and this could have biased the results of insulin sensitivity and secretion indices in FCPD group. Since the HbA1c levels were high, the impact of glucotoxicity on our findings, specifically on indices of insulin secretion, cannot be ruled out.
In summary, we showed that FCPD is associated with reduced IS, as evaluated by steady-state fasting and dynamic OGTT-based indices. FCPD was also associated with a more severe impairment of insulin secretion than in patients with T2D.
Acknowledgments
The authors wish to thank Gautham Kolla for his help in the study organization, Ramdas Barure for assistance with recruitment and data collection, and Sumitra Selvan for her help with data processing. We would also like to thank all the participants in the study. This research did not receive any specific grant from funding agencies in the public, commercial or not-for-profit sectors.
Disclosure
The authors report no conflicts of interest in this work.
References
- Pendharkar SA , Mathew J , Petrov MS . Age- and sex-specific prevalence of diabetes associated with diseases of the exocrine pancreas: a population-based study. Dig Liver Dis . 2017;49(5):540–544. doi:10.1016/j.dld.2016.12.010 28110921
- Woodmansey C , McGovern AP , McCullough KA , et al. Incidence, demographics, and clinical characteristics of diabetes of the exocrine pancreas (type 3c): a retrospective cohort study. Diabetes Care . 2017;40(11):1486–1493. doi:10.2337/dc17-0542.28860126
- Hardt PD , Brendel MD , Kloer HU , Bretzel RG . Is pancreatic diabetes (type 3c diabetes) underdiagnosed and misdiagnosed? Diabetes Care . 2008;31 Suppl2:S165–S169. doi:10.2337/dc08-s244 18227480
- Barman KK , Premalatha G , Mohan V . Tropical chronic pancreatitis. Postgrad Med J . 2003;79(937):606–615. doi:10.1136/pmj.79.937.606 14654569
- Kolly A , Shivaprasad C , Pulikkal AA , Atluri S , Sarathi V , Dwarakanath CS . High prevalence of serine protease inhibitor Kazal type 1 gene variations detected by whole gene sequencing in patients with fibrocalculous pancreatic diabetes. Indian J Endocrinol Metab . 2017;21(4):510–514. doi:10.4103/ijem.IJEM_116_17.28670531
- Unnikrishnan R , Mohan V . Fibrocalculous pancreatic diabetes (FCPD). Acta Diabetol . 2015;52(1):1–9. doi:10.1007/s00592-014-0685-9 25395047
- Dasgupta R , Naik D , Thomas N . Emerging concepts in the pathogenesis of diabetes in fibrocalculous pancreatic diabetes. J Diabetes . 2015;7(6):754–761. doi:10.1111/1753-0407.12280.25707547
- Mohan V , Ramachandran A , Vijay Kumar G , Snehalatha C , Viswanathan M . Insulin resistance in fibrocalculous (tropical) pancreatic diabetes. Horm Metab Res . 1988;20:746–748. doi:10.1055/s-2007-1010937 3220451
- Singla MK , Mukhopadhyay P , Pandit K , Chowdhury S . A clinical profile of fibrocalculous pancreatic diabetes patients from eastern India with special reference to body fat percentage and insulin resistance. J Indian Med Assoc . 2009;107:762–764.20469780
- Mehrotra RN , Bhatia E , Choudhuri G . Beta-cell function and insulin sensitivity in tropical calcific pancreatitis from north India. Metabolism . 1997;46(4):441–444. doi:10.1016/S0026-0495(97)90063-9 9109851
- Kumar KVSH , Manrai M , Sood AK , Sharma R . A clinical study of insulin resistance in patients with chronic pancreatitis. Diabetes Metab Syndr . 2017;11 Suppl 1:S283–S286. doi:10.1016/j.dsx.2017.03.003 28284910
- Ginsberg HN . Insulin resistance and cardiovascular disease. J Clin Invest . 2000;106(4):453–458. doi:10.1172/JCI10762 10953019
- Bergman RN , Prager R , Volund A , Olefsky JM . Equivalence of the insulin sensitivity index in man derived by the minimal model method and the euglycemic glucose clamp. J Clin Invest . 1987;79:790–800. doi:10.1172/JCI112886 3546379
- Borai A , Livingstone C , Kaddam I , Ferns G . Selection of the appropriate method for the assessment of insulin resistance. BMC Med Res Methodol . 2011;11:158. doi:10.1186/1471-2288-11-158.22112229
- Gutch M , Kumar S , Razi SM , Gupta KK , Gupta A . Assessment of insulin sensitivity/resistance. Indian J Endocrinol Metab . 2015;19(1):160–164. doi:10.4103/2230-8210.146874 25593845
- Matthews DR , Hosker JP , Rudenski AS , Naylor BA , Treacher DF , Turner RC . Homeostasis model assessment: insulin resistance and beta-cell function from fasting plasma glucose and insulin concentrations in man. Diabetologia . 1985;28(7):412–419. doi:10.1007/BF00280883 3899825
- Bonora E , Targher G , Alberiche M , et al. Homeostasis model assessment closely mirrors the glucose clamp technique in the assessment of insulin sensitivity: studies in subjects with various degrees of glucose tolerance and insulin sensitivity. Diabetes Care . 2000;23(1):57–63. doi:10.2337/diacare.23.1.57 10857969
- Lansang MC , Williams GH , Carroll JS . Correlation between the glucose clamp technique and the homeostasis model assessment in hypertension. Am J Hypertens . 2001;14(1):51–53.11206679
- Rabasa-Lhoret R , Bastard JP , Jan V , et al. Modified quantitative insulin sensitivity check index is better correlated to hyperinsulinemic glucose clamp than other fasting-based index of insulin sensitivity in different insulin-resistant states. J Clin Endocrinol Metab . 2003;88(10):4917–4923. doi:10.1210/jc.2002-030316 14557474
- Cheng C , Campbell KL , Kushner H , Falkner BE . Correlation of oral glucose tolerance test-derived estimates of insulin sensitivity with insulin clamp measurements in an African-American cohort. Metabolism . 2004;53(9):1107–1112. doi:10.1016/j.metabol.2004.04.004 15334368
- Matsuda M , DeFronzo RA . Insulin sensitivity indices obtained from oral glucose tolerance testing: comparison with the euglycemic insulin clamp. Diabetes Care . 1999;22(9):1462–1470. doi:10.2337/diacare.22.9.1462 10480510
- Lorenzo C , Haffner SM , Stancáková A , Laakso M . Relation of direct and surrogate measures of insulin resistance to cardiovascular risk factors in nondiabetic finnish offspring of type 2 diabetic individuals. J Clin Endocrinol Metab . 2010;95(11):5082–5090. doi:10.1210/jc.2010-1144 20702522
- Stumvoll M , Mitrakou A , Pimenta W , et al. Use of the oral glucose tolerance test to assess insulin release and insulin sensitivity. Diabetes Care . 2000;23(3):295–301. doi:10.2337/diacare.23.3.295 10868854
- Mari A , Pacini G , Murphy E , Ludvik B , Nolan JJ . A model-based method for assessing insulin sensitivity from the oral glucose tolerance test. Diabetes Care . 2001;24(3):539–548. doi:10.2337/diacare.24.3.539 11289482
- Katsuki A , Sumida Y , Gabazza EC , et al. Homeostasis model assessment is a reliable indicator of insulin resistance during follow-up of patients with type 2 diabetes. Diabetes Care . 2001;24(2):362–365. doi:10.2337/diacare.24.2.362 11213893
- Kanauchi M . A new index of insulin sensitivity obtained from the oral glucose tolerance test applicable to advanced type 2 diabetes. Diabetes Care . 2002;25(10):1891–1892. doi:10.2337/diacare.25.10.1891 12351505
- Sarafidis PA , Lasaridis AN , Nilsson PM , et al. Validity and reproducibility of HOMA-IR, 1/HOMA-IR, QUICKI and McAuley‘s indices in patients with hypertension and type II diabetes. J Hum Hypertens . 2007;21(9):709–716. doi:10.1038/sj.jhh.1002201 17443211
- Emoto M , Nishizawa Y , Maekawa K , et al. Homeostasis model assessment as a clinical index of insulin resistance in type 2 diabetic patients treated with sulfonylureas. Diabetes Care . 1999;22(5):818–822. doi:10.2337/diacare.22.5.818 10332688
- Yokoyama H , Emoto M , Fujiwara S , et al. Quantitative insulin sensitivity check index and the reciprocal index of homeostasis model assessment in normal range weight and moderately obese type 2 diabetic patients. Diabetes Care . 2003;26(8):2426–2432. doi:10.2337/diacare.26.8.2426 12882874
- Piché ME , Lemieux S , Corneau L , Nadeau A , Bergeron J , Weisnagel SJ . Measuring insulin sensitivity in postmenopausal women covering a range of glucose tolerance: comparison of indices derived from the oral glucose tolerance test with the euglycemic-hyperinsulinemic clamp. Metabolism . 2007;56(9):1159–1166. doi:10.1016/j.metabol.2007.04.002 17697856
- Song Y , Manson JE , Tinker L , et al. Insulin sensitivity and insulin secretion determined by homeostasis model assessment and risk of diabetes in a multiethnic cohort of women: the Women‘s Health Initiative Observational Study. Diabetes Care . 2007;30(7):1747–1752. doi:10.2337/dc07-0358 17468352
- Festa A , Williams K , Hanley AJ , Haffner SM . Beta-cell dysfunction in subjects with impaired glucose tolerance and early type 2 diabetes: comparison of surrogate markers with first-phase insulin secretion from an intravenous glucose tolerance test. Diabetes . 2008;57(6):1638–1644. doi:10.2337/db07-0954 18332099
- Utzschneider KM , Prigeon RL , Faulenbach MV , et al. Oral disposition index predicts the development of future diabetes above and beyond fasting and 2-h glucose levels. Diabetes Care . 2009;32:335–341. doi:10.2337/dc08-1478 18957530
- Tura A , Pacini G , Moro E , Vrbíková J , Bendlová B , Kautzky-Willer A . Sex- and age-related differences of metabolic parameters in impaired glucose metabolism and type 2 diabetes compared to normal glucose tolerance. Diabetes Res Clin Pract . 2018;146:67–75. doi:10.1016/j.diabres.2018.09.019 30287229
- Mohan V , Amutha A , Ranjani H , et al. Associations of β-cell function and insulin resistance with youth-onset type 2 diabetes and prediabetes among Asian Indians. Diabetes Technol Ther . 2013;15(4):315–322. doi:10.1089/dia.2012.0259 23484483
- Tura A , Kautzky-Willer A , Pacini G . Insulinogenic indices from insulin and C-peptide: comparison of beta-cell function from OGTT and IVGTT. Diabetes Res Clin Pract . 2006;72(3):298–301. doi:10.1016/j.diabres.2005.10.005 16325298
- Mohan V , Alberti KGMM . Diabetes in the tropics In: Alberti KGMM , Defronzo RA , Keen H , Zimmet P , editors. International Textbook of Diabetes Mellitus . Chichester: John Wiley and Sons Ltd; 1999:177–196.
- Backinger CL , Lawrence D , Swan J , et al. Using the National Health Interview Survey to understand and address the impact of tobacco in the United States: past perspectives and future considerations. Epidemiol Perspect Innov . 2008;5:8. doi:10.1186/1742-5573-5-8 19055824
- Bohn MJ , Babor TF , Kranzler HR , et al. The Alcohol Use Disorders Identification Test (AUDIT): validation of a screening instrument for use in medical settings. J Stud Alcohol . 1995;56(4):423–432. doi:10.15288/jsa.1995.56.423 7674678
- Katz A , Nambi SS , Mather K , et al. Quantitative insulin sensitivity check index: a simple, accurate method for assessing insulin sensitivity in humans. J Clin Endocrinol Metab . 2000;85(7):2402–2410. doi:10.1210/jcem.85.7.6661 10902785
- Phillips DI , Clark PM , Hales CN , Osmond C . Understanding oral glucose tolerance: comparison of glucose or insulin measurements during the oral glucose tolerance test with specific measurements of insulin resistance and insulin secretion. Diabet Med . 1994;11(3):286–292.8033528
- Wallace TM , Matthews DR . The assessment of insulin resistance in man. Diabet Med . 2002;19(7):527–534. doi:10.1046/j.1464-5491.2002.00745.x 12099954
- Tripathy D , Almgren P , Tuomi T , Groop L . Contribution of insulin-stimulated glucose uptake and basal hepatic insulin sensitivity to surrogate measures of insulin sensitivity. Diabetes Care . 2004;27(9):2204–2210. doi:10.2337/diacare.27.9.2204 15333485
- Hoffman RP . Indices of insulin action calculated from fasting glucose and insulin reflect hepatic, not peripheral, insulin sensitivity in African-American and Caucasian adolescents. Pediatr Diabetes . 2008;9(3 Pt 2):57–61. doi:10.1111/j.1399-5448.2007.00350.x 18221434
- George L , Bacha F , Lee S , Tfayli H , Andreatta E , Arslanian S . Surrogate estimates of insulin sensitivity in obese youth along the spectrum of glucose tolerance from normal to prediabetes to diabetes. J Clin Endocrinol Metab . 2011;96(7):2136–2145. doi:10.1210/jc.2010-2813 21508130
- Patarrão RS , Lautt WW , Macedo MP . Assessment of methods and indexes of insulin sensitivity. Rev Portuguesa De Endocrinologia Diabetes E Metabolismo . 2015;9(1). doi:10.1016/j.rpedm.2013.10.004
- Wallace TM , Levy JC , Matthews DR . Use and abuse of HOMA modeling. Diabetes Care . 2004;27(6):1487–1495. doi:10.2337/diacare.27.6.1487 15161807
- Taniguchi A , Nakai Y , Sakai M , et al. Relationship of regional adiposity to insulin resistance and serum triglyceride levels in nonobese Japanese type 2 diabetic patients. Metabolism . 2002;51(5):544–548. doi:10.1053/meta.2002.31984 11979383
- Seymour NE , Volpert AR , Lee EL , Andersen DK , Hernandez C . Alterations in hepatocyte insulin binding in chronic pancreatitis: effects of pancreatic polypeptide. Am J Surg . 1995;169(1):105–109. doi:10.1016/S0002-9610(99)80117-2 7817978
- Brunicardi FC , Chaiken RL , Ryan AS , et al. Pancreatic polypeptide administration improves abnormal glucose metabolism in patients with chronic pancreatitis. J Clin Endocrinol Metab . 1996;81(10):3566–3572. doi:10.1210/jcem.81.10.8855802 8855802
- Nathan JD , Zdankiewicz PD , Wang J , et al. Impaired hepatocyte glucose transport protein (GLUT2) internalization in chronic pancreatitis. Pancreas . 2001;22(2):172–178.11249072
- Cai D , Yuan M , Frantz DF , et al. Local and systemic insulin resistance resulting from hepatic activation of IKK-beta and NF-kappaB. Nat Med . 2005;11(2):183–190. doi:10.1038/nm1166 15685173
- Kiechl S , Wittmann J , Giaccari A , et al. Blockade of receptor activator of nuclear factor-κB (RANKL) signaling improves hepatic insulin resistance and prevents development of diabetes mellitus. Nat Med . 2013;19(3):358–363. doi:10.1038/nm.3084 23396210
- Kahn SE , Prigeon RL , McCulloch DK , et al. Quantification of the relationship between insulin sensitivity and beta-cell function in human subjects. Evidence for a hyperbolic function. Diabetes . 1993;42(11):1663–1672. doi:10.2337/diab.42.11.1663 8405710
- Yang G , Li C , Gong Y , et al. Assessment of insulin resistance in subjects with normal glucose tolerance, hyperinsulinemia with normal blood glucose tolerance, impaired glucose tolerance, and newly diagnosed type 2 diabetes (Prediabetes Insulin Resistance Research). J Diabetes Res . 2016;2016:9270768. doi:10.1155/2016/9270768 26770991
- Maki KC , Rains TM , Dicklin MR , Bell M . Repeatability of indices of insulin sensitivity and secretion from standard liquid meal tests in subjects with type 2 diabetes mellitus or normal or impaired fasting glucose. Diabetes Technol Ther . 2010;12(11):895–900. doi:10.1089/dia.2010.0083 20879960
- Gutt M, Davis CL, Spitzer SB, et al. Validation of the insulin sensitivity index (ISI(0,120)): comparison with other measures. Diabetes Res Clin Pract . 2000;47(3):177–184.10741566
- Wu CZ , Pei D , Su CC , et al. Comparison of oral glucose insulin sensitivity with other insulin sensitivity surrogates from oral glucose tolerance tests in Chinese. Ann Acad Med Singapore . 2010;39(1):4–8.20126806
- Stancáková A , Javorský M , Kuulasmaa T , Haffner SM , Kuusisto J , Laakso M . Changes in insulin sensitivity and insulin release in relation to glycemia and glucose tolerance in 6,414 Finnish men. Diabetes . 2009;58(5):1212–1221. doi:10.2337/db08-1607 19223598
- Ogoshi K , Nakano I , Ito T , et al. Impaired glucose tolerance and insulin resistance in chronic calcifying pancreatitis. J Jpn Diabetes Soc . 1999;42(8):651–656.
- Yki-Järvinen H , Kiviluoto T , Taskinen MR . Insulin resistance is a prominent feature of patients with pancreatogenic diabetes. Metabolism . 1986;35(8):718–727. doi:10.1016/0026-0495(86)90239-8 3736412
- Niebisz-Cieślak AB , Karnafel W . Insulin sensitivity in chronic pancreatitis and features of insulin resistance syndrome. Pol Arch Med Wewn . 2010;120(7–8):255–263.20693955
- Govindarajan M , Mohan V , Deepa R , et al. Histopathology and immunohistochemistry of pancreatic islets in fibro-calculous pancreatic diabetes. Diabetes Res Clin Pract . 2001;51:29–38.11137179
- Yagihashi S , Inaba W , Mizukami H . Dynamic pathology of islet endocrine cells in type 2 diabetes: β-Cell growth, death, regeneration and their clinical implications. J Diabetes Investig . 2015;7(2):155–165. doi:10.1111/jdi.12424
- Vannasaeng S , Nitiyanant W , Vichayanrat A , Ploybutr S , Harnthong S . C-peptide secretion in calcific tropical pancreatic diabetes. Metabolism . 1986;35(9):814–817. doi:10.1016/0026-0495(86)90221-0 3528743
- Yajnik CS , Kanitkar SV , Shelgikar KM , Naik SS , Alberti KG , Hockaday D . Pancreatic C-peptide response to oral glucose in fibrocalculous pancreatic diabetes. Improvement after treatment. Diabetes Care . 1990;13(5):525–527.2190776