
Abstract
Background
Type 2 diabetes, or T2D, is a metabolic disease that results in insulin resistance. In the present study, we hypothesize that metabolomic analysis in blood samples of T2D patients sharing the same ethnic background can recover new metabolic biomarkers and pathways that elucidate early diagnosis and predict the incidence of T2D.
Methods
The study included 34 T2D patients and 33 healthy volunteers recruited between the years 2012 and 2013; the secondary metabolites were extracted from blood samples and analyzed using HPLC.
Results
Principal coordinate analysis and hierarchical clustering patterns for the uncharacterized negatively and positively charged metabolites indicated that samples from healthy individuals and T2D patients were largely separated with only a few exceptions. The inspection of the top 10% secondary metabolites indicated an increase in fucose, tryptophan and choline levels in the T2D patients, while there was a reduction in carnitine, homoserine, allothreonine, serine and betaine as compared to healthy individuals. These metabolites participate mainly in three cross-talking pathways, namely “glucagon signaling”, “glycine, serine and threonine” and “bile secretion”. Reduced level of carnitine in T2D patients is known to participate in the impaired insulin-stimulated glucose utilization, while reduced betaine level in T2D patients is known as a common feature of this metabolic syndrome and can result in the reduced glycine production and the occurrence of insulin resistance. However, reduced levels of serine, homoserine and allothrionine, substrates for glycine production, indicate the depletion of glycine, thus possibly impair insulin sensitivity in T2D patients of the present study.
Conclusion
We introduce serine, homoserine and allothrionine as new potential biomarkers of T2D.
Introduction
Type 2 diabetes or T2D is an epidemic metabolic disease-causing millions of cases worldwide.Citation1 Incidence of the disease can be identified through measuring common clinical risk factors.Citation2–Citation4 Individuals with fasting glucose (IFG) of 5.6–7.0 mmol/L have an annual risk of 4.7% to be type 2 diabetic. Increased risk of T2D is associated with the impaired glucose tolerance (IGT) and the elevated HbA1c (39–46 mmol/mol [5.7–6.4%]).Citation5–Citation7 Ethnicity seems to influence the incidence rate of diabetes, and the conversion speed from normoglycaemia to dysglycaemia.Citation8
Many plasma metabolites were reported as biomarkers associated with the development of T2D.Citation9–Citation16 Alterations in these metabolites can be traced via their biological pathways, examples of which are the amino acid catabolismCitation9,Citation11–Citation14,Citation16,Citation17 and hexose metabolism.Citation12,Citation15 Previous studies indicated that plasma glycine level is a negative biomarker in patients with diabetes mellitus.Citation18–Citation21 Glycine metabolism pathway indicates the participation of many other important metabolites that mostly serve in the biosynthesis of glycine. However, many of these metabolites have not been proven to be associated with insulin resistance or diabetes.Citation22 In T2D patients, low plasma glycine level was found to be negatively correlated with insulin sensitivity.Citation23,Citation24 Insulin sensitizer therapy with pioglitazone + metformin for patients with T2D resulted in increased plasma glycine concentration as compared to placebo,Citation25 while reduced plasma glycine level was found to be a predictor for impaired glucose tolerance and T2D incidence.Citation12,Citation26,Citation27 The agency of the European Prospective Investigation into Cancer and Nutrition claimed that higher serum glycine is associated with decreased risk of incident T2D as glycine receptors existing in human pancreatic β-cells might stimulate or provoke secretion of insulin.Citation28 In addition, the reduced plasma betaine level was also found to act as a positive biomarker of diabetes mellitus and proved to be associated with incident T2D.Citation16,Citation21
Bile acid (BA) metabolism was reported to be involved in cholesterol as well as glucose metabolism homeostasis.Citation29 The latter authors claimed that insulin resistance is positively associated with hyperbileacidemia regardless of diabetes status, which indicates the important role of insulin resistance in the regulation of “bile secretion” pathway in human. BAs also exert a variety of metabolic reactions as they likely promote the secretion of incretin in the digestive tract, improve glucose tolerance, promote insulin secretion, thus positively increase insulin sensitivity.Citation30–Citation33 BAs were also found to be increased in diabetic population,Citation34,Citation35 while other authors claimed that total bile acids (TBAs) in serum were not changed in T2D patients as compared to control individuals.Citation35,Citation36
In the present study, we hypothesize that metabolomic analysis in blood samples of T2D patients with similar ethnic background can result in the recovery of metabolic biomarkers and pathways that elucidate early diagnosis and predict the incidence of T2D towards the prevention of the disease and its subsequent complications.
Materials and Methods
Participant Recruitment
The study included 34 T2D patients and 33 healthy volunteers recruited from Endocrinology clinics at King Abdulaziz University Hospital (KAUH) in Jeddah, Saudi Arabia between the years 2012 and 2013. As an exclusion criteria, we selected subjects with no comorbid conditions such as ESLD, ESRD, cancer, new onset diabetes after organ transplant, or a recent cardiovascular event within the 3 months prior to blood sampling time. As an inclusion criteria, subjects are mostly from the same ethnic background (Saudi individuals). Blood samples were further obtained from subjects to make some primary metabolic and physical measurements. Ethical approval from King Abdulaziz University Hospital (KAUH), Unit of Biomedical Ethics Research Committee, Jeddah, Saudi Arabia, was issued and written informed consents were obtained from eligible participants (Tables S1 and S2).
This study was conducted in accordance with the Declaration of Helsinki.
Sample Collection and Preparation
Blood samples were collected in the morning (8:00–10:30 am) after a period of ≥10 hrs fasting to avoid variation due to circadian rhythm. The metabolites were extracted from each aliquot in homogenous mixture of −20°C methanol:methyl-tert-butyl-ether:water (1:3:1), then, incubated for 10 mins in an ice cooled ultrasonication bath. The, 650 µL of UPLC-grade methanol:water 1:3, the homogenate was added, and mixture was vortexed and spun for 5 mins at 4°C in a table-top centrifuge. The lower aqueous phase contains the polar and semipolar metabolites. Then, annotation was done using in-house database in order to detect important negatively and positively charged secondary metabolites. R-software (http://cran.r-project.org/) was used for statistical analysis and visualization (PCoA & Hierarchical Clustering (HCA)).
Results
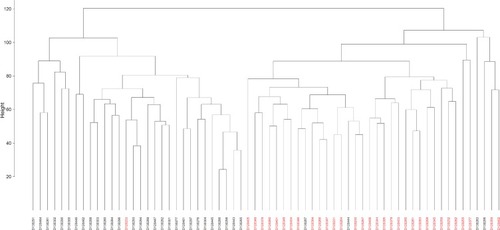
Principal coordinate analysis or PCoA ( and ) and hierarchical clustering or HCA ( and ) were performed for uncharacterized negatively charged (NeC) and positively (PoC) secondary metabolites, respectively, in order to detect the quality of the recovered data. The PCoA plots showed a similar tendency in the distances within each group. For the NeC metabolites, the diagram showed that most values of healthy group were localized in the positive direction of PC1 and negative direction of PC2, while those of T2D group were localized in the negative direction of PC1 and positive direction of PC2 (). The diagram of PCoA for PoC metabolites showed that most values of healthy group were localized in the positive directions of PCoA 1 (PC1) and PCoA 2 (PC2), while those of T2D group were localized in the negative direction of PC1 and almost distributed evenly at the PC2 direction (). HCA pattern of the NeC metabolites indicated partial separation between healthy and T2D individuals (). While HCA pattern of the PoC metabolites mostly indicated a complete separation between healthy and T2D individuals (). Overall, PCoA and HCA patterns across types of metabolites indicated that samples from healthy individuals and T2D patients were largely separated from only few outliers. These results demonstrate that such unannotated NeC and PoC metabolites can help in the separation of individuals with and without T2D (Tables S3 and S4, respectively). We also concluded that the whole yield of secondary metabolites, either PoC or NeC, are responsible for the separation, which proves that the discrimination between the two groups is due to a pattern. However, secondary metabolite data were not in linkage to features such as age, gender, BMI, ethnic background or any other confounding parameters utilized in the present study (Tables S1 and S2).
Figure 1 Principal coordinate analysis (PCoA) based on negatively charged secondary metabolites data of different control individuals (black dotted) and T2D patients (red dotted).
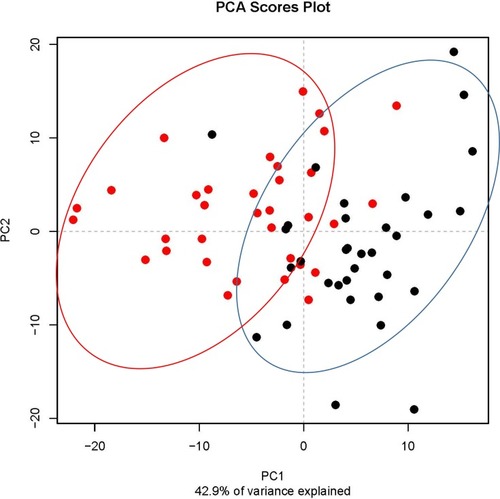
Figure 2 Principal coordinate analysis (PCoA) based on positively charged secondary metabolites data of different control individuals (black dotted) and T2D patients (red dotted).
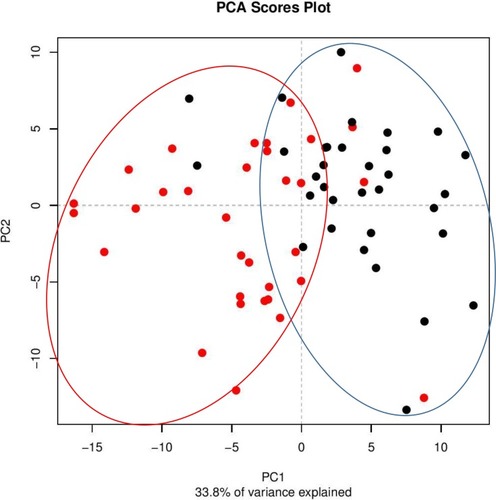
Figure 3 Hierarchical clustering (HCA) based on negatively charged secondary metabolites data for different control individuals (black coded) and T2D patients (red-coded). Subject IDs refer to those described in Tables S1 and S2.
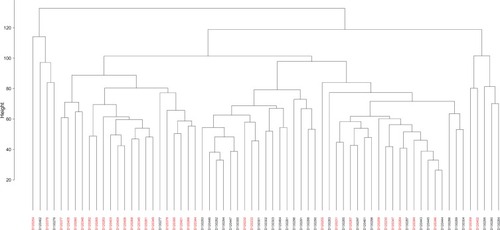
Figure 4 Hierarchical clustering (HCA) based on positively charged secondary metabolites data for different control individuals (black-coded) and T2D patients (red-coded). Subject IDs refer to those described in Tables S1 and S2.
The total numbers of NeC and PoC metabolites in the present study are 351 and 295, respectively. The inspection of the top 10% NeC and PoC secondary metabolites separating the two groups revealed numbers of eight and 24 metabolites, respectively (Table S5). These 32 metabolites were annotated. Of which, two NeC metabolites, namely fucose and tryptophan, separated the two groups of individuals as they were enriched in the T2D individuals as compared to healthy individuals ( and , respectively). In addition, a number of six PoC metabolites, namely choline, L-carnitine, betaine, homoserine, allothreonine, and serine separated the two groups of individuals in which choline is the only metabolite that was enriched in the T2D individuals as compared to healthy individuals (), while the rest were repressed (–, respectively). Levels of the other NeC and PoC metabolites in this study were arbitrary in control and T2D individuals. The overall results for the contribution of different regulated PoC or NeC metabolites in their corresponding cross-talking pathways are summarized in .
Figure 5 Analysis of the negatively charged secondary metabolite fucose for control female (red) and male (blue) individuals (as well as female (green) and male (orange) T2D patients). Streaked-colored columns refer to the mean values of the different groups. Original data are shown in Table S3. Subject IDs refer to those described in Tables S1 and S2.
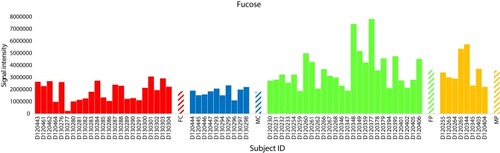
Figure 6 Analysis of the negatively charged secondary metabolite L-tryptophan for control female (red) and male (blue) individuals (as well as female (green) and male (orange) T2D patients). Streaked-colored columns refer to the mean values of the different groups. Original data are shown in Table S3. Subject IDs refer to those described in Tables S1 and S2.
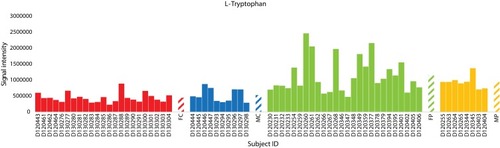
Figure 7 Analysis of the positively charged secondary metabolite choline for control female (red) and male (blue) individuals (as well as female (green) and male (orange) T2D patients). Streaked-colored columns refer to the mean values of the different groups. Original data are shown in Table S3. Subject IDs refer to those described in Tables S1 and S2.
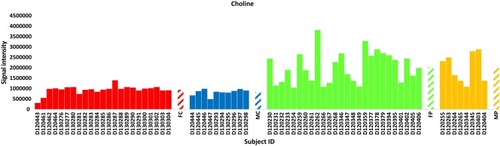
Figure 8 Analysis of the positively charged secondary metabolite L-carnitine for control female (red) and male (blue) individuals (as well as female (green) and male (orange) T2D patients). Streaked colored columns refer to the mean values of the different groups. Original data are shown in Table S3. Subject IDs refer to those described in Tables S1 and S2.
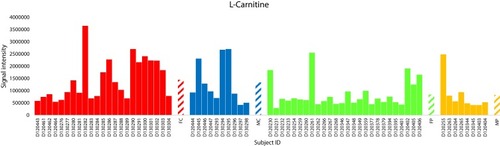
Figure 9 Analysis of the positively charged secondary metabolite betaine for control female (red) and male (blue) individuals (as well as female (green) and male (orange) T2D patients). Streaked-colored columns refer to the mean values of the different groups. Original data are shown in Table S3. Subject IDs refer to those described in Tables S1 and S2.
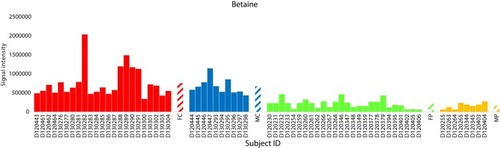
Figure 10 Analysis of the three positively charged secondary metabolite homoserine, allothreonine and serine for control female (red) and male (blue) individuals (as well as female (green) and male (orange) T2D patients). Streaked-colored columns refer to the mean values of the different groups. Original data are shown in Table S3. Subject IDs refer to those described in Tables S1 and S2.
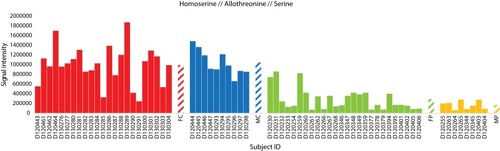
Figure 11 Demonstration of important steps in the three pathways, namely, “glycine, serine and threonine”, “bile secretion” and “glucagon signaling” describing the changes in seven separated metabolites due to the incidence of T2D. Metabolites in pink boxes were enriched in T2D patients, while those in light blue boxes were repressed in T2D patients as compared with those of healthy individuals. Metabolites in light green boxes were not detected in the present study and changes in their levels due to the disease were speculated. Levels of the detected metabolites are shown in Table S5.
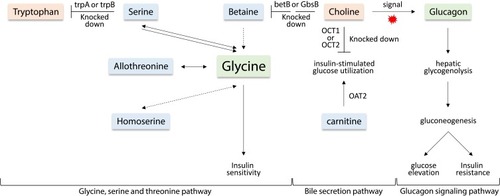
Three main cross-talking pathways seem to respond to the disease. They are “glucagon signaling”, “glycine, serine and threonine” and “bile secretion” pathways. Choline is shown to participate in the three pathways, while serine participated in the second and third pathways. Tryptophan, betaine, homoserine and allothrionine also participated in “glycine, serine and threonine” pathway, while carnitine participates in the “bile secretion” pathway. Thus, the regulated metabolites cross-linked the three pathways in a way to respond either positively or negatively to the occurrence of T2D incidence.
Discussion
Type 2 diabetes (T2D) is mainly characterized by impaired insulin production. It arises from insulin resistance of peripheral tissues followed by dysfunction of β-cells in the pancreas due to a sort of metabolic stress. The disease seems to result in differential metabolic activities that cross-link several pathways as a direct response to the disease. We firstly aimed to analyze the untargeted metabolomes of blood samples from patients suffering from T2D and healthy controls and found out that, although uncharacterized, metabolites were able to separate the two groups effectively. The associations of metabolomes of healthy and T2D patients with age, gender, BMI and general health seemed to be negative. The results shown in – demonstrated that the unannotated NeC and PoC metabolites allowed a nearly perfect separation of both groups with little intermingling. This separation was not due to single or a small number of metabolites, rather, it is due to a large number of compiled metabolites. Previous studies have successfully applied untargeted metabolomes, albeit individual metabolites associated with T2D were also identified.Citation37 We speculate that this work is one of the first that proves that broad coverage unbiased metabolome can be used as an overall biomarker or predictor for early diagnostics of T2D within the participating cohort of Saudi population. Further analysis can be done to strengthen this important conclusion when studying larger cohorts of Saudi population.
Levels of L-fucose and L-tryptophan in the present study were increased in T2D patients as compared to their levels in healthy individuals ( and , respectively). Serum L-fucose and tryptophan were previously reported to be significantly increased in diabetics when compared to the healthy controls. Shantaram et alCitation38 claimed that high L-fucose level in T2D patients can be a prognostic indicator for type II diabetes mellitus. L-Fucose is a monosaccharide that is a common component of many N- and O-linked glycans and glycolipids synthesized by mammalian cells. Chen et alCitation39 also indicated that tryptophan level in T2D patients positively correlate with insulin resistance and secretion. It was concluded that high levels of these two metabolites can be potential markers associated with the risk of diabetes.
Choline level was increased in the present study in T2D patients (). This metabolite has previously proven to promote insulin resistance in a mouse model. Excess amount of this metabolite acts as a signal to activate “glucagon signaling” pathway towards the increased production of plasma glucagon,Citation40 thus the occurrence of hepatic glycogenolysis/gluconeogenesis and the elevated plasma glucose (). Glucagon, a 29-amino acid peptide hormone, is important in glucose homeostasis and diabetes pathophysiology.Citation41–Citation44 Glucagon is counter-regulatory to insulin, stimulating hepatic glucose production, thereby increasing plasma glucose levels. Glucagon hormone generally opposes the action of insulin as it stimulates hepatic glucose production that results in the elevation of plasma glucose levels in T2D patients.Citation45 In other words, insulin is acting as a glucose-depositing and anabolic hormone, while glucagon acts as a glucose-mobilizing and catabolic hormone. Thus, the elevated level of choline in T2D patients of the present study can be an important biomarker of high glucagon level and T2D incidence. In addition, choline participates in the “glycine, serine and threonine” pathway and acts two steps upstream betaine towards promoting its level. As betaine showed opposite results to those of choline in terms of their levels in healthy individuals and T2D patients (), then we speculate that at least one of the two steps upstream betaine biosynthesis should have been knocked down ().
In the “bile secretion” pathway, choline is shown to require the action of two major facilitator superfamily (MFS) transporters, namely organic cation transporter 1 and 2 (OCT1 and OCT2) in order to exit plasma and be incorporated in hepatocytes. OCTs are responsible for the hepatic and renal transport of metformin (Glucophage XR), the treatment of T2D (). The latter two transporters were previously reported to be decreased in T2D patients.Citation46 We speculate that the accumulation of choline in plasma of T2D patients can be due to the decreased levels (knockdown) of OCT1 and OCT2. As indicated in the same pathway, carnitine requires the action of OAT2 gene for interring hepatocytes (). The latter conclusion was previously supported by Nowicki et alCitation47 In the present study, carnitine was reduced in T2D patients. High level of this metabolite is effective in improving insulin-stimulated glucose utilization and in reversing abnormalities of fuel metabolism associated with T2D. The encoded OAT2 protein was reported to possess transmembrane transporter activity that promotes amino acids availability in skeletal muscle cells and mammalian/mechanistic target of rapamycin complex 1 (mTORC1) activation.Citation48 The latter authors indicated that insulin level also positively correlates with mTORC1 activation.
Betaine level was also shown in the present study to be reduced in T2D patients (). Betaine is an osmolyte and methyl donor, and commonly reduced due to diabetes mellitus.Citation49 Betaine is essential for our life, and we can obtain it exogenouslyCitation50,Citation51 or endogenously by the mitochondrial oxidation of choline.Citation52 Many reports claimed that betaine deficiency is a common feature of metabolic syndrome such as T2D.Citation49,Citation53 The deficiency can result in the knockdown of downstream glycine biosynthetic steps in the “glycine, serine and threonine” pathway, thus promotes insulin resistance. Unfortunately, the list of the inspected top 10% NeC and PoC secondary metabolites separating the two groups did not include glycine and glucagon, thus, levels of the two metabolites were not detected in the present study.
For the first time, levels of serine, homoserine and allothrionine in the present study were shown to be reduced in T2D patients (). In the “glycine, serine and threonine” pathway, these three metabolites were shown to be effective substrates for glycine production. As levels of these three metabolites in the present study were reduced in T2D patients, this indicates that glycine can be depleted. As indicated earlier, plasma glycine level positively correlates with insulin sensitivity, while negatively correlated with insulin resistance.Citation23,Citation24 Reduced plasma glycine level was reported to be a predictor for impaired glucose tolerance in T2D patients.Citation12,Citation26,Citation27 We speculate that the level of the three metabolites might also be predictors for impaired glucose tolerance in T2D patients. As indicated earlier, there are opposite levels of tryptophan and serine as the latter can be depleted towards the production of plasma tryptophan by the action of trpA and/or trpB genes (). In healthy individuals, it seems that this reaction is knocked down, while possibly highly expressed in T2D patients.
In conclusion, we introduce serine, homoserine and allothrionine as new potential biomarkers of T2D and urge the detection of their possible participation in insulin resistance. This study can also help in the understanding of the complex biology of metabolic disorders like diabetes and provide a new insight into the biology of insulin sensitivity/resistance.
Acknowledgements
This project was funded by the Deanship of Scientific Research (DSR) at King Abdulaziz University, Jeddah, under grant no. 3-6-1432/HiCi. The authors, therefore, acknowledge with thanks DSR for technical and financial support.
Disclosure
The authors report that they have no conflicts of interest and have no affiliation with any organization with a direct or indirect financial interest in the subject matter discussed in the manuscript.
References
- Merino J , Leong A , Liu C-T , et al. Metabolomics insights into early type 2 diabetes pathogenesis and detection in individuals with normal fasting glucose. Diabetologia . 2018;61(6):1315–1324. doi:10.1007/s00125-018-4599-x 29626220
- Knowler WC , Barrett-Connor E , Fowler SE , et al. Reduction in the incidence of type 2 diabetes with lifestyle intervention or metformin. N Engl J Med . 2002;346(6):393–403.11832527
- Wilson PW , Meigs JB , Sullivan L , Fox CS , Nathan DM , D’Agostino RB . Sr. Prediction of incident diabetes mellitus in middle-aged adults: the Framingham Offspring Study. Arch Intern Med . 2007;167(10):1068–1074. doi:10.1001/archinte.167.10.1068 17533210
- DPPRG. Long-term effects of lifestyle intervention or metformin on diabetes development and microvascular complications over 15-year follow-up: the diabetes prevention program outcomes study. Lancet Diabetes Endocrinol . 2015;3:866–875. doi:10.1016/S2213-8587(15)00291-0 26377054
- de Vegt F , Dekker JM , Jager A , et al. Relation of impaired fasting and postload glucose with incident type 2 diabetes in a Dutch population: the Hoorn Study. JAMA . 2001;285(16):2109–2113. doi:10.1001/jama.285.16.2109 11311100
- Hayashino Y , Fukuhara S , Suzukamo Y , Okamura T , Tanaka T , Ueshima H . Normal fasting plasma glucose levels and type 2 diabetes: the high-risk and population strategy for occupational health promotion (HIPOP-CHP) study. Acta Diabetol . 2007;44(3):164–166. doi:10.1007/s00592-007-0258-2 17721756
- Choi SH , Kim TH , Lim S , Park KS , Jang HC , Cho NH . Hemoglobin A1c as a diagnostic tool for diabetes screening and new-onset diabetes prediction: a 6-year community-based prospective study. Diabetes Care . 2011;34(4):944–949. doi:10.2337/dc10-0644 21335372
- Anjana RM , Rani CSS , Deepa M , et al. Incidence of diabetes and prediabetes and predictors of progression among Asian Indians: 10-year follow-up of the Chennai Urban Rural Epidemiology Study (CURES). Diabetes Care . 2015;38(8):1441–1448. doi:10.2337/dc14-2814 25906786
- Newgard CB , An J , Bain JR , et al. A branched-chain amino acid-related metabolic signature that differentiates obese and lean humans and contributes to insulin resistance. Cell Metab . 2009;9(4):311–326. doi:10.1016/j.cmet.2009.02.002 19356713
- Rhee EP , Cheng S , Larson MG , et al. Lipid profiling identifies a triacylglycerol signature of insulin resistance and improves diabetes prediction in humans. J Clin Invest . 2011;121(4):1402–1411. doi:10.1172/JCI44442 21403394
- Wang TJ , Larson MG , Vasan RS , et al. Metabolite profiles and the risk of developing diabetes. Nat Med . 2011;17(4):448–453. doi:10.1038/nm.2307 21423183
- Floegel A , Stefan N , Yu Z , et al. Identification of serum metabolites associated with risk of type 2 diabetes using a targeted metabolomic approach. Diabetes . 2013;62(2):639–648. doi:10.2337/db12-0495 23043162
- Wang TJ , Ngo D , Psychogios N , et al. 2-Aminoadipic acid is a biomarker for diabetes risk. J Clin Invest . 2013;123(10):4309–4317. doi:10.1172/JCI64801 24091325
- Walford GA , Porneala BC , Dauriz M , et al. Metabolite traits and genetic risk provide complementary information for the prediction of future type 2 diabetes. Diabetes Care . 2014;37(9):2508–2514. doi:10.2337/dc14-0560 24947790
- Drogan D , Dunn WB , Lin W , et al. Untargeted metabolic profiling identifies altered serum metabolites of type 2 diabetes mellitus in a prospective, nested case control study. Clin Chem . 2015;61(3):487–497. doi:10.1373/clinchem.2014.228965 25524438
- Walford GA , Ma Y , Clish C , et al. Metabolite profiles of diabetes incidence and intervention response in the diabetes prevention program. Diabetes . 2016;65(5):1424–1433. doi:10.2337/db15-1063 26861782
- Newgard CB . Interplay between lipids and branched-chain amino acids in development of insulin resistance. Cell Metab . 2012;15(5):606–614. doi:10.1016/j.cmet.2012.01.024 22560213
- Felig P , Marliss E , Ohman JL , Cahill CF Jr. Plasma amino acid levels in diabetic ketoacidosis. Diabetes . 1970;19(10):727–728. doi:10.2337/diab.19.10.727 4990780
- Wahren J , Felig P , Cerasi E , Luft R . Splanchnic and peripheral glucose and amino acid metabolism in diabetes mellitus. J Clin Invest . 1972;51(7):1870–1878. doi:10.1172/JCI106989 5032528
- Drabkova P , Sanderova J , Kovarik J , Kandar R . An assay of selected serum amino acids in patients with type 2 diabetes mellitus. Adv Clin Exp Med . 2015;24(3):447–451. doi:10.17219/acem/29223 26467133
- Adeva-Andany M , Souto-Adeva G , Ameneiros-Rodriguez E , Fernandez-Fernandez C , Donapetry-Garcia C , Dominguez-Montero A . Insulin resistance and glycine metabolism in humans. Amino Acids . 2018;50(1):11–27. doi:10.1007/s00726-017-2508-0 29094215
- Xie W , Wood AR , Lyssenko V , et al. Genetic variants associated with glycine metabolism and their role in insulin sensitivity and type 2 diabetes. Diabetes . 2013;62(6):2141–2150. doi:10.2337/db12-0876 23378610
- Thalacker-Mercer AE , Ingram KH , Guo F , Ilkayeva O , Newgard CB , Garvey WT . BMI, RQ, diabetes, and sex affect the relationships between amino acids and clamp measures of insulin action in humans. Diabetes . 2014;63(2):791–800. doi:10.2337/db13-0396 24130332
- Takashina C , Tsujino I , Watanabe T , et al. Associations among the plasma amino acid profile, obesity, and glucose metabolism in Japanese adults with normal glucose tolerance. Nutr Metab (Lond) . 2016;13(1):5. doi:10.1186/s12986-015-0059-5 26788116
- Irving BA , Carter RE , Soop M , et al. Effect of insulin sensitizer therapy on amino acids and their metabolites. Metabolism . 2015;64(6):720–728. doi:10.1016/j.metabol.2015.01.008 25733201
- Wang-Sattler R , Yu Z , Herder C , et al. Novel biomarkers for pre-diabetes identified by metabolomics. Mol Syst Biol . 2012;8(1):615. doi:10.1038/msb.2012.43 23010998
- Palmer ND , Stevens RD , Antinozzi PA , et al. Metabolomic profile associated with insulin resistance and conversion to diabetes in the Insulin Resistance Atherosclerosis Study. J Clin Endocrinol Metab . 2015;100(3):E463–468. doi:10.1210/jc.2014-2357 25423564
- Yan-Do R , Duong E , Fox JEM , et al. A glycine-insulin autocrine feedback loop enhances insulin secretion from human β-cells and is impaired in type 2 diabetes. Diabetes . 2016;65(8):2311–2321. doi:10.2337/db15-1272 27207556
- Sun W , Zhang D , Wang Z , et al. Insulin resistance is associated with total bile acid level in type 2 diabetic and nondiabetic population: a cross-sectional study. Medicine . 2016;95:10. doi:10.1097/MD.0000000000004864
- Duran-Sandoval D , Cariou B , Percevault F , et al. The farnesoid X receptor modulates hepatic carbohydrate metabolism during the fasting-refeeding transition. J Biol Chem . 2005;280(33):29971–29979. doi:10.1074/jbc.M501931200 15899888
- Ma K , Saha PK , Chan L , Moore DD . Farnesoid X receptor is essential for normal glucose homeostasis. J Clin Invest . 2006;116(4):1102–1109. doi:10.1172/JCI25604 16557297
- Fiorucci S , Mencarelli A , Palladino G , Cipriani S . Bile-acid-activated receptors: targeting TGR5 and farnesoid-X-receptor in lipid and glucose disorders. Trends Pharmacol Sci . 2009;30(11):570–580. doi:10.1016/j.tips.2009.08.001 19758712
- Thomas C , Gioiello A , Noriega L , et al. TGR5-mediated bile acid sensing controls glucose homeostasis. Cell Metab . 2009;10(3):167–177. doi:10.1016/j.cmet.2009.08.001 19723493
- Brufau G , Bahr MJ , Staels B , et al. Plasma bile acids are not associated with energy metabolism in humans. Nutr Metab (Lond) . 2010;7(1):73. doi:10.1186/1743-7075-7-73 20815878
- Cariou B , Chetiveaux M , Zair Y , et al. Fasting plasma chenodeoxycholic acid and cholic acid concentrations are inversely correlated with insulin sensitivity in adults. Nutr Metab (Lond) . 2011;8(1):48. doi:10.1186/1743-7075-8-48 21736725
- Herrema H , Meissner M , van Dijk TH , et al. Bile salt sequestration induces hepatic de novo lipogenesis through farnesoid X receptor – and liver X receptor α-controlled metabolic pathways in mice. Hepatology . 2010;51(3):806–816. doi:10.1002/hep.23408 19998408
- Savolainen O , Fagerberg B , Lind MV , Sandberg A-S , Ross AB , Bergström G . Biomarkers for predicting type 2 diabetes development – can metabolomics improve on existing biomarkers? PLoS One . 2017;12(7):e0177738. doi:10.1371/journal.pone.0177738 28692646
- Shantaram M . Serum L-Fucose, Total Sialic Acid and Ceruloplasmin Levels in Type II Diabetic Subjects of Somwarpet Taluk – A Preliminary Study .
- Chen T , Zheng X , Ma X , et al. Tryptophan predicts the risk for future type 2 diabetes. PLoS One . 2016;11(9):e0162192. doi:10.1371/journal.pone.0162192 27598004
- Wu G , Zhang L , Li T , et al. Choline supplementation promotes hepatic insulin resistance in phosphatidylethanolamine N-methyltransferase-deficient mice via increased glucagon action. J Biol Chem . 2013;288(2):837–847. doi:10.1074/jbc.M112.415117 23179947
- Unger RH , Cherrington AD . Glucagonocentric restructuring of diabetes: a pathophysiologic and therapeutic makeover. J Clin Invest . 2012;122(1):4–12. doi:10.1172/JCI60016 22214853
- Lund A , Bagger JI , Christensen M , Knop FK , Vilsboll T . Glucagon and type 2 diabetes: the return of the alpha cell. Curr Diab Rep . 2014;14(12):555. doi:10.1007/s11892-014-0555-4 25344790
- Ceriello A , Genovese S , Mannucci E , Gronda E . Glucagon and heart in type 2 diabetes: new perspectives. Cardiovasc Diabetol . 2016;15(1):123. doi:10.1186/s12933-016-0440-3 27568179
- Muller TD , Finan B , Clemmensen C , DiMarchi RD , Tschop MH . The new biology and pharmacology of glucagon. Physiol Rev . 2017;97(2):721–766. doi:10.1152/physrev.00025.2016 28275047
- Unger RH , Orci L . Glucagon and the A cell: physiology and pathophysiology (first two parts). N Engl J Med . 1981;304(25):1518–1524. doi:10.1056/NEJM198106183042504 7015132
- Grover B , Buckley D , Buckley AR , Cacini W . Reduced expression of organic cation transporters rOCT1 and rOCT2 in experimental diabetes. J Pharmacol Exp Ther . 2004;308(3):949–956. doi:10.1124/jpet.103.058388 14718608
- Manautou JE , Nowicki MT , Aleksunes LM , Sawant SP , Dnyanmote AV , Mehendale HM . Renal and hepatic transporter expression in type 2 diabetic rats. Drug Metab Lett . 2008;2(1):11–17. doi:10.2174/187231208783478425 19356064
- Walker DK , Drummond MJ , Dickinson JM , et al. Insulin increases mRNA abundance of the amino acid transporter SLC7A5/LAT1 via an mTORC1-dependent mechanism in skeletal muscle cells. Physiol Rep . 2014;2(3):e00238. doi:10.1002/phy2.238 24760501
- Lever M , Slow S , McGregor DO , Dellow WJ , George PM , Chambers ST . Variability of plasma and urine betaine in diabetes mellitus and its relationship to methionine load test responses: an observational study. Cardiovasc Diabetol . 2012;11(1):34. doi:10.1186/1475-2840-11-34 22510294
- Zeisel SH , Mar MH , Howe JC , Holden JM . Concentrations of choline-containing compounds and betaine in common foods. J Nutr . 2003;133(5):1302–1307. doi:10.1093/jn/133.5.1302 12730414
- Slow S , Donaggio M , Cressey PJ , Lever M , George PM , Chambers ST . The betaine content of New Zealand foods and estimated intake in the New Zealand diet. J Food Compos Anal . 2005;18(6):473–485. doi:10.1016/j.jfca.2004.05.004
- Zhang J , Blusztajn JK , Zeisel SH . Measurement of the formation of betaine aldehyde and betaine in rat liver mitochondria by a high pressure liquid chromatography-radioenzymatic assay. Biochim Biophys Acta . 1992;1117(3):333–339. doi:10.1016/0304-4165(92)90033-Q 1420283
- Lever M , Slow S . The clinical significance of betaine, an osmolyte with a key role in methyl group metabolism. Clin Biochem . 2010;43(9):732–744. doi:10.1016/j.clinbiochem.2010.03.009 20346934