
Abstract
Background
Previous studies have suggested that the non-high-density lipoprotein cholesterol (non-HDL-C) is strongly associated with metabolic syndrome (MetS); however, the explicit relationship between them has not yet been clarified. The aim of this study was to reveal the explicit association between the non-HDL-C with MetS.
Methods
The present study was based on a cross-sectional study, which was carried out in Spain. A total of 60,799 workers were recruited between 2012 and 2016. Anthropometric parameters and blood indices (lipid profile and fasting blood glucose) were collected. Participants were divided into the MetS group or the non-MetS group based on the criteria of the National Cholesterol Education Program Adult Treatment Panel III. The relationship between serum non-HDL-C and the risk of MetS was evaluated using multivariate regression analysis, piece-wise linear regression analysis, smooth curve fitting and threshold saturation effect analysis after adjustment of potential confounders.
Results
The risk of developing MetS increased with increasing non-HDL-C level. However, this association was only presented in the range of the non-HDL-C concentrations from 118 mg/dl to 247 mg/dl after adjusting for potential confounders. When compared to lower non-HDL-C level (<118 mg/dl), higher levels of non-HDL-C (118–247 mg/dl and >247 mg/dl) were related to higher incidence of MetS, with adjusted odds ratio (95% confidence interval) of 3.08 (2.77, 3.42) and 17.18 (14.29, 20.65), respectively (P for trend <0.05).
Conclusion
Higher serum non-HDL-C level was associated with increased MetS incidence; however, significant threshold saturation effects were observed when the non-HDL-C level <118 mg/dl or >247 mg/dl.
Introduction
Metabolic syndrome (MetS) is an array of metabolic abnormalities, mainly characterized by central obesity, atherogenic dyslipidemia, hypertension, hyperglycemia, and insulin resistance.Citation1–Citation3 It has been recognized that MetS is related to an increased risk for several disorders, such as more than twofold increased risk for cardiovascular disease (CVD) and fivefold increased risk for type 2 diabetes.Citation1 Alarmingly, MetS has come forth with a rapidly increasing incidence worldwide during the last decades. It was reported that MetS affects more than one fifth of the population in the United States, a quarter in Europe and 15% in China.Citation3–Citation5
Nevertheless, the pathogenic mechanisms of MetS are still not fully clarified.Citation3,Citation6 The mainstay of treatment regimens recommended currently is lifestyle adjustments and risk factors modifications.Citation1 Atherogenic dyslipidemia is one of the core components of MetS. Conventionally, the role of high-density lipoprotein cholesterol (HDL-C) and triglycerides in MetS is often been emphasized, and they have been included in the MetS criteria proposed by multiple authorities (the International Diabetes Federation, the American Heart Association, the National Heart Lung and Blood Institute, the World Heart Federation, the International Atherosclerosis Society, and the International Association for the Study of Obesity).Citation1 Recently, the non-HDL-C level was reported to have a strong association with MetS.Citation7,Citation8 Moreover, the non-HDL-C has showed great value in predicting the risk for CVD.Citation9–Citation13 On the other hand, non-HDL-C has the advantage of not being influenced by the prandial situation.Citation14 Both good predictive potential and non-fasting detection make non-HDL-C a promising marker for the risk assessment and prediction of MetS. Therefore, it would be clinically useful to identify the specific relationship between the non-HDL-C and the risk of MetS.
The hypothesis of the present study was that there are concentration-dependent effect and threshold effect of non-HDL-C levels on the incidence of MetS, and we performed this study based on a previous cross-sectional study of a large sample.
Methods
Study Population and Data Collection
The present study was a secondary analysis of a cross-sectional study conducted by Romero-Saldaña et al in Spain from 2012 to 2016. In the previously published article,Citation15 Romero-Saldaña et al validated a non-invasive method for the early detection of MetS using the data of 60,799 workers aged 20–70 years from different economic departments, such as public administration and health services. The used data in this study were obtained from a public database (www.Datadryad.org) that permits users to freely download raw data.Citation16 The data could be used for secondary analysis without infringing on the authors’ rights because authors of the original study have waived all copyright and related ownership of these data on this public database. The following variables were collected in their study: a. anthropometric variables: gender, age, smoking status, systolic blood pressure (SBP), diastolic BP (DBP), waist circumference (WC), body mass index (BMI), waist/height ratio (WHtR), body fat (BF)% (calculated by the formula: BF% = 1.2 × (BMI) + 0.23 × age (years) - 10.8 × gender (male = 1; female = 0) - 5.4), and a body shape index (ABSI) (calculated by the formula: ABSI = WC/((BMI)2/3(height)1/2)); b. laboratory parameters: total cholesterol (TC), HDL-C, LDL-C, triglycerides, and fasting blood glucose (FBG). In the present study, the non-HDL-C was calculated as the TC minus HDL-C.Citation7 Concentrations of cholesterol and triglycerides in serum were determined according to the standard procedures of the clinical biochemical laboratory using an autoanalyser (SYNCHRON CXH9 PRO, Beckman Coulter, Brea, California, USA).Citation15 The ethics committee of Jinhua Municipal Central Hospital (Jinhua, China) approved this secondary analysis and informed consent was waived because all the participant information was anonymous.
In the present study, the diagnosis of MetS was made when participants met three of the following five criteria proposed by the National Cholesterol Education Program Adult Treatment Panel III (NCEP-ATP III),Citation17 which were: (1) Abdominal obesity (WC ≥ 102 cm in men and ≥ 88 cm in women), (2) Triglycerides ≥ 150 mg/dl, (3) HDL-C < 40 mg/dl in men and < 50 mg/dl in women, (4) BP ≥ 130/85 mmHg, and (5) Fasting glucose ≥ 100 mg/dl. Three consecutive BP measurements were recorded with one interval between two measurements of the subjects in the supine position, and the average value was adopted.Citation15
Statistical Analysis
Descriptive statistics were used to summarize the participant’s anthropometry and laboratory tests. Categorical data were expressed as the number and the percentage, and continuous data were indicated as the mean ± standard deviation. Unpaired t-test and Pearson chi-squared test were performed between the MetS group and the non-MetS group for comparison. Multiple regression analysis, piece-wise linear regression analysis, smooth curve fitting, and threshold saturation effect analysis were used to evaluate the association between non-HDL-C levels and the risk of MetS, with or without adjustment for potential confounders. In the present study, we performed a multicollinearity test for the selection of adjusted variables. Besides, the following adjustment strategies were adopted: variables producing a change of matched odds ratio (OR) by at least 10% after introducing them into the basic model or removing them from the completed model and variables that judged by clinical significance.Citation18 R software (version 3.5.1) was used for statistical analysis. P value <0.05 was considered statistically significant.
Results
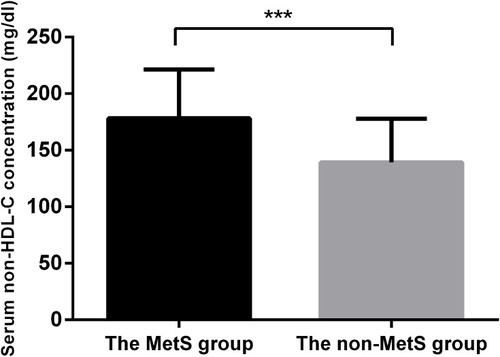
Of the 60,799 participants, 9.0% (5587/60,799) met the diagnostic criterion of MetS according to the NCEP-ATP III. Significant differences in baseline characteristics and laboratory tests were observed between the MetS group and the non-Mets group (). The non-HDL-C concentration was significantly higher in the MetS group than in the non-MetS group (, P < 0.001).
Table 1 Baseline Characteristics, Anthropometric Variables and Laboratory Tests of the Study Cohort
Figure 1 Comparison of serum non-HDL-C concentration between the MetS group and the non-MetS group. The mean non-HDL-C concentration was significantly higher in the MetS group than that in the non-MetS group. *** P < 0.001.
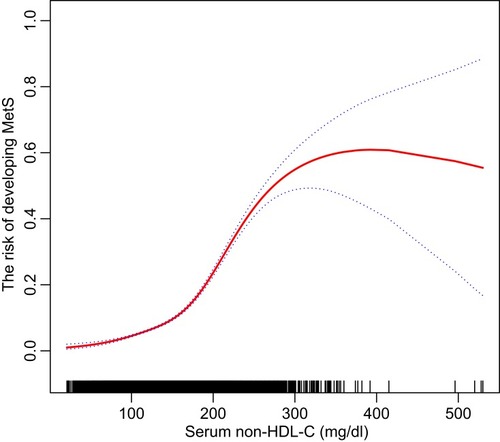
In the smooth curve fitting (), a non-linear relationship was observed between the non-HDL-C and the risk of MetS. Furthermore, significant threshold effects were detected by using a two-piecewise linear regression analysis (). The risk of developing MetS increased with increasing level of the non-HDL-C above the threshold point I (non-HDL-C concentration = 118 mg/dl) (OR, 1.02; 95% confidence interval [CI], 1.02–1.02; P < 0.01). The threshold point II was detected at the non-HDL-C concentration of 247 mg/dl, above which no statistically significant difference was yielded between increased non-HDL-C level and the risk of MetS (OR, 1.00; 95% CI, 1.00–1.01; P > 0.05).
Table 2 Threshold Effect of Non-HDL-C on the Prevalence of MetS in a Two-Piecewise Linear Regression
Figure 2 A non-linear association between the risk of MetS and serum non-HDL-C concentration is showed by using a smooth curve fitting after adjusting for the potential confounders (gender and age). The threshold saturation effects were observed at 118 mg/dl and 247 mg/dl in a two-piecewise linear regression analysis. Dotted lines represented 95% CI.
In the unadjusted model, a significant positive correlation was observed between the non-HDL-C level and the risk of MetS (P < 0.01). In multicollinearity test, variables of age, BF, BMI, WHtR, TC and LDL-C were filtered off, and these variables were not included in the adjustment analysis except age judged by clinical significance.Citation19 Additionally, in order to avoid over-adjustment in the model, variables of SBP, DBP, WC, HDL-C and FBG were also not included in the adjusted model. In adjusted model, after adjusting for gender and age, the strong association between them did not change (, P < 0.01). Higher levels of non-HDL-C (118–247 mg/dl and >247 mg/dl) were significantly associated with increased risk of MetS when compared to the lower levels of non-HDL-C (<118 mg/dl) with the OR and 95% CI of 3.08 (2.77, 3.42) and 17.18 (14.29, 20.65), respectively (P for trend <0.01).
Table 3 Multivariate Regression Analysis of Serum Non-HDL-C with the Risk of Developing MetS
Discussion
The present study showed that serum non-HDL-C level was significantly associated with the risk of MetS with threshold effects. Specifically, it indicated that maintaining serum non-HDL-C concentration at a lower level could help individuals in preventing MetS, and the optimal reference threshold may be at 118 mg/dl.
Nowadays, MetS has emerged as a serious clinical and public health challenge.Citation2 During the past several decades, the estimated prevalence of MetS in adults varied from one-quarter to one-third based on different age, gender, ethnic backgrounds, socioeconomic status, and the diagnostic criteria adopted.Citation2 Since lifestyle adjustment and risk modification is still the mainstay of treatment for MetS, early detection and early potential risk factor modification become particularly critical.Citation1
Dyslipidemia is an indispensable feature of MetS, and as biomarkers, HDL-C and triglycerides have aroused enough emphasis on developing MetS.Citation1 Recently, the role of non-HDL-C in developing MetS drew more attention from researchers. It has been reported that the non-HDL-C positively correlated to the prevalence of MetS.Citation7,Citation8 Khan et al found that the non-HDL-C levels were higher in subjects with MetS than those without MetS in a comparative cross-sectional study cohort of 229 participants,Citation7 and the authors suggested that, as a predictor for MetS, the non-HDL-C performs better than the LDL-C. In addition, both Al-Hashmi et alCitation9 and xiao et alCitation10 in their studies pointed out the non-HDL-C has the potential to be an excellent risk predictor for CVD. Non-HDL-C, as a multi-components lipid parameter, mainly contains LDL-C, very LDL-C, and triglycerides; therefore, it can depict the risk of MetS in a multi-lipids dimensional view in clinical practice. Moreover, Non-HDL-C has the advantage of being detection on non-fasting status, which implies that it would be more convenient than HDL-C, LDL-C, and triglycerides in application.Citation14 However, the specific relationship between non-HDL-C and the developing MetS has not yet been clarified.
In the present study, we conducted a secondary analysis of a large cross-sectional study,Citation15 which collected the data from a total of 60,799 workers in Spain. We found that the serum non-HDL-C level significantly associated with the risk of MetS, either without adjustment or with adjustment for the potential confounders. Not only the non-HDL-C concentration-dependent effect was observed (from 118 mg/dl to 247 mg/dl), but also two threshold effects were identified, which will help guide lipid control in preventing MetS. Specifically, the study showed that maintaining the non-HDL-C at a lower level is important in decreasing the risk of developing MetS.
Strengths of this study include the inclusion of a large sample analyzed, using multiple statistical methods with variable adjustment for comprehensive analysis of the relationship between the non-HDL-C and the risk of MetS. However, several limitations to our findings are worth noting. First, the participants in this study were recruited from the Caucasian population, as the MetS incidence is associated with the ethnic background; whether the results of our study could apply to individuals of other ethnicities requires further validation. Secondly, we adopted the NCEP-ATP III definition of MetS in this study; thus, the results we observed are only applicable to explain the relationship between the non-HDL-C and the MetS that defined by the NCEP-ATP III. Thirdly, this was a secondary analysis of a previous study, several potential confounders may need to further adjust, such as lower-lipid therapy, hypotension and hypoglycemic drug use; however, they were not available in the original data.Citation15
Conclusion
Our findings revealed that there is a non-linear association between the non-HDL-C with the risk of MetS. Higher non-HDL-C levels were associated with increased risk of MetS; however, two significant threshold saturation effects were observed (at 118 mg/dl and 247 mg/dl). This study suggested that individuals with serum non-HDL-C level between 118 and 247 mg/dl will significantly benefit from non-HDL-C control for reducing the risk of MetS.
Abbreviations
MetS, metabolic syndrome; SBP, systolic blood pressure; DBP, diastolic blood pressure; BF, body fat; ABSI, a body shape index; BMI, body mass index; WC, waist circumference; WHtR, waist-to-height ratio; TC, total cholesterol; HDL-C, high-density lipoprotein cholesterol; LDL-C, low-density lipoprotein cholesterol; FBG, fasting blood glucose; OR, odds ratio; CI, confidence interval.
Ethics Approval and Consent to Participate
This study was approved by the ethics committee of Jinhua Municipal Central Hospital (Jinhua, China). Informed consent was waived because all the participant information was anonymous.
Availability of Data and Materials
The data used in this study can be downloaded from the “DATADRYAD” database (www.Datadryad.org).Citation16
Author Contributions
All authors contributed to data analysis, drafting or revising the article, gave final approval of the version to be published, and agreed to be accountable for all aspects of the work.
Acknowledgements
We appreciate all the participants involved in the study and the data providers of the study.Citation15
Disclosure
The authors declare no conflicts of interest in this work.
Additional information
Funding
References
- Samson SL , Garber AJ . Metabolic syndrome. Endocrinol Metab Clin North Am . 2014;43:1–23. doi:10.1016/j.ecl.2013.09.009 24582089
- Sherling DH , Perumareddi P , Hennekens CH . Metabolic syndrome. J Cardiovasc Pharmacol Ther . 2017;22:365–367. doi:10.1177/1074248416686187 28587579
- Rochlani Y , Pothineni NV , Kovelamudi S , Mehta JL . Metabolic syndrome: pathophysiology, management, and modulation by natural compounds. Ther Adv Cardiovasc Dis . 2017;11:215–225. doi:10.1177/1753944717711379 28639538
- Beltran-Sanchez H , Harhay MO , Harhay MM , McElligott S . Prevalence and trends of metabolic syndrome in the adult US population, 1999–2010. J Am Coll Cardiol . 2013;62:697–703. doi:10.1016/j.jacc.2013.05.064 23810877
- Gu D , Reynolds K , Wu X , et al. Prevalence of the metabolic syndrome and overweight among adults in China. Lancet. 2005;365:1398–1405.15836888
- Matsuzawa Y , Funahashi T , Nakamura T . The concept of metabolic syndrome: contribution of visceral fat accumulation and its molecular mechanism. J Atheroscler Thromb . 2011;18:629–639. doi:10.5551/jat.7922 21737960
- Khan SH , Asif N , Ijaz A , Manzoor SM , Niazi NK , Fazal N . Status of non-HDL-cholesterol and LDL-cholesterol among subjects with and without metabolic syndrome. J Pak Med Assoc . 2018;68:554–558.29808044
- Barkas F , Elisaf M , Liberopoulos E , Liontos A , Rizos EC . High triglyceride levels alter the correlation of apolipoprotein B with low- and non-high-density lipoprotein cholesterol mostly in individuals with diabetes or metabolic syndrome. Atherosclerosis . 2016;247:58–63. doi:10.1016/j.atherosclerosis.2016.02.001 26868509
- Al-Hashmi K , Al-Zakwani I , Al Mahmeed W , et al. Non-high-density lipoprotein cholesterol target achievement in patients on lipid-lowering drugs and stratified by triglyceride levels in the Arabian Gulf. J Clin Lipidol . 2016;10:368–377. doi:10.1016/j.jacl.2015.12.021 27055968
- Xiao C , Dash S , Morgantini C , Hegele RA , Lewis GF . Pharmacological targeting of the AtherogenicDyslipidemia complex: the next frontier in CVD prevention beyond lowering LDL cholesterol. Diabetes . 2016;65:1767–1778. doi:10.2337/db16-0046 27329952
- Puri R , Nissen SE , Shao M , et al. Non-HDL cholesterol and triglycerides: implications for coronary atheroma progression and clinical events. Arterioscler Thromb Vasc Biol . 2016;36:2220–2228. doi:10.1161/ATVBAHA.116.307601 27515380
- Sniderman A , McQueen M , Contois J , Williams K , Furberg CD . Why is non-high-density lipoprotein cholesterol a better marker of the risk of vascular disease than low-density lipoprotein cholesterol? J Clin Lipidol . 2010;4:152–155. doi:10.1016/j.jacl.2010.03.005 21122647
- Verbeek R , Hovingh GK , Boekholdt SM . Non-high-density lipoprotein cholesterol: current status as cardiovascular marker. Curr Opin Lipidol . 2015;26:502–510. doi:10.1097/MOL.0000000000000237 26780004
- de Vries M , Klop B , Castro Cabezas M . The use of the non-fasting lipid profile for lipid-lowering therapy in clinical practice – point of view. Atherosclerosis . 2014;234:473–475. doi:10.1016/j.atherosclerosis.2014.03.024 24814412
- Romero-Saldaña M , Tauler P , Vaquero-Abellán M , et al. Validation of a non-invasive method for the early detection of metabolic syndrome: a diagnostic accuracy test in a working population. BMJ Open . 2018;8:e020476. doi:10.1136/bmjopen-2017-020476
- Romero-Saldaña M , Tauler P , Vaquero-Abellán M , et al. Data from: Validation of a non-invasive method for the early detection of metabolic syndrome: a diagnostic accuracy test in a working population, Dryad, Dataset 2018. doi: 10.5061/dryad.cb51t54
- Expert panel on detection, evaluation, and treatment of high blood cholesterol in adults. Executive summary of the third report of The National Cholesterol Education Program (NCEP) expert panel on detection, evaluation, and treatment of high blood cholesterol in adults (adult treatment panel III). JAMA . 2001;285:2486–2497. doi:10.1001/jama.285.19.2486 11368702
- Wang S , Zhang J , Lu X . Non-linear association of plasma level of high-density lipoprotein cholesterol with endobronchial biopsy bleeding in patients with lung cancer. Lipids Health Dis . 2019;18:17. doi:10.1186/s12944-019-0966-y 30658636
- Park S , Lee EH . Association between metabolic syndrome and age-related cataract. Int J Ophthalmol . 2015;8:804–811. doi:10.3980/j.issn.2222-3959.2015.04.29 26309883