
Abstract
Objective
Depression could make the treatment outcome worse. However, up to now, no objective methods were developed to diagnose depression in hepatitis B virus (HBV)-infected patients. Therefore, the dual metabolomic platforms were used here to identify potential biomarkers for diagnosing HBV-infected patients with depression (dHB).
Methods
Both gas chromatography-mass spectrometry-based and nuclear magnetic resonance-based metabolomic platforms were used to conduct urine metabolic profiling of dHB subjects and HBV-infected patients without depression (HB). Orthogonal partial least-squares discriminant analysis was used to identify the differential metabolites between dHB subjects and HB subjects, and the step-wise logistic regression analysis was used to identify potential biomarkers.
Results
In total, 21 important metabolites responsible for distinguishing dHB subjects from HB subjects were identified. Meanwhile, seven potential biomarkers (α-ydroxyisobutyric acid, hippuric acid, azelaic acid, isobutyric acid, malonic acid, levulinic acid, and phenylacetylglycine) were viewed as potential biomarkers. The simplified biomarker panel consisting of these seven metabolites had an excellent diagnostic performance in discriminating dHB subjects from HB subjects. Moreover, this panel could yield a higher accuracy in separating dHB subjects from HB subjects than our previous panels (identified by single metabolomic platform) did.
Conclusion
These results suggested that the dual metabolomic platforms could yield a better urinary biomarker panel for dHB subjects than any single metabolomic platform did, and our results could be helpful for developing an objective method in future to diagnose depression in HBV-infected patients.
Introduction
Hepatitis is viewed by Chinese experts as one of the 20 most important and most preventable health problems of China.Citation1 Hepatitis B virus (HBV), as the most common cause of hepatitis worldwide, accounts for at least 50% cases of hepatocellular carcinoma. Currently, although preventable with safe and effective vaccines, there is still about 3% of the global population chronically infected with HBV.Citation2 Currently, no available treatment modalities could completely eliminate HBV from human body. The long-term treatment and economic burden often cause patients to experience negative emotions, such as depressive symptoms. Moreover, HBV-infected patients are prone to suffer from low self-esteem, social isolation, hopelessness, and loneliness, thus increasing the risk of developing mental disorders.Citation3
Depression is a debilitating mental disorder accompanied by considerable costs, mortality, morbidity, and heightened risk of suicide. It is also viewed as one of the 20 most important and most preventable health problems of China.Citation1 This disease is prevalent in chronic HBV-infected patients, partly because it is one of the adverse effects of interferon given against HBV.Citation4 Previous studies reported that HBV-infected patients had significantly higher levels of depression compared to healthy controls.Citation5,Citation6 Depression could decrease the quality of life of HBV-infected patients. But one of the most serious consequences caused by depression is reducing patients’ compliance with prolonged therapeutic regimens.Citation7 However, depression is often overlooked in these patients.
In recent years, depression in HBV-infected patients has drawn more and more attention. However, the diagnosis of depression is inadequate as it is only based on subjective identification of symptom clusters rather than objective laboratory tests. This diagnostic modality could cause a considerable error rate. An approach to solve this problem is to identify disease biomarkers for objectively diagnosing depression. Recently, researchers have done many meaningful works to identify potential biomarkers for objectively diagnosing depression.Citation8–Citation11 Using metabolomic approaches, we successfully identified some potential urinary biomarkers to diagnose depression in HBV-infected patients.Citation12,Citation13 However, the common limitation of these studies is that only one metabolomic platform is used. Currently, three major metabolomic platforms are suited for non-targeted metabolomic mapping: nuclear magnetic resonance (NMR) spectroscopy, gas chromatography (GC)-, and liquid chromatography (LC)-mass spectroscopy (MS). Each one has its advantages and disadvantages. But, none of these metabolomic platforms could provide adequate coverage of the entire human metabonome in a given sample.Citation14 Previous studies have reported that the combined use of several metabolomic platforms could substantially enhance the level of metabolome coverage.Citation15,Citation16 Our previous study found that the combined application of GC-MS- and NMR-based metabolomic platforms could yield a superior biomarker panel for diagnosing bipolar disorder.Citation17 Therefore, in this study, the dual platform approach (NMR spectroscopy and GC-MS) was used to identify a novel urinary metabolite signature for diagnosing depression in HBV-infected patients.
Materials and Methods
Patient Recruitment
Ethical Committee of Chongqing Medical University approved the protocols of this study. HBV-infected patients with depression (dHB) were recruited if they met the following criteria: i) using Hamilton Depression Rating Scale (HDRS) to assess depression severity, and the HDRS score was no less than 17; ii) receiving no antidepressant medications; iii) not co-infected with other hepatitis virus or human immunodeficiency virus (HIV); iv) on pre-existing physical or other neuropsychiatric disorders, no alcohol consumption, or illicit drug use; and v) aged 18 and older. The HBV-infected patients without depression (HB) met the following criteria were recruited into this study: i) not co-infected with other hepatitis virus or HIV; ii) on pre-existing physical or neuropsychiatric disorders; iii) no alcohol consumption or illicit drug use; and iv) aged 18 and older. Finally, 81 dHB subjects and 68 HB subjects extracted from our previous studies were included in this study.Citation12,Citation13 All patients provided written informed consent, and that this study was conducted in accordance with the Declaration of Helsinki. The detailed information was described in .
Table 1 Demographic and Clinical Characteristics of the Included Patients
Metabolites Acquisition
After overnight fasting, the included patients were told to collect the morning urine samples using a sterile cup. The midstream urine was demanded. The collected urine samples were transferred into a sterile tube and then immediately delivered to the laboratory under low temperature. All urine samples were centrifuged at 1500g for 10 min. The obtained supernatant was then divided into equal aliquots. At last, the samples were stored at −80°C until later analysis. In this study, the procedure of urinary metabolites acquisition using GC-MS and NMR spectroscopy was exactly conducted according to our previous studies.Citation10,Citation12,Citation13
Data Analysis
As the contents of metabolites in different urine samples might vary largely, we used the creatinine to normalize the contents of metabolites in different urine samples to control the variation of urine samples. Then, the data would be further scaled to zero mean and unit variance before analyzing. The included patients were randomly assigned to the training set and testing set. Firstly, we used the training set to build orthogonal partial least-squares discriminant analysis (OPLS-DA) model, which was used to show the divergent urinary metabolic phenotypes between dHB and HB. The 399-iteration permutation test was used to assess whether the built model was over-fit or not. Meanwhile, the testing set was further used to validate the built model.
We used the coefficient loading plot of the built OPLS-DA model to find the important metabolites responsible for separating dHB subjects from HB subjects. The correlation coefficient of |r|>0.258 (equivalent to a p-value of less than 0.05) was chosen as the cut-off value according to the number of samples in the training set. The online software MetaboAnalyst was used to identify the biological functions of these identified important metabolites. Meanwhile, the nonparametric Mann–Whitney U-test and Benjamini and Hochberg False Discovery Rate were used to validate the metabolic changes identified by OPLS-DA model. As a small number of urinary metabolites would be more convenient and feasible to diagnose depression, we used the step-wise logistic-regression analysis based on Akaike’s information criterion (AIC) rule to optimize the identified important metabolites.
In order to assess the diagnostic performance of the obtained simplified metabolite biomarker panel in diagnosing depression in HBV patients, we performed the receiver-operating characteristic (ROC) curve analysis. The area under the curve (AUC) in both training set and testing set was viewed as an index to quantify the ability of this panel in discriminating dHB subjects from HB subjects. Diagnostic accuracy was categorized as good (0.8<AUC<0.9) and excellent (0.9<AUC≤1.0).Citation18 The SIMCA-P 14.0 (Umetrics, Umeå, Sweden) and SPSS 19.0 were used to conduct data analysis. The Student’s t-test and Chi-square test were performed to analyze the baseline data. The p-value<0.05 was considered to be statistically significant.
Results
Divergent Metabolic Phenotypes
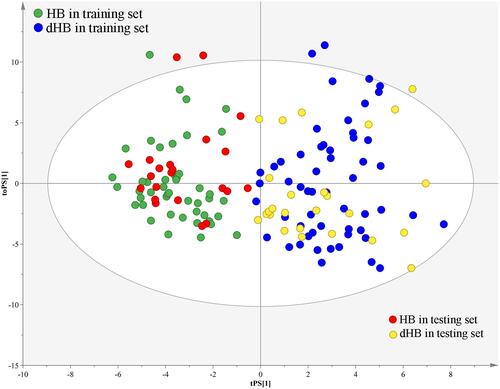
Firstly, we used the training set to build the OPLS-DA model. The results showed that the dHB subjects could be obviously separated from HB subjects with no overlap (). The values of two parameters (R2Y cum= 0.83, Q2 = 0.68) were also positive. Meanwhile, the results of 399-iteration permutation test indicated that the built OPLS-DA model was not over-fitted, as all R2- and Q2-values to the left were lower than the original points to the right (). To independently assess the validity of the built OPLS-DA model, the model was used to predict the samples in the testing set. The T-predicted scatter plot showed that all samples were correctly predicted (). These results demonstrated that there were divergent metabolic phenotypes between dHB subjects and HB subjects, and the built model held promise as an objective diagnostic method for depression in HBV-infected patients.
Figure 1 Metabolomic analysis of urine samples: (A) OPLS-DA model showed a clear discrimination between dHB (blue dot) and HB (green dot) in the training set; (B) permutation test showed all R2- and Q2-values to the left were lower than the original points to the right, demonstrating the OPLS-DA model’s robustness.
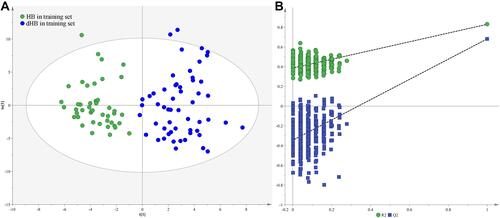
Figure 2 T-predicted scatter plot of OPLS-DA model. The model built with dHB (blue dot) and HB (green dot) in the training set could correctly predict dHB (yellow dot) and HB (red dot) in the testing set.
Important Urinary Metabolites
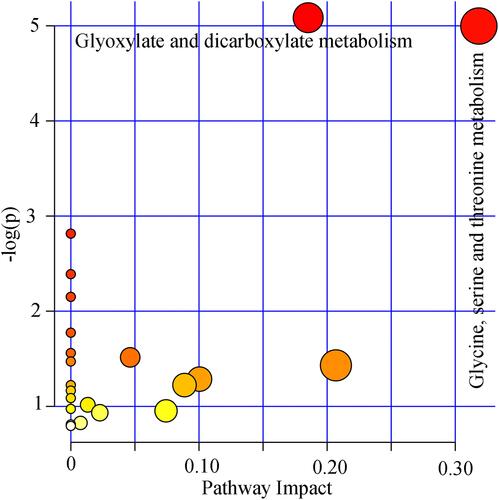
By analyzing the coefficient loading plots of the built model, we found that there were 21 important metabolites responsible for distinguishing dHB subjects from HB subjects. Compared to HB subjects, dHB subjects were characterized by higher levels of α-hydroxyisobutyric acid, pyruvic acid, acetone, glycine, acetamide, β-aminoisobutyric acid, glycolic acid, hippuric acid, azelaic acid, dimethylglycine, β-hydroxybutyric acid, isobutyric acid, D-threitol, levulinic acid, along with lower levels of 2,4-dihydroxypyrimidine, malonic acid, phenylacetylglycine, ethanolamine, methylmalonic acid, hydroxylamine, p-hydroxyphenylacetic acid. The functional analysis found that glyoxylate and dicarboxylate metabolism (p=0.006, impact=0.19) and glycine, serine, and threonine metabolism (p=0.006, impact=0.32) were significantly affected ().
Figure 3 Pathway analysis using the important metabolites. The pathways with p<0.05 and impact value>0 were viewed as the significantly affected pathways.
Simplified Biomarker Panel
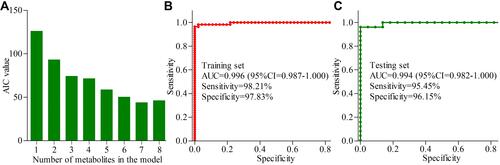
We used the step-wise logistic-regression analysis based on AIC rule to further analyze the 21 important urinary metabolites. The results showed that the AIC value was minimal when there were seven important urinary metabolites in the logistic-regression model (). The seven important urinary metabolites were α-hydroxyisobutyric acid, hippuric acid, azelaic acid, isobutyric acid, malonic acid, levulinic acid, and phenylacetylglycine. Among these identified biomarkers, there were two metabolites (azelaic acid and levulinic acid) from GC-MS platform and other five metabolites from NMR platform. The panel consisting of these seven important urinary metabolites could correctly separate dHB subjects and HB subjects with accuracies of 98.0% in the training set and 95.8% in the testing set. These results indicated that the most significant deviations between dHB subjects and HB subjects could be described by these seven important urinary metabolites.
Figure 4 Simplified biomarker panel identification and validation: (A) the bar represents the value of AIC in each model, and the AIC value was minimal when there were seven important urinary metabolites in the logistic-regression model; (B) AUC value in the training set; (C) AUC value in the testing set.
Diagnostic Performance
The probability of depression in HBV-infected patients could be calculated using the identified simplified biomarker panel: P(Y=1) = 1/(1+e-y); y= −47.837*α-hydroxyisobutyric acid+ 2.416* phenylacetylglycine-4.283*hippuric acid-7.665* isobutyric acid + 3.286* malonic acid – 1542.158* azelaic acid – 484.869* levulinic acid+24.759. Then, we performed ROC analysis to build a curve using the obtained probabilities. The results showed that the identified simplified biomarker panel could yield an AUC of 0.996 (95% CI=0.987–1.000) () in the training set. Moreover, it could effectively separate the blinded samples in the testing set with an AUC of 0.994 (95% CI=0.982–1.000) (). These results demonstrated that this simplified biomarker panel had an excellent diagnostic performance in discriminating dHB subjects from HB subjects.
Discussion
In this work, we used a dual platform approach (NMR spectroscopy and GC-MS) to further study the divergent urinary metabolic phenotypes between dHB subjects and HB subjects. Finally, we identified 21 important urinary metabolites responsible for distinguishing dHB subjects from HB subjects. Pathway analysis found the significantly affected glyoxylate and dicarboxylate metabolism and glycine, serine, and threonine metabolism. A simplified biomarker panel consisting of α-hydroxyisobutyric acid, hippuric acid, azelaic acid, isobutyric acid, malonic acid, levulinic acid, and phenylacetylglycine was identified. This panel had an excellent diagnostic performance in discriminating dHB subjects from HB subjects. Moreover, compared to the potential panels identified by single metabolomic platform,Citation12,Citation13 this panel had a higher accuracy in diagnosing depression in HBV-infected patients. These results demonstrated that the complementary nature of NMR spectroscopy and GC-MS could provide a better and more specific panel in diagnosing dHB subjects than any single technique in isolation.
Previous study reported that the multivariate analysis was superior to univariate analysis in finding the potential significance of subtle metabolic differences between different groups.Citation19 In our previous metabolic studies, some metabolites were not found to be significantly changed by univariate analysis, but still identified as differential metabolites by multivariate analysis.Citation13,Citation20 In this study, the significantly changed levels of 2,4-dihydroxypyrimidine, malonic acid, methylmalonic acid, ethanolamine, phenylacetylglycine, and hydroxylamine were not validated by univariate analysis. However, the built OPLS-DA model still viewed these metabolites as differential metabolites. This was because the addition of these metabolites into the OPLS-DA model could significantly improve its discrimination power.
Depression is a complex disease and its pathogenesis is still not very clear.Citation21–Citation23 Our previous study found that the disturbance of gut microbiota might be a contributory factor to the development of depression.Citation24–Citation26 Meanwhile, we found that some differential metabolites in depressed subjects, such as usobutyric acid, phenylacetylglycine, p-hydroxyphenylacetic acid, hippuric acid, and dimethylglycine, were the metabolic byproducts of gut microbiota.Citation27 Interestingly, these metabolites were also identified as important metabolites in the present study for diagnosing depression in HBV-infected patients. Moreover, previous studies have reported that there was a close relationship between HBV-induced chronic liver disease and gut microbiota.Citation28,Citation29 Therefore, future studies were needed to further find out the relationship between gut microbiota and our identified important metabolites, which might be helpful for elucidating the pathogenesis of depression in HBV-infected patients.
Limitations of this study should be mentioned here. Firstly, the number of dHB subjects or HB subjects was relatively small; Large-scale studies were needed to confirm our findings. Secondly, we did not assess the fibrosis stage in the recruited patients; it might be interesting to study whether our findings were appropriate for HBV-infected patients with different stages of liver fibrosis. Thirdly, only urine sample was used here; future studies should collect other biosamples, such as plasma, to further investigate to ensure that the biomarkers identified in this study were relevant to the pathogenesis of depression in HBV-infected patients.
In conclusion, using a dual platform metabonomic approach, we identified 21 important urinary metabolites responsible for distinguishing dHB subjects from HB subjects and obtained a simplified biomarker panel consisting of 7 metabolites. This panel could differentiate dHB subjects from HB subjects with a higher accuracy than our previous panels did. These results suggested that the complementary nature of NMR spectroscopy and GC-MS could identify a more comprehensive metabolite panel than any single technique in isolation.
Acknowledgments
This work was supported by the Natural Science Foundation Project of China (81701360, 81601207, 81701477), the Chongqing Science & Technology Commission (cstc2017jcyjAX0377), the Chongqing Yuzhong District Science & Technology Commission (20190115), and supported by the fund from the Joint International Research Laboratory of Reproduction & Development, Institute of Life Sciences, Chongqing Medical University, Chongqing, China, Yongchuan Hospital Foundation of Chongqing Medical University (YJYJ201501, YJJC201911) and also supported by the Scientific Research and Innovation Experiment Project of Chongqing Medical University (CXSY201862, CXSY201863). Liang Fang and Jian-jun Chen are co-senior authors for this study.
Disclosure
The authors declare no financial or other conflicts of interest in this work.
References
- Wu Y, Jin A, Xie G, et al. The 20 most important and most preventable health problems of China: a Delphi Consultation of Chinese Experts. Am J Public Health. 2018;108(12):1592–1598. doi:10.2105/AJPH.2018.304684
- Yuen MF, Chen DS, Dusheiko GM, et al. Hepatitis B virus infection. Nat Rev Dis Primers. 2018;4:18035. doi:10.1038/nrdp.2018.35
- Mirabdolhagh Hazaveh M, Dormohammadi Toosi T, Nasiri Toosi M, Tavakoli A, Shahbazi F. Prevalence and severity of depression in chronic viral hepatitis in Iran. Gastroenterol Rep (Oxf). 2015;3(3):234–237. doi:10.1093/gastro/gou091
- Keskin G, Gümüs AB, Orgun F. Quality of life, depression, and anxiety among hepatitis B patients. Gastroenterol Nurs. 2013;36(5):346–356. doi:10.1097/SGA.0b013e3182a788cc
- Duan Z, Kong Y, Zhang J, Guo H. Psychological comorbidities in Chinese patients with acute-on-chronic liver failure. Gen Hosp Psychiatry. 2012;34(3):276–281. doi:10.1016/j.genhosppsych.2011.11.012
- Huang X, Zhang H, Qu C, Liu Y, Bian C, Xu Y. Depression and insomnia are closely associated with thyroid hormone levels in chronic hepatitis B. Med Sci Monit. 2019;25:2672–2678. doi:10.12659/MSM.914444
- Chen JW, Xie SQ. Agomelatine versus paroxetine in treating depressive and anxiety symptoms in patients with chronic kidney disease. Neuropsychiatr Dis Treat. 2018;14:547–552. doi:10.2147/NDT.S159636
- Chen JJ, Xie J, Zeng L, Zhou CJ, Zheng P, Xie P. Urinary metabolite signature in bipolar disorder patients during depressive episode. Aging (Albany NY). 2019;11(3):1008–1018. doi:10.18632/aging.101805
- Lai CH. Promising neuroimaging biomarkers in depression. Psychiatry Investig. 2019;16(9):662–670. doi:10.30773/pi.2019.07.25.2
- Carboni L, McCarthy DJ, Delafont B, et al. Biomarkers for response in major depression: comparing paroxetine and venlafaxine from two randomised placebo-controlled clinical studies. Transl Psychiatry. 2019;9(1):182. doi:10.1038/s41398-019-0521-7
- Pan JX, Xia JJ, Deng FL, et al. Diagnosis of major depressive disorder based on changes in multiple plasma neurotransmitters: a targeted metabolomics study. Transl Psychiatry. 2018;8(1):130. doi:10.1038/s41398-018-0183-x
- Hou LJ, Wang HW, Wei XX, et al. Urinary metabonomics for diagnosis of depression in hepatitis B virus-infected patients. Iran Red Crescent Med J. 2015;17(4):e27359. doi:10.5812/ircmj.17(4)2015.27359
- Hou L, Wei X, Zhuo Y, et al. GC-MS-based metabolomics approach to diagnose depression in hepatitis B virus-infected patients with middle or old age. Aging (Albany NY). 2018;10(9):2252–2265. doi:10.18632/aging.101535
- Williams R, Lenz EM, Wilson AJ, et al. A multi-analytical platform approach to the metabonomic analysis of plasma from normal and Zucker (fa/fa) obese rats. Mol Biosyst. 2006;2(3–4):174–183. doi:10.1039/b516356k
- Chen J, Bai S-J, Li W, et al. Urinary biomarker panel for diagnosing patients with depression and anxiety disorders. Transl Psychiatry. 2018;8(1):192. doi:10.1038/s41398-018-0245-0
- Bouatra S, Aziat F, Mandal R, et al. The human urine metabolome. PLoS One. 2013;8(9):e73076. doi:10.1371/journal.pone.0073076
- Chen J, Liu Z, Fan S, et al. Combined application of NMR-and GC-MS-based metabonomics yields a superior urinary biomarker panel for bipolar disorder. Sci Rep. 2014;4:5855. doi:10.1038/srep05855
- Tao R, Huang X, Wang J, Zhang H, Zhang Y, Li M. Proposed diagnostic criteria for internet addiction. Addiction. 2010;105(3):556–564. doi:10.1111/j.1360-0443.2009.02828.x
- MacIntyre DA, Jimenez B, Lewintre EJ, et al. Serum metabolome analysis by 1 H-NMR reveals differences between chronic lymphocytic leukaemia molecular subgroups. Leukemia. 2010;24(4):788–797. doi:10.1038/leu.2009.295
- Chen JJ, Xie J, Li WW, et al. Age-specific urinary metabolite signatures and functions in patients with major depressive disorder. Aging (Albany NY). 2019;11(17):6626–6637. doi:10.18632/aging.102133
- Ménard C, Hodes GE, Russo SJ. Pathogenesis of depression: insights from human and rodent studies. Neuroscience. 2016;321:138–162. doi:10.1016/j.neuroscience.2015.05.053
- Chen JJ, Xie J, Zeng BH, et al. Absence of gut microbiota affects lipid metabolism in the prefrontal cortex of mice. Neurol Res. 2019;41(12):1104–1112. doi:10.1080/01616412.2019.1675021
- Wu Y, Zhu B, Chen Z, et al. Prevalence and predisposing factors of depressive symptoms in patients with stable coronary artery disease: a cross-sectional single-center study. Aging (Albany NY). 2019;11(12):3958–3968. doi:10.18632/aging.102026
- Chen JJ, He S, Fang L, et al. Age-specific differential changes on gut microbiota composition in patients with major depressive disorder. Aging (Albany NY). 2020;12(3):2764–2776. doi:10.18632/aging.102775
- Zheng P, Zeng B, Zhou C, et al. Gut microbiome remodeling induces depressive-like behaviors through a pathway mediated by the host’s metabolism. Mol Psychiatry. 2016;21(6):786–796. doi:10.1038/mp.2016.44
- Chen JJ, Zheng P, Liu YY, et al. Sex differences in gut microbiota in patients with major depressive disorder. Neuropsychiatr Dis Treat. 2018;14:647–655. doi:10.2147/NDT.S159322
- Zheng P, Wang Y, Chen L, et al. Identification and validation of urinary metabolite biomarkers for major depressive disorder. Mol Cell Proteomics. 2013;12(1):207–214. doi:10.1074/mcp.M112.021816
- Kang Y, Cai Y. Gut microbiota and hepatitis-B-virus-induced chronic liver disease: implications for faecal microbiota transplantation therapy. J Hosp Infect. 2017;96(4):342–348. doi:10.1016/j.jhin.2017.04.007
- Wang J, Wang Y, Zhang X, et al. Gut microbial dysbiosis is associated with altered hepatic functions and serum metabolites in chronic hepatitis B patients. Front Microbiol. 2017;8:2222. doi:10.3389/fmicb.2017.02222