
 ?Mathematical formulae have been encoded as MathML and are displayed in this HTML version using MathJax in order to improve their display. Uncheck the box to turn MathJax off. This feature requires Javascript. Click on a formula to zoom.
Abstract
Purpose
Classification of medical data is essential to determine diabetic treatment options; therefore, the objective of the study was to develop a model to classify the three diabetes type diagnoses according to multiple patient attributes.
Methods
Three different datasets are used to develop a novel medical data classification model. The proposed model involved preprocessing, artificial flora algorithm (AFA)-based feature selection, and gradient boosted tree (GBT)-based classification. Then, the processing occurred in two steps, namely, format conversion and data transformation. AFA was applied for selecting features, such as demographics, vital signs, laboratory tests, medications, from the patients’ electronic health records. Lastly, the GBT-based classification model was applied for classifying the patients’ cases to type I, type II, or gestational diabetes mellitus.
Results
The effectiveness of the proposed AFA-GBT model was validated using three diabetes datasets to classify patient cases into one of the three different types of diabetes. The proposed model showed a maximum average precision of 91.64%, a recall of 97.46%, an accuracy of 99.93%, an F-score of 94.19%, and a kappa of 96.61%.
Conclusion
The AFA-GBT model could classify patient diagnoses into the three diabetes types efficiently.
Introduction
According to the World Health Organization, the number of diabetic patients rose from 108 million in 1980 to 420 million in 2014.Citation1 A survey conducted in 2011 reported that the number of senior citizens with diabetes across India in 2050 is projected to be approximately 33.3 million.Citation2 However, a recent study conducted in 2020 revealed that nearly 77 million people in India are affected by diabetes.Citation3 More than 2 million deaths are attributed to cardiovascular diseases and other ailments, which form the risk factors of diabetes mellitus. Diabetes mellitus can be classified into three main types, namely type 1 diabetes mellitus,Citation4 type 2 diabetes mellitus,Citation5 and gestational diabetes mellitus (GDM).Citation6 The complications of type 1 diabetes mellitus depend on the degree and length of exposure to hyperglycemic conditions.Citation7 DanemanCitation8 reported a relationship between type 1 diabetes mellitus and the progression of microvascular (retinopathy, nephropathy, and neuropathy), and most likely, macrovascular (cardiovascular, cerebrovascular, and peripheral vascular diseases), diseases into long-term complications. Furthermore, cardiovascular diseases account for 70% of the deaths in type 2 diabetes mellitus.Citation7 The most common complications of type 2 diabetes mellitus are heart diseases, stroke, nephropathy, retinopathy, and neuropathy.Citation9 GDM occurs in only 3–5% of all pregnancies.Citation10 However, it involves a high risk of subsequent maternal type 2 diabetes.Citation11 Fetal complications can occur, including fetal wastage from early pregnancy, congenital anomalies, macrosomia, shoulder dystocia, stillbirth, growth restriction, and hypoglycemia.Citation12
Recently, computational or machine intelligence in medical analyses has become greatly familiarized with medical data domains. Several diagnostic models for application in the medical field have been programmed into smart data classification methods.Citation13,Citation14 In computer-aided decision models, information technology is applied to help physicians diagnose diseases in individuals. When compared with the other tasks performed using the computer-aided decision system, classification is a general task, which involves allocation of a label to a query case based on the selected number of features. Hence, precise medical data classification could be an issue in achieving an accurate diagnosis. In general, patients or doctors do not obtain complete data on the cause of a disease, and the causal factor is identified by the disease symptoms, which are assumed to be more significantly associated with medical dataset classification problems. Therefore, it is crucial to learn the decision which maps the input features to the output class labels in a precise manner.Citation15
Superfluous features available in electronic health records make the computations difficult. Thus, reducing the tradeoff between computational complexity and accuracy of any process being implemented with such superfluous features becomes challenging. Hence, selection of particular features remains an active research problem. In the dataset used in the present work on diabetes diagnostic classification, there are 79 features; of these, many features, including body mass index, age, height, and weight, are redundant. Therefore, identifying the finest features that provide higher degree of competence in the subsequent operations is necessary. A vast review of the available feature selection techniques was conducted and a comparative analysis of these available methods and their limitations are summarized in . To overcome the limitations and disadvantages of the prevailing algorithms, it is necessary to develop a suitable feature selection algorithm for better selection of classifiers. Many researchers have employed models to enhance the accuracy of medical data classification.Citation19–Citation21 The classification accuracy should be optimal when compared with the other methods, and sufficient data have been used in classifying patients, resulting in enhanced diagnostic accuracy. At present, metaheuristic models,Citation22 such as simulated annealing, genetic algorithms, particle swarm optimization, and data mining methods, including Bayesian networks, artificial neural network, fuzzy logic, and decision trees, are utilized to classify medical data with outstanding performances. Alternatively, based on the migration and reproduction of flora, the artificial flora algorithm (AFA) has been derived for solving complex, nonlinear, and discrete optimization problems. Though plants cannot move, they can distribute seeds to a particular extent to let their offspring determine the appropriate surroundings. The stochastic process is easy to reproduce, and the area of spread is vast; therefore, AFA is suitable for application in intelligent optimization algorithms. Here, we employed AFA as the feature selection technique. Several models have been developed for diabetes diagnosis;Citation23 however, none of them are able to classify patient diagnoses into the different types of diabetes mellitus (type 1, type 2, and GDM). In this work, a new diagnostic model for diabetes mellitus was developed using artificial intelligence techniques. We adopted the AFA-based feature selection with gradient boosted tree (GBT)-based data classification model (AFA-GBT model) for classifying patient diagnoses into the different types of diabetes mellitus. The proposed model involved preprocessing, AFA-based feature selection (AFA-FS), and GBT-based classification. Initially, processing was conducted in two steps, namely format conversion and data transformation. Next, AFA was applied for selecting features from the patients’ electronic health records. Finally, the GBT-based classification model was applied for determining the three diabetes mellitus types. The GBT classifier was used because it is a hypothesis-based classification algorithm, which works for any differentiable misfortune function. It frequently provides prescient scores that are better than those provided by other different classification algorithms. Moreover, the GBT-based model can deal with missing or outlier data (imputation not required).
Table 1 Comparative Analysis of Available Feature Selection Methods
Related Works
Singh et alCitation24 utilized patients’ details to predict the occurrence of diabetes mellitus using naive Bayes, multilayer perceptron (MLP), and decision tree-based random forest model. Preprocessing was performed with correlation-based feature selection to discard unwanted features. Finally, the predictive model determined the existence of diabetes in patients. The classification performance was enhanced, compared with that of other models, by using the naive Bayes classifier. Furthermore, the model’s accuracy was evaluated in the presence or absence of the preprocessing step. The random forest model shows 100% accuracy using a training dataset (UTD), irrespective of the presence of the preprocessing step. Azrar et alCitation25 comparatively studied diverse data mining models, such as k-nearest neighbor, decision tree, and naïve Bayes, using pavement image dataset to predict the existence of diabetes in patients at the earlier stages. The decision tree model is found to be superior over the others with an accuracy of 75.65%.
Alirezaei et alCitation26 proposed a method based on the k-means clustering to identify and eliminate outliers. The k-means clustering method was applied to select the least number of significant features using support vector machines. Finally, the model was validated using the 10-fold cross-validation method. The classification accuracies for the multi-objective firefly algorithm and multi-objective imperialist competitive algorithm are 100% each, while they are 98.2% and 94.6% for the non-dominated sorting genetic algorithm and multi-objective particle swarm optimization, respectively.
JarullahCitation27 introduced a decision tree model to prognosticate diabetes. The model contains two stages: information processing and forecast. Significant features were selected and missing attributes were managed in the latter stage. The model was used for diagnosing the potential stages of diabetes depending on the syndrome, providing an accuracy of 78%. Sapna et alCitation28 proposed a genetic algorithm-based fuzzy model to forecast the existence of diabetes illness. A fuzzy model was utilized for learning, having self-adjusting capacity. It was utilized in combination with a genetic algorithm to shorten the diabetes feature set; and the model provided an accuracy of 83%.
Aishwarya et alCitation29 proposed a combination of acute learning and genetic algorithm for diagnosing diabetes in the Pima Indians Diabetes Database. The genetic algorithm was utilized as a feature selection tool, while machine learning was applied for the classification; 10-fold cross-validation was performed for evaluating various performance metrics. This model has provided an accuracy of 89.54%.
Polat et alCitation30 proposed the least squares support vector machine and generalized discriminant analysis for diabetes prediction. Generalized discriminant analysis was utilized to classify patients into robust or influential diabetic categories. Least squares support vector machine was utilized to productively characterize the diabetes dataset. The proposed model provides an accuracy of 82.5% with 10-fold cross-validation.
Ren et alCitation31 proposed an adaptive cross-validation strategy that helped attain better prediction of a target function than that with other methods. It uses particle swarm optimization, genetic algorithm and support vector machines. A target function based on cross-validation was enhanced by both the methods. Genetic algorithm was utilized to streamline the features of the support vector machine. It was noted that the particle swarm optimization support vector machine model effectively tunes the support vector machine features. Moreover, this model has been effectively applied to a diabetes dataset to classify patients depending on the applicable syndrome.
Ali et alCitation32 introduced a boosting troupe classification model, which is used to diagnose diabetes based on the patients’ personal medical history. A random panel classifier was used in this model. The model generated 100 records of real-time diabetes data and produced an accuracy of 81% with 10-fold cross-validation.
Aslam et alCitation33 developed a genetic programming-based strategy for diabetes diagnosis. This proposed strategy comprises three phases. In the first phase, feature selection occurred. To identify the unique features, the important features were set up in the decreasing order. In the second phase, feature generation was performed. During this phase, new features were generated from every subset of unique diabetes feature by making non-direct mixes of the first features. In the last phase, testing was performed. During this phase, genetic programming produced features for classification and utilized the k-nearest neighbors and support vector machine classifiers. They utilized Pima Indians Diabetes Database for executing the proposed strategy. The outcomes and correlations with different techniques showed that the proposed strategy displays better performance than others.
Li et alCitation34 introduced a novel model to predict blood glucose levels using GluNet model. The model was built based on the probabilistic distribution of short-term (30–60 min) future continuous glucose monitoring measurements for subjects with type 1 diabetes mellitus according to their historical data. The prediction process consisted of four components: data preprocessing, label transformation/recovery, multiple layers of dilated convolutional neural network, and postprocessing. The results showed significant improvement compared with the existing methods through a comprehensive virtual comparison in terms of the root mean square error (8.88 ± 0.77 mg/dL) with a short-time lag (0.83 ± 0.40 min) for the prediction horizon of 30 min, and the root mean square error (19.90 ± 3.17 mg/dL) with a time lag (16.43 ± 4.07 min) for the prediction horizon of 60 min in adult subjects.
Materials and Methods
Data Collection
We used the type 1 diabetes mellitus,Citation35 type 2 diabetes mellitus,Citation36 and GDMCitation37 datasets, which were obtained from previously published literatureCitation38–Citation48 for training, testing, and validation. More details about the data are shown in .
Table 2 Description of the Datasets Used in the Work
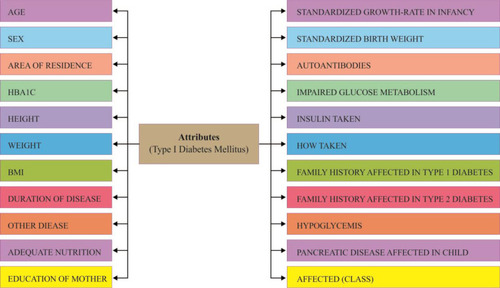
Data of type 1 diabetes mellitus were collected from different hospitals and diagnostic centers in Dhaka, Bangladesh. Data collection was performed by following a questionnaire. Data of both case (affected) and control (unaffected) groups were collected for both males and females. The total sample size was 306, where 152 were affected (case) and 154 unaffected (control). In total, 22 factors illustrated in were considered for collection of fruitful data. This information utilized by different research in Type-1 Diabetes.Citation38–Citation40 This information presented new methodology of hazard factor forecast and discovering the importance level among factors like subcomponents. Investigated Dataset of both Data Mining and Statistical methodology delineates the correlation impact and reasonable result of the exploration.
Figure 1 List of attributes in the type 1 diabetes mellitus dataset.
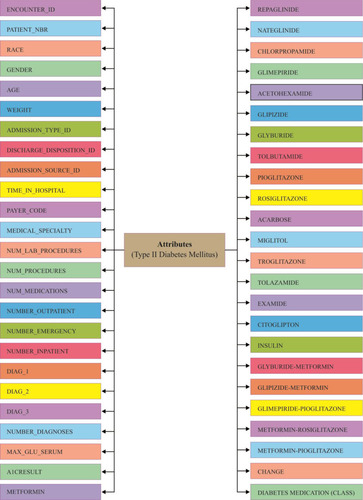
Data of type 2 diabetes mellitus were collected from UCI Machine Learning Repository. The dataset represents a 10-year (1999–2008) record of clinical care at 130 US hospitals and integrated delivery networks. It includes over 49 features representing patient and hospital outcomes (). Number of researchersCitation41–Citation44 used this data set to scrutinize factors identified with readmission just as different results relating to the patients with diabetes. Data were extracted from the database for encounters that satisfied the following criteria.
It is an inpatient encounter (a clinic confirmation).
It is a diabetic encounter, that is, one during which any sort of diabetes was entered to the framework as a finding.
The length of stay was slightly 1 day and at most 14 days.
Laboratory tests were performed during the encounter.
Medications were controlled during the encounter.
Figure 2 List of attributes in the type 2 diabetes mellitus dataset.
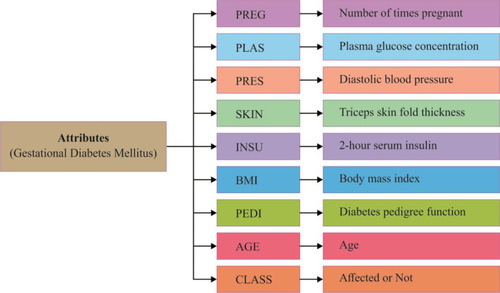
Data of GDM were collected from the Pima Indians Diabetes Database. This dataset originally belonged to the National Institute of Diabetes and Digestive and Kidney Diseases. The various researchCitation45–Citation48 was done by using this dataset to diagnose whether a patient is diabetic or not. All its features are shown in .
Figure 3 List of attributes in the gestational diabetes mellitus dataset.
For experimentation, a 10-fold cross-validation method was used. The number of folds K is fixed as the hyper parameter, initialized as 3. In iterative basis, the value of K is increased and the corresponding validation accuracies are visualized. It is found that the accuracy stabilized over K=8 and convergence from K=10, prevailed till K=15. Hence, the parameter is fitted as K = 10.
The AFA-GBT Model
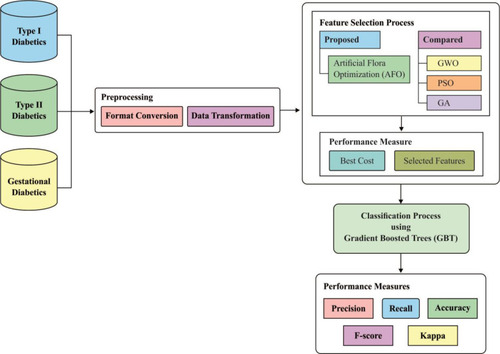
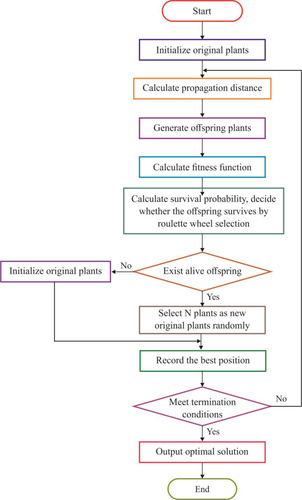
illustrates the processes occurring in the AFA-GBT model; detailed descriptions of the different phases are provided in the following subsections.
Figure 4 Block diagram of the artificial flora algorithm (AFA)-based feature selection with gradient boosted tree (GBT)-based data classification (AFA-GBT) model. GWO, grey wolf optimization; PSO, particle swarm optimization GA, genetic algorithm.
Preprocessing
Preprocessing occurred in two stages: format conversion and data transformation. In the format conversion process, we converted the data in Excel sheets under the binary file format “xls” into the plain text format “csv.” Next, we converted the categorical values into numerical values in the data transformation process using the following steps:
Initially, each column finds whether categorical variables are available or not.
If categorical variables are available then we can convert the categorical variable column into a list.
Then, we can encode the categorical variable with its index.
Once the patient medical data were preprocessed, the feature subset selection was initiated using the AFA-FS model. If any misplaced feature occurred during the preprocessing stage, we replaced the missing value with the median of all values in the electronic health records in the training set. The details of missing values and categorical variables are described in .
Table 3 Details of Missing Values and Categorical Variables in the Dataset
Conceptual Overview of AFA
Generally, plants can distribute its seeds in several ways. Majorly, the seed dispersal process takes place in two ways: autochory and allochory. The basic migration and reproduction tasks involved in the anticipated AFA, as described previously,Citation49 is shown in .
Figure 5 Basic migration and reproduction processes in the artificial flora algorithm.
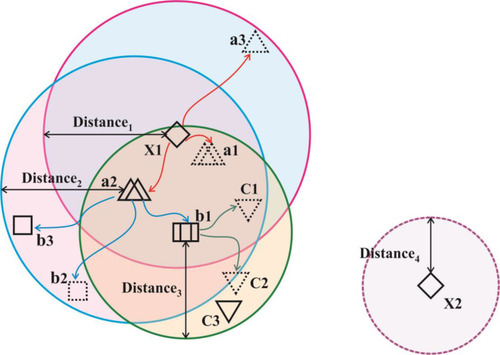
The AFA includes a set of four primary components, namely the original plant, offspring plant, plant locality, and propagation distance (PD). The original plant is the plant that is prepared to disperse seeds. The offspring plant is the seed of the original plant, and this plant could not perform seed dispersal at that time. The plant locality indicated the actual location of a plant. PD indicated the maximum distance of seed dispersal. Generally, a set of three main behavioral patterns exist, namely evolutionary, spreading, and selective behaviors. The evolutionary behavior indicated that there was a possibility of the plants evolving by adapting to the environmental conditions. The spreading behavior indicated seed dispersal either via autochory or allochory. The selective behavior indicated that the flora might survive or become extinct because of the environmental conditions. The processes involved in AFA are shown in .
Figure 6 Flowchart presenting the steps of the artificial flora algorithm.
AFA-FS Model
Every solution would be assessed based on the proposed fitness function (FF), which in turn was based on a set of two objectives: the maximum classifier accuracy achieved through the GBT-based classification model and number of selected features in the solution. The algorithm began with a collection of arbitrarily created solutions (subsets) known as the population. Every solution was then validated using the presented FF. The major loop of the AFA-FS model was repeated for a number of times. In each round, the solutions updated the localities and PD to one another. Then, the survival probability was determined to choose an optimal subset of features from the available solutions. This process was iterated until the termination criteria were satisfied. The proposed AFA-FS model involves a series of different steps as discussed below.
Agent Representation
In AFA-FS, each feature subset could be observed as the locality of a flora. Every individual subset comprised a set of N features (flora), where N was the number of features/solutions in the original set.
Population Initialization
At the earlier stage, AFA-FS performed random generation of original flora with N solutions, where N plants were present in the flora. The locality of the original plants was defined in the matrix
where i is the dimension, j is the number of plants in the flora, d is the limit area, and random (0, 1) is an array of arbitrary numbers, which undergo uniform distribution in the range (0, 1). Simultaneously, the PD of the original plant was determined. The original plant distributed seeds in a circular area with the radius PD. The PD was generated from the PDs of the parent and grandparent plants.
where is the PD of the grandparent plant,
is the PD of the parent plant,
and
are the learning coefficients, and rand (0,1) represents a number which undergoes uniform distribution in the range (0, 1).
Stop Initialization
A random number was generated in the range [0, 1] under uniform distribution. When the SP exceeded the value of r, the offspring plant was alive; otherwise, it was dead. Next, a set of N offspring plants from the live offspring was chosen as the set of new original plants, and the procedure was iterated until the required classification accuracy was attained or the maximum number of iterations was reached.
Determining the FF
The FF of the AFA-FS model is represented by EquationEquation (3)(3)
(3) , as given below
where denotes the feature subset determined by a plant
at iteration t,
represents the length, and n represents the number of iterations. The FF is equated to analyze the classification performance
and the number of chosen features. Here,
and
are the two variables that manage the relative weight of the classifier results and number of chosen features, respectively (
,
). EquationEquation (1)
(1)
(1) shows that the classification outcome and number of chosen features have distinct impact on the feature selection process. It was considered that the classification accuracy was more essential than the number of chosen features; hence, the values of
and
were set as
and
, respectively.
Updating Positions and PD
The locality of the offspring plant was generated based on the propagation function, which is defined by
where m is the number of seeds when a plant propagates, is the locality of the offspring plant,
is the locality of the original plant, and
is an arbitrary number with the Gaussian distribution with mean and variance ij. When no plant survived, a new original plant is produced using EquationEquation (4)
(4)
(4) . Furthermore, the new grandparent PD is represented by
The new parent PD is the standard deviation between the localities of the original and offspring plants.
Solution Construction
The number of plants placed in the search space was identical to that of the features existing in the dataset. Each plant determined the process of finding solutions based on the SP of the offspring plant, which is computed as shown in EquationEquation (7)(7)
(7) .
where is
to the power of
, and
is the selective probability. Of note, the FF of an offspring plant was farther from that of the original plant.
computed the exploration ability of the algorithm, and it should be high for the problem which was easily trapped to the local optima. At the same time,
is the maximum fitness in the flora and
is the fitness of the jth solution. The FF is an objective function, which is defined by EquationEquation (1)
(1)
(1) .
The process began under the initialized localities and PDs, which derived the solutions in every round. The chosen feature subsets were gathered and later validated. When an optimal subset had been explored and the model executed for a particular number of iterations, the procedure was terminated. When none of the criteria were satisfied, then an original plant was generated using EquationEquation (1)(1)
(1) and the localities and PDs were updated. This process continued as explained earlier.
Next, a roulette wheel selection process was applied to determine whether the offspring plant was alive or dead. The main intention was to “accept according to the probability,” where there existed numerous options, with each one having an individual significant score. However, the selection process was not solely based on the score and also depended on the accepting probability. As the score increased, the accepting probability also increased.
In summary, the fundamental processes involved in AFA are listed below:
Initialize the population based on EquationEquation (1)
(1)
Determine PD based on EquationEquations (4
Produce offspring plants and determine the FF;
Evaluate the SP of offspring plants using EquationEquation (7)
When live plants are present, arbitrarily choose
Save the optimal solutions;
Determine whether the termination criteria are satisfied. If yes, display the output, else jump to step 2.
The results of the proposed AFA-FS model are outlined in . Upon the execution of the AFA-FS model, a set of features, namely 1, 3, 4, 5, 6, 7, 8, 15, 16, 17, 18, and 20 were selected from the type 1 diabetes mellitus dataset. Moreover, for the type 2 diabetes mellitus dataset, the following set of features: 1, 2, 4, 6, 7, 8, 9, 12, 14, 15, 16, 19, 22, 24, 25, 27, 29, 31, 33, 36, 37, 41, 42, and 44 were chosen. Finally, the features 1, 2, 3, 5, 6, and 8 were selected from the GDM dataset.
Table 4 Features Selected by the Proposed AFA from the Applied Datasets
GBT-Based Classification
Once the optimal feature subset had been generated by the AFA-FS model, data classification was performed using GBT. GBT was a boosting model, which developed a precise model by including the baseline models in a sequential manner. The baseline models were trained at all training levels to minimize the loss function. FriedmanCitation50 presented the GBT model and the refined generalized boosting model, which make use of a regression tree as the baseline model. The GBT underwent initialization with a value . A gradient descent procedure was applied to each training process
for minimizing the loss function
. Consider the number of iterations as
. Under each training process, the first-order Taylor expansion of loss function was determined and
was computed for obtaining the direction of minimizing
. The GBT model was applied to choose a feature with the maximum information gain as the root node. Later, the root node partitions appended features with the subsequent best information gain as its child node. The partitioning and appending procedures were iterated for obtaining a set of new grandchild nodes. The input space was partitioned into
joint regions
with predicted constant values
, respectively. The base learner
is the sum of these predicted values. Next,
was determined for minimizing the loss function. Finally, the new model
was updated with the total of
and
. However, the maximum number of rounds resulted in poorly generalized models. To overcome this issue, Friedman’s algorithm makes use of a shrinkage variable
on the computed approach
to limit the learning rate of the training procedure. XGBoost software (an open-source software library which gives a regularizing inclination boosting structure for Python) is an adaptable software that precisely executes gradient boosting machines. It has been demonstrated to extend to registration of parameters for boosted tree calculations, and constructed and produced for the sole purpose of model performance and computational speed. We used XGBoost for implementation of the classification because it helped to frame decision trees with improved speed and a short execution time. It was also used to rectify relapse, grouping, positioning, and user characterized forecast issues.
Performance Validation
Here, we demonstrated the performance of the proposed AFA-GBT model using datasets of the three types of diabetes mellitus on Python (Python Software Foundation, Wilmington, DE, USA). The proposed method was implemented on a computer system having CPU Intel® Pentium 1.9 GHz, 64-bit operating system, Microsoft® Windows 10, 4 GB RAM, and Java JDK 1.8.
Performance Measures
Measures used to examine the outcomes of the AFA-FS model were precision, recall, accuracy, F-score, and kappa.
Results
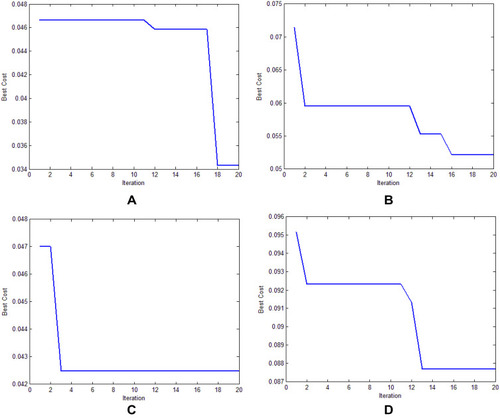
illustrates the best cost analysis of different feature selection models. The best cost refers to the fitness value, which is obtained from the FF of the applied algorithm. The value of the best cost should be low to yield a good performance. Our findings showed that the genetic algorithm-based feature selection model offered an ineffective selection of features with the best cost of 0.087642 (). Furthermore, the grey wolf optimization-based feature selection model outperformed the genetic algorithm-based feature selection model with the best cost of 0.052637. In addition, the particle swarm optimization-based feature selection model showed an effective feature selection performance with a moderate best cost of 0.042489. However, the AFA-FS model outperformed all these models and attained a best cost of 0.034299. These data confirmed the superior feature selection performance of the AFA-FS model.
Table 5 Comparative Analysis of the Different Feature Selection Models
Figure 7 The best cost analysis of different feature selection models. (A) Artificial flora algorithm-based feature selection (AFA-FS). (B) Grey wolf optimization-based feature selection (GWO-FS). (C) Particle swarm optimization-based feature selection (PSO-FS). (D) Genetic algorithm-based feature selection (GA-FS).
, , , shows the confusion matrix of the proposed AFA-GBT model generated at the time of execution. The data depicted in the figure are transformed into an easily understandable format in . The AFA-GBT model effectively classified a set of 145, 77,305, 254, and 23,006 instances as type 1 diabetes mellitus, type 2 diabetes mellitus, GDM, and normal condition, respectively. These values were used to determine the classification performance of the applied AFA-GBT model.
Table 6 Analysis of the Confusion Matrix Data
Figure 8 Confusion matrix generated for the proposed artificial flora algorithm (AFA)-based feature selection with gradient boosted tree (GBT)-based data classification (AFA-GBT) model.
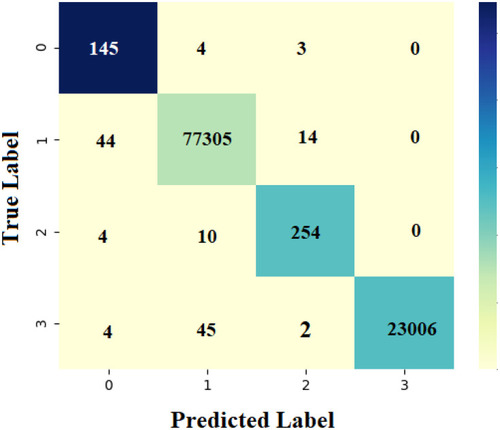
Figure 9 Precision and recall of the artificial flora algorithm (AFA)-based feature selection with gradient boosted tree (GBT)-based data classification (AFA-GBT) model.
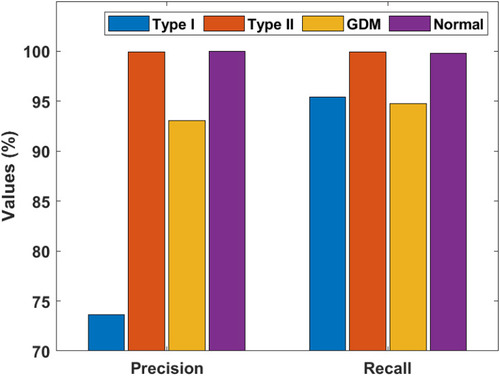
Figure 10 F-score and kappa of the artificial flora algorithm (AFA)-based feature selection with gradient boosted tree (GBT)-based data classification (AFA-GBT) model.
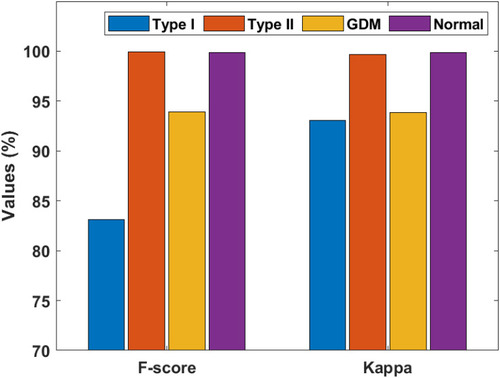
Figure 11 Accuracy of the artificial flora algorithm (AFA)-based feature selection with gradient boosted tree (GBT)-based data classification (AFA-GBT) model.
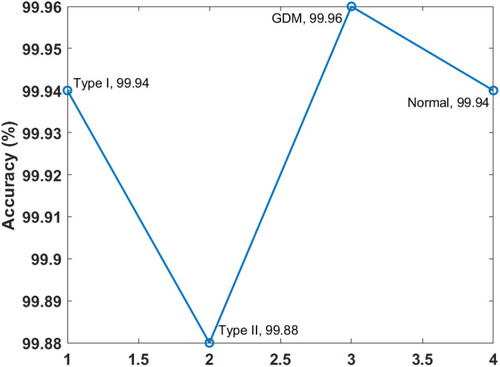
and portray the classifier results offered by the AFA-GBT model applied on the three datasets in terms of different performance measures. We observed that the AFA-GBT model classified the instances of type 1 diabetes mellitus with a precision of 73.60%, a recall of 95.39%, an accuracy of 99.85%, an F-score of 83.09%, and a kappa of 93.08%. Furthermore, the model classified type 2 diabetes mellitus instances with a maximum precision of 99.92%, a recall of 99.92%, an accuracy of 99.88%, an F-score of 99.92%, and a kappa of 99.67%. Similarly, for the GDM dataset, the AFA-GBT model showed effective classification with 93.04% precision, 94.77% recall, 99.96% accuracy, 99.88% F-score, and 99.85% kappa. Moreover, the normal instances were also appropriately classified with the highest precision of 100%, a recall of 99.77%, an accuracy of 99.94%, an F-score of 94.19%, and a kappa of 96.61%. Therefore, the enhanced performance of the AFA-GBT model was ensured by the maximum average precision of 91.64%, recall of 97.46%, accuracy of 99.93%, F-score of 94.19%, and kappa of 96.61%.
Table 7 Classification Performance of the Artificial Flora Algorithm (AFA)-Based Feature Selection with Gradient Boosted Tree (GBT)-Based Data Classification (AFA-GBT) Model Based on Different Measures (%)
Discussion
To demonstrate the superior performance of the proposed AFA-GBT model, we conducted a detailed comparative analysis with the recently proposed models ().Citation6 The traditional classifier models, namely MLP, Linear Regression, J48, Extreme Learning Machine, Naïve Bayes, Bayesian Net, Classification and Regression Tree, and k-Nearest Neighbor models showed minimum classifier accuracies, thereby indicating their ineffective classification performances. However, a slightly better performance was offered by the artificial metaplasticity on multilayer perceptron and hybrid models. Furthermore, the hybrid prediction model showed an acceptable classifier outcome with a moderate accuracy of 92.38%.
Table 8 Comparative Analysis of the Accuracy (%) of Different Classification Models
The fuzzy neural classifier and K-means with Linear Regression models offered accuracies of 94.50% and 95.42%, respectively. Nonetheless, the AFA-GBT model showed its superiority over the other models by offering the maximum accuracy of 99.93%.
Hence, our findings suggested that the AFA-GBT model demonstrated effective classification of patients’ diagnoses into the three types of diabetes mellitus with the maximum average precision of 91.64%, recall of 97.46%, accuracy of 99.93%, F-score of 94.19%, and kappa of 96.61%. Therefore, the proposed AFA-GBT model was found to be an effective tool for the classification of the three types of diabetes mellitus. Moreover, the AFA-FS model greatly helped increase the classification performance of the GBT model.
Limitations
Nonetheless, our proposed model has a few limitations. Using multiple datasets with various attributes tended to increase the computational complexity, which could be further scaled down. Additionally, there is still no balance between the numbers of the three types of samples.
Conclusion
This study presented an intelligent AFA-GBT model for the classification of diabetes mellitus. Since the selection of appropriate features from the dataset was considered as an optimization issue, the AFA was adopted for feature selection and the classification was performed using the GBT model. The GBT model was superior to other models because it was highly flexible, offered better classification accuracy and operated on both categorical and numerical values. We further aim to conduct the time complexity analysis and consider more data for type 1 diabetes mellitus and GDM. Finally, we plan to apply our proposed model for developing an intelligent system to recommend medicinesCitation51 to the patients suffering from diabetes mellitus.
Abbreviations
AFA, artificial flora algorithm; GBT, gradient boosted tree; GDM, gestational diabetes mellitus; AFA-FS, AFA-based feature selection; MLP, multilayer perceptron; PD, propagation distance; FF, fitness function; SP, survival probability.
Ethics Approval and Informed Consent
The model was developed using publicly shared anonymized data; therefore, no consent forms were required.
Author Contributions
All authors (P. Nagaraj, P. Deepalakshmi, Romany F. Mansour and Ahmed AlMazroa) made substantial contributions to conception and design, acquisition of data, or analysis and interpretation of data; took part in drafting the article or revising it critically for important intellectual content; agreed to submit to the current journal; gave final approval of the version to be published; and agree to be accountable for all aspects of the work.
Acknowledgments
The authors would like to thank Kalasalingam Academy of Research and Education for permission to conduct the research and providing the computational facilities.
Disclosure
The authors report no conflicts of interest in this work.
Additional information
Funding
References
- World Health Organization (WHO). Diabetes [Online]. 2020. Available from: https://www.who.int/news-room/fact-sheets/detail/diabetes. Accessed 3 4, 2020.
- Number of cases of diabetes in senior citizens across India from 2011 to 2050 [Online]. Available from: https://www.statista.com/statistics/944160/india-number-of-cases-of-diabetes-in-senior-citizens/#:~:text=2011%20to%202050.,The%20number%20of%20cases%20of%20diabetes%20in%20senior%20citizens%20across,to%20be%20about%2033.3%20million. Accessed 3 25, 2020.
- International Diabetes Federation (IDF). India [Online]. 2020. Available from: https://idf.org/our-network/regions-members/south-east-asia/members/94-india.html. Accessed 3 25, 2020.
- Sneha N , Gangil T . Analysis of diabetes mellitus for early prediction using optimal features selection. J Big Data . 2019;6(1):1–19. doi:10.1186/s40537-019-0175-6
- Zhou W , Sailani MR , Contrepois K , et al. Longitudinal multi-omics of host–microbe dynamics in prediabetes. Nature . 2019;569(7758):663–671. doi:10.1038/s41586-019-1236-x 31142858
- Yan B , Yu Y , Lin M , et al. High, but stable, trend in the prevalence of gestational diabetes mellitus: a population-based study in Xiamen, China. J Diabetes Investig . 2019;10(5):1358–1364. doi:10.1111/jdi.13039
- Melendez-Ramirez LY , Richards RJ , Cefalu WT . Complications of type 1 diabetes. Endocrinol Metab Clin North Am . 2010;39(3):625–640. doi:10.1016/j.ecl.2010.05.009 20723824
- Daneman D . Type 1 diabetes. Lancet . 2006;367(9513):847–858. doi:10.1016/S0140-6736(06)68341-4 16530579
- The Global Diabetes Community in UK. Type 2 diabetes [Online]. 2019. Available from: https://www.diabetes.co.uk/type2diabetes.html#:~:text=Like%20type%201%20diabetes%2C%20type,Heart%20disease. Accessed 3 5, 2020.
- The Global Diabetes Community in UK. Gestational diabetes [Online]. 2019. Available from: https://www.diabetes.co.uk/gestational-Diabetes.html. Accessed 3 5 2020.
- Johns EC , Denison FC , Norman JE , Reynolds RM . Gestational diabetes mellitus: mechanisms, treatment, and complications. Trends Endocrinol Metab . 2018;29(11):743–754. doi:10.1016/j.tem.2018.09.004 30297319
- Yogev Y , Visser GH . Obesity, gestational diabetes and pregnancy outcome. Semin Fetal Neonatal Med . 2009;14(2):77–84. doi:10.1016/j.siny.2008.09.002 18926784
- Barakat N , Bradley AP , Barakat MNH . Intelligible support vector machines for diagnosis of diabetes mellitus. IEEE Trans Inf Technol Biomed . 2010;14(4):1114–1120. doi:10.1109/TITB.2009.2039485 20071261
- Mansour RF . Evolutionary computing enriched computer-aided diagnosis system for diabetic retinopathy: a survey. IEEE Rev Biomed Eng . 2017;10:334–349. doi:10.1109/RBME.2017.2705064 28534786
- Samanta S , Pratama M , Sundaram S . A novel spatio-temporal fuzzy inference system (spatfis) and its stability analysis. Inf Sci . 2019;505:84–99. doi:10.1016/j.ins.2019.07.056
- Sheikhpour R , Sarram MA , Gharaghani S , Chahooki MAZ . A survey on semi-supervised feature selection methods. Pattern Recognit . 2017;64:141–158. doi:10.1016/j.patcog.2016.11.003
- Remeseiro B , Bolon-Canedo V . A review of feature selection methods in medical applications. Comput Biol Med . 2019;112:103375. doi:10.1016/j.compbiomed.2019.103375 31382212
- Solorio-Fernández S , Carrasco-Ochoa JA , Martínez-Trinidad JF . A review of unsupervised feature selection methods. Artif Intell Rev . 2020;53(2):907–948.20. doi:10.1007/s10462-019-09682-y
- Mansour RF . Deep-learning-based automatic computer-aided diagnosis system for diabetic retinopathy. Biomed Eng Lett . 2018;8(1):41–57. doi:10.1007/s13534-017-0047-y 30603189
- Marghilnai AL , Mansour RF . Abdulsamad, and RF Mansour, “Wavelet filter techniques for segmenting retinal blood vessels”. Int J Adv Appl Sci . 2017;4(9):156–160. doi:10.21833/ijaas.2017.09.022
- Mansour RF , Abdelrahim EM , Al-Johani AS . Identification of diabetic retinal exudates in digital color images using support vector machine. J Intell Learn Syst Appl . 2013;05(03):135–142. doi:10.4236/jilsa.2013.53015
- Doa’ei Y , Jahan AM . Application of artificial intelligence and meta-heuristic algorithms in civil health monitoring systems. Civ Eng J . 2018;4(7):1653–1666. doi:10.28991/cej-03091102
- Choudhury, A., & Gupta, D. (2019). A survey on medical diagnosis of diabetes using machine learning techniques. In Recent developments in machine learning and data analytics (pp. 67-78). Springer, Singapore.
- Singh DAAG , Leavline EJ , Baig BS . Diabetes prediction using medical data. J Comput Biol Bioinform . 2017;10(1):1–8.
- Azrar A , Ali Y , Awais M , Zaheer K . Data mining models comparison for diabetes prediction. Int J Adv Comput Sci Appl . 2018;9(8):320–323.
- Alirezaei M , Niaki STA , Niaki SAA . A bi-objective hybrid optimization algorithm to reduce noise and data dimension in diabetes diagnosis using support vector machines. Expert Syst Appl . 2019;127:47–57. doi:10.1016/j.eswa.2019.02.037
- Jarullah AA . Decision tree discovery for the diagnosis of type II diabetes. Proceedings of the International Conference on Innovations in Information Technology (IIT); April 25–27; 2011; Abu Dhabi, UAE:303–307.
- Sapna S , Tamilarasi A , Pravin Kumar M . Implementation of genetic algorithm in predicting diabetes. Int J Comput Sci Issues . 2012;9:234–240.
- Aishwarya S , Anto S . A Medical Expert System based on genetic algorithm and extreme learning machine for diabetes disease diagnosis. Int J Sci Eng Technol Res . 2014;3:1375–1380.
- Polat K , Gunes S , Arslan A . A cascade learning system for classification of diabetes disease: generalized discriminant analysis and least square support vector machine. Expert Syst Appl Int J . 2008;34:482–487. doi:10.1016/j.eswa.2006.09.012
- Ren Y , Bai G . Determination of optimal SVM parameters by using genetic algorithm/particle swarm optimization. J Comput . 2010;5:1160–1168. doi:10.4304/jcp.5.8.1160-1168
- Ali, R., Siddiqi, M. H., Idris, M., Kang, B. H., & Lee, S. (2014, December). Prediction of diabetes mellitus based on boosting ensemble modeling. In International conference on ubiquitous computing and ambient intelligence (pp. 25-28). Springer, Cham.
- Aslam MW , Zhu Z , Nandi AK . Feature generation using genetic programming with comparative partner selection for diabetes classification. Expert Syst Appl . 2013;40(13):5402–5412. doi:10.1016/j.eswa.2013.04.003
- Li JP , Haq AU , Din SU , Khan J , Khan A , Saboor A . Heart disease identification method using machine learning classification in e-healthcare. IEEE Access . 2020;8:107562–107582. doi:10.1109/ACCESS.2020.3001149
- Asaduzzaman S , Al Masud F , Bhuiyan T , Ahmed K , Paul BK , Rahman SM . Dataset on significant risk factors for type 1 diabetes: a Bangladeshi perspective. Data Brief . 2018;21:700–708. doi:10.1016/j.dib.2018.10.018 30666315
- Diabetes 130-US hospitals for years 1999–2008 data set [Online]. Available from: https://archive.ics.uci.edu/mL/datasets/diabetes+130-us+hospitals+for+years+1999-2008. Accessed 3 10, 2020.
- Pima Indians Diabetes Database [Online]. Available from: https://www.kaggle.com/uciml/pima-indians-diabetes-database. Accessed 3 10, 2020.
- Singh N , Singh P , Bhagat D . A rule extraction approach from support vector machines for diagnosing hypertension among diabetics. Expert Syst Appl . 2019;130:188–205. doi:10.1016/j.eswa.2019.04.029
- Ahmed MR , Rehana H , Asaduzzaman S . Ovarian cancer substantial risk factor analysis by machine learning: a low incoming country perspective. 2020.
- Al Masud F , Hosen MS , Ahmed A , et al. Development of score based smart risk prediction tool for detection of type-1 diabetes: a bioinformatics and machine learning approach. 2020.
- Graham E , Saxena A , Kirby H . Identifying high risk patients for hospital readmission. SMU Data Sci Rev . 2019;2(1):22.
- Abdollahi J , Nouri-Moghaddam B . Hybrid stacked ensemble combined with genetic algorithms for prediction of diabetes. arXiv . 2021;arXiv:2103.08186.
- Shukla, S., & Tripathi, S. P. (2021). EmbPred30: Assessing 30-Days Readmission for Diabetic Patients Using Categorical Embeddings. In Smart Innovations in Communication and Computational Sciences (pp. 81-90). Springer, Singapore.
- Taghiyev A , Altun A , Allahverdi N , Caglar S . A machine learning framework to identify the causes of HbA1c in patients with type 2 diabetes mellitus. J Control Eng Appl Inf . 2019;21(2):34–42.
- Patra R , Khuntia B . Analysis and prediction of Pima Indian Diabetes Dataset using SDKNN classifier technique. IOP Conf Ser Mater Sci Eng . 2021;1070(1):012059. doi:10.1088/1757-899X/1070/1/012059
- Bhoi SK . Prediction of diabetes in females of pima Indian heritage: a complete supervised learning approach. Turk J Comput Math Educ . 2021;12(10):3074–3084.
- Kumari S , Kumar D , Mittal M . An ensemble approach for classification and prediction of diabetes mellitus using soft voting classifier. Int J Cognit Comput Eng . 2021;2:40–46. doi:10.1016/j.ijcce.2021.01.001
- Bavkar VC , Shinde AA . Machine learning algorithms for diabetes prediction and neural network method for blood glucose measurement. Indian J Sci Technol . 2021;14(10):869–880. doi:10.17485/IJST/v14i10.2187
- Cheng L , Wu XH , Wang Y . Artificial flora (AF) optimization algorithm. Appl Sci . 2018;8(3):329. doi:10.3390/app8030329
- Friedman JH . Contrast trees and distribution boosting. Proc Natl Acad Sci . 2020;117(35):21175–21184. doi:10.1073/pnas.1921562117 32817416
- Nagaraj P , Deepalakshmi P . A framework for e-healthcare management service using recommender system. Electron Gov Int J . 2020;16(1–2):84–100.