Abstract
Aim
Saliva is one of the most abundant secretions in the human body and its collection is easy and noninvasive. The aim of this study was to find a medium that can be used to diagnose and monitor diabetes. In this, saliva could play a major role. To substantiate the role of saliva as a diagnostic tool, we compared saliva samples with blood glucose and glycated hemoglobin (HbA1c) in healthy and diabetic subjects.
Materials and methods
Included in the study were 106 patients, newly diagnosed with type 2 diabetes mellitus and 15 healthy control subjects. The patients and control subjects were asked to come to the clinic in the morning, after an 8-hour fast. At that time, 5 mL of venous blood was collected, 2 mL of which was collected in an ethylenediaminetetraacetic acid (EDTA)-containing blood collection tube and sent for HbA1c estimation. Unstimulated saliva was collected from both groups as well. The saliva and sera from the blood samples were subjected to glucose estimation.
Results
The correlation coefficient between serum glucose and salivary glucose in the control group was calculated and the r value was found to be 0.5216, which was statistically significant (P < 0.05). The correlation coefficient between serum glucose and salivary glucose in the patient group was also calculated and the r value was found to be 0.7686, which was highly significant (P < 0.01). Finally, the correlation coefficient between HbA1c level and salivary glucose in the patient group was calculated and the r value was found to be 0.5662, which was also highly significant (P < 0.01).
Introduction
Diabetes mellitus is a massive, growing, silent epidemic that has the potential to cripple health services in all parts of the world. Diabetes mellitus is a group of chronic diseases characterized by insulin deficiency, cellular resistance to insulin action, or both, resulting in hyperglycemia and other related metabolic disturbances. The disease is associated with serious complications of the eyes, kidneys, heart and blood vessels, and other organ systems, which may markedly impair quality of life and shorten the patient’s lifespan.Citation1 Many people are affected by diabetes worldwide and the number is climbing steeply.Citation2 Currently, a diagnosis of diabetes is achieved by evaluating blood glucose levels. However, monitoring of glycated hemoglobin (HbA1c) levels has become more common and frequent, providing an accurate measure of average glycemic control over the past three months.Citation3,Citation4 Monitoring blood glucose at frequent intervals causes unnecessary discomfort and mental trauma to patients; therefore, a much simpler and noninvasive technique for the diagnosis and monitoring of diabetes is very desirable.Citation5 The present study was conducted to determine the role of saliva as a diagnostic tool by correlating preprandial serum glucose and salivary glucose in the patient and control groups. To corroborate the glycemic control level with salivary glucose level, correlations between HbA1c and salivary glucose in the patient group were also determined.
Materials and methods
Included in the study were 106 patients (52 males and 54 females) aged 36–65 years, who were newly diagnosed with non-insulin-dependent (type 2) diabetes mellitus and attended the diabetic clinic and the outpatient department of Mahatma Gandhi Postgraduate Institute of Dental Sciences, as well as 15 healthy control volunteer subjects (nine males and six females), aged 36–65 years. The patients were grouped into three age groups: 31 in group 1 (aged 36–45 years), 52 in group 2 (aged 46–55 years), and 23 in group 3 (aged 56–65 years). Subjects currently under treatment for diabetes, diagnosed with type 1 diabetes mellitus, with any other systemic diseases, or with tobacco or alcohol habits were excluded from the study. Written consent was obtained from each individual taking part in the study and a data sheet was completed detailing the person’s name, age, sex, and relevant medical history. The patients and control subjects were asked to come into the clinic in the morning, on an empty stomach, after 8 hours of fasting; 5 mL venous blood was collected, 2 mL of which was collected in an ethylenediaminetetraacetic acid (EDTA)-containing blood collection tube and stored. The rest of the blood was collected in a sterilized glass test tube. The patients were asked to wash their mouths with tap water and to spit two or three times, after which they were told to spit the saliva pooled in their mouths for the following 10 minutes into the sterile sample collection container. The saliva and blood samples were centrifuged and glucose was estimated in the serum and supernatant saliva by the glucose oxidase-peroxidase method. Ninety-six patients were selected at random from the study group and their collected blood in the EDTA tubes was subjected to HbA1c-level estimation, using the ion exchange resin method.
Statistical analysis of the obtained data was conducted using WinSTAT® statistical software (v. 2007.1; R Fitch Software, Chicago, IL). Means and standard deviations (SDs) were calculated for the individual groups. These were then compared using Pearson’s correlation coefficient, independent Student’s t-test, Fisher’s test, and regression coefficient. A P value <0.05 was accepted as significant and a value <0.01 was considered highly significant.
Results
In the control group, the serum glucose levels ranged from 73.91 to 101.0 mg/dL, with a mean of 86.82 mg/dL and SD of 9.46. The salivary glucose levels ranged from 0.51 to 2.32 mg/dL, with a mean of 1.23 mg/dL and SD of 0.52. The correlation coefficient between serum glucose and salivary glucose was calculated and the r value was found to be 0.5216, which was statistically significant (P < 0.05).
In the patient group, the serum glucose ranged from 66.31 to 326.8 mg/dL, with a mean of 154.70 mg/dL and SD of 60.85. The salivary glucose ranged from 0.31 to 18.16 mg/dL, with a mean of 4.22 mg/dL and SD of 3.59. The correlation coefficient between serum glucose and salivary glucose was calculated and the r value was found to be 0.7686, which was highly significant (P < 0.01). It is worth noting that the significance of the study group was much greater than that of the control group.
The HbA1c level ranged from 5.5% to 14.1%, with a mean of 7.81% and SD of 1.65. The correlation coefficient between HbA1c level and salivary glucose was calculated and the r value was found to be 0.5662, which was highly significant (P < 0.01).
Comparisons of salivary glucose levels between the control and patient groups were performed with an independent t-test; a t-value of 3.21 was obtained and the difference was highly significant (P < 0.01), as shown in .
Table 1 Comparison of preprandial salivary glucose between control and patient groups
The patient group was divided into three subgroups depending upon their serum glucose level, as shown in . The salivary glucose levels of the three subgroups were compared using an f-test, and the difference was found to be highly significant (P < 0.01).
Table 2 Comparison of preprandial salivary glucose by serum glucose (patients)
Similarly, the patient group was divided into three subgroups according to their HbA1c percentage, as shown in . The salivary glucose levels of the three subgroups were again compared using an f-test and the difference found was highly significant (P < 0.01).
Table 3 Comparison of preprandial salivary glucose by glycated hemoglobin (HbA1c)
No significant differences were found (P > 0.05) in comparing salivary glucose levels across different
Discussion
Diabetes mellitus is a group of metabolic disorders that share the common underlying feature of hyperglycemia. Hyperglycemia in diabetes results from defects in insulin secretion, insulin action, or, most commonly, both. Chronic hyperglycemia and the attendant metabolic dysregulation may be associated with secondary damage in multiple organ systems, especially the kidneys, eyes, nerves, and blood vessels.Citation6
Data indicates that in 2011, 366 million people worldwide were affected by diabetes and the number is continuing to climb steeply.Citation7 By 2030, predictions suggest that the number of people with diabetes will reach 552 million. Currently, India is in the second position in the chart, after the People’s Republic of China.Citation7
Currently, a diagnosis of diabetes is achieved only by analyzing blood glucose levels (random, fasting, and postprandial),Citation8 which are invasive methods that are physically and psychologically traumatic to the patient. Therefore, a noninvasive, simple, and painless procedure, such as salivary glucose estimation, is very desirable.
In our study, we found that fasting salivary glucose values were higher among diabetics than in the controls; the difference was statistically highly significant (P < 0.01). Fleckseder and Carlson and RyanCitation9 reported the presence of sugar in the saliva of diabetic patients and other authors have reported increases in salivary glucose levels in diabetes mellitus patients in comparison to nondiabetics.Citation10–Citation21 However, Forbat et alCitation22 concluded that salivary glucose levels did not reflect blood glucose levels. Similarly, Carda et alCitation23 concluded that the salivary glucose levels of 76.4% of diabetic patients were in the normal range.
In the present study, there was a positive correlation between salivary and serum glucose in diabetic patients. A correlation between salivary and serum glucose was found in the controls as well. These correlations were found to be statistically significant. Hence, salivary glucose appears to be an indicator of serum glucose concentration in diabetic patients. Similar to our study, five studiesCitation11,Citation15,Citation17,Citation20,Citation21 found a positive correlation between salivary glucose and serum glucose. However, in contrast to our study, three other trialsCitation12,Citation22,Citation23 could not establish a correlation between salivary and serum glucose. Even Englander et alCitation10 expressed doubt regarding replacement of plasma with parotid secretion in the diagnosis of diabetes mellitus, because of its lower levels of glucose concentration. However, Mitsumori et alCitation5 manufactured a saliva analyzing system using a glucose sensor and performed in vivo evaluations, concluding that their salivary glucose level measurement system could be used as an indicator of blood glucose level.
We also estimated the HbA1c levels in diabetic patients and found a positive correlation between HbA1c percentage and salivary glucose level. The value was statistically significant. In contrast to our study, Lopez et alCitation18 did not find any correlation between salivary glucose level and HbA1c percentage. We divided the patient group into three subgroups based on their serum glucose level and compared the salivary glucose levels of those three groups. We found a statistically significant difference among the three groups, and the salivary glucose levels were found to increase as serum glucose levels increased. We found that patients with serum glucose levels below 130 mg/dL showed a mean salivary glucose level of 2.18 mg/dL. Patients with serum glucose levels between 130 and 200 mg/dL showed a mean salivary glucose level of 4.05 mg/dL and patients with serum glucose levels above 200 mg/dL reflected a mean salivary glucose level of 8.74 mg/dL. As such, we are tempted to say that patients with salivary glucose levels above 4 mg/dL have a very high chance of having serum glucose levels above 130 mg/dL.
Similarly, we divided the patient group into three subgroups based on their HbA1c percentage. Patients with HbA1c ≤ 7% were considered ideal control level, 7%–8% were considered reasonable control, and >8% were considered poor control.Citation24 When we compared salivary glucose levels across the three subgroups, we found a statistically significant difference between them. Here, also, an increase in the salivary glucose level was noticed with an increase in HbA1c percentage. The ideal level control showed a mean salivary glucose level of 2.30 mg/dL, the reasonable control showed 3.81 mg/dL, and the poor control showed 6.72 mg/dL. We found that poor glycemic control leads to a high salivary glucose level, hence, this points toward the poor glycemic control achieved in the patient. These results were similar to our earlier results based on serum glucose levels.
We know that glucose is present in the saliva of normal individuals; however, the mechanism of its secretion is still obscure. Both paracellular and intercellular pathways have been proposed,Citation25 but this is still an hypothesis rather than an established theory. Many authors have tried to explain the increased glucose content in the salivary secretion of diabetic patients. Lopez et alCitation18 tried to show that the salivary glands act as filters of blood glucose that are altered by hormonal or neural regulation. According to Qureshi et alCitation26 persistent hyperglycemia leads to microvascular changes in the blood vessels, as well as basement membrane alteration in the salivary glands. This leads to increased leakage of glucose from the ductal cells of the salivary gland, thereby increasing the glucose content in saliva. Sreedevi et alCitation20 quoting the works of Harrison, commented that glucose is a small molecule that easily diffuses through semipermeable membranes. Thus, large amounts of glucose become available to saliva when blood glucose levels are elevated, as in diabetes. Alterations in the permeability, occurring as a result of basement membrane changes in diabetes, may be an additional explanation for the increased concentration of glucose in saliva.
It is well-established that the complications of diabetes are due to microvascular changes.Citation6 Many theories have been put forth to explain the microvascular alterations. To summarize, hyperglycemia leads to increased advanced glycosylation end products, commonly known as “AGEs”. These AGEs crosslink proteins such as collagen and extracellular matrix proteins, leading to basement membrane alteration and, hence, endothelial dysfunction. This alters the microvasculature structure and makes it more permeable. Other products, such as sorbitol, diacylglycerol, and fructose-6-phosphate, which are formed because of chronic hyperglycemia, also lead to basement membrane alteration by altering the extracellular matrix proteins. The end result is a leaky microvasculature and a leaky basement membrane,Citation6 which explains the increased passage of glucose from the blood into the saliva in diabetes mellitus.
Belazi et alCitation15 proposed that the increased permeability of basement membrane in insulin-dependent diabetes mellitus may lead to enhanced leakage of serum-derived components into whole saliva via gingival crevices. The small glucose molecule can easily diffuse via the semipermeable basement membrane. They blamed the gingival crevicular fluid as the culprit for increased glucose levels in salivary secretion. This shows that the presence of glucose in saliva is multifactorial and no single mechanism can be blamed.
We found a highly significant correlation coefficient between salivary glucose level and serum glucose level, as well as between salivary glucose level and HbA1c percentage, and a regression coefficient was calculated. The regression coefficient gives the amount of increase or decrease in the serum glucose or HbA1c for a unit change in the salivary glucose. Hence, from a given value of salivary glucose, we can predict serum glucose level and HbA1c percentage by using the regression equation ( and ).
Figure 1 Correlation between preprandial salivary and serum glucose levels in the study group.
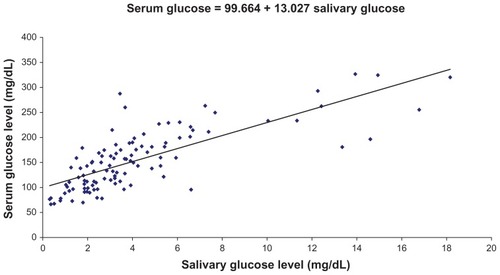
Figure 2 Correlation between preprandial salivary glucose levels and glycated hemoglobin (HbA1c) percentages in the study group.
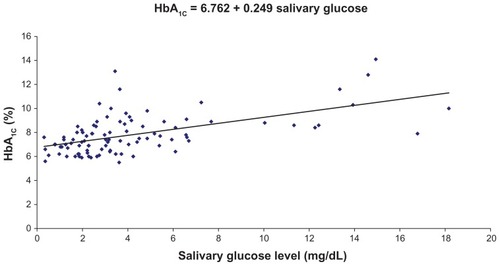
The respective formulas are:
We found increased fasting salivary glucose levels in patients suffering from diabetes mellitus. We also formulated equations to predict the fasting serum glucose level and HbA1c percentage when the fasting salivary glucose level is known. Therefore, it can be concluded that fasting salivary glucose level can be used as a noninvasive diagnostic, as well as a monitoring tool to assess the glycemic status of diabetes mellitus patients. Nevertheless, further studies on larger populations and in different geographic areas are needed to establish salivary glucose estimation as a diagnostic as well as a monitoring tool for diabetes mellitus.
Disclosure
The authors report no conflicts of interest in this work.
References
- Little RR Goldstein DE Endocrine (standardization of glycohemoglobin measurement) Anal chem 1995 67 12 393R 397R
- World Health Organization, International Diabetes Federation Diabetes Action Now Geneva World Health Organization 2004 Available from: http://www.who.int/entity/diabetes/actionnow/en/DANbooklet.pdf Accessed August 12, 2008
- Peterson KP Pavlovich JG Goldstein D Little R England J Peterson CM What is hemoglobin A1c? An analysis of glycated hemoglobins by electrospray ionization mass spectrometry Clin Chem 1998 44 9 1951 1958 9732983
- Kilpatrick ES Glycated haemoglobin in the year 2000 J Clin Pathol 2000 53 5 335 339 10889813
- Mitsumori M Yamaguchi M Kano Y A new approach to noninvasive measurement of blood glucose using saliva analyzing system Conf Proc IEEE Eng Med Biol Soc 1998 4 1767 1770
- Powers AC Diabetes mellitus Fauci A Braunwald E Kasper D Harrison’s Principles of Internal Medicine New York McGraw-Hill 2008 2275 2304
- Idf.org [homepage on the Internet] Brussels International Diabetes Federation 2011 Available from: http://www.idf.org/diabetesatlas Accessed April 10, 2012
- The Expert Committee on the Diagnosis and Classification of Diabetes Mellitus Report of the expert committee on the diagnosis and classification of diabetes mellitus Diabetes Care 2002 25 Suppl 1 S5 S20
- Carlson AJ Ryan JG Glucose in saliva Am J Physiol 1908 21 301 309
- Englander HR Jeffay AI Fuller JB Chauncey HH Glucose concentrations in blood plasma and parotid saliva of individuals with and without diabetes mellitus J Dent Res 1963 42 1246 14061947
- Reuterving CO Reuterving G Hägg E Ericson T Salivary flow rate and salivary glucose concentration in patients with diabetes mellitus influence of severity of diabetes Diabete Metab 1987 13 4 457 462 3678566
- Ben-Aryeh H Cohen M Kanter Y Szargel R Laufer D Salivary composition in diabetic patients J Diabet Complications 1988 2 2 96 99 2458369
- Thorstensson H Falk H Hugoson A Olsson J Some salivary factors in insulin-dependent diabetics Acta Odontol Scand 1989 47 3 175 183 2667279
- Darwazeh AM MacFarlane TW McCuish A Lamey PJ Mixed salivary glucose levels and candidal carriage in patients with diabetes mellitus J Oral Pathol Med 1991 20 6 280 283 1890663
- Belazi MA Galli-Tsinopoulou A Drakoulakos D Fleva A Papanayiotou PH Salivary alterations in insulin-dependent diabetes mellitus Int J Paediatr Dent 1998 8 1 29 33 9558543
- Borg Andersson A Birkhed D Berntorp K Lindgärde F Matsson L Glucose concentration in parotid saliva after glucose/food intake in individuals with glucose intolerance and diabetes mellitus Eur J Oral Sci 1998 106 5 931 937 9786322
- Amer S Yousuf M Siddqiui PQ Alam J Salivary glucose concentrations in patients with diabetes mellitus – a minimally invasive technique for monitoring blood glucose levels Pak J Pharm Sci 2001 14 1 33 37 16414850
- Lopez ME Colloca ME Paez RG Schallmach JN Koss MA Chervonagura A Salivary characteristics of diabetic children Braz Dent J 2003 14 1 26 31 12656461
- Aydin S A comparison of gherlin, glucose, alpha-amylase and protein levels in saliva from diabetics J Biochem Mol Biol 2007 40 1 29 35 17244479
- Sreedevi Shashikanth MC Shambulingappa P Comparison of serum glucose and salivary glucose in diabetic patients Journal of Indian Academy of Oral Medicine and Radiology 2008 20 1 9 13
- Jurysta C Bulur N Oguzhan B Salivary glucose concentration and excretion in normal and diabetic subjects J Biomed Biotechnol 2009 2009 430426 19503844
- Forbat LN Collins RE Maskell GK Sönksen PH Glucose concentrations in parotid fluid and venous blood of patients attending a diabetic clinic J R Soc Med 1981 74 10 725 728 7288781
- Carda C Mosquera-Lloreda N Salom L Gomez de Ferraris ME Peydró A Structural and functional salivary disorders in type 2 diabetic patients Med Oral Patol Oral Cir Bucal 2006 11 4 E309 314 English and Spanish 16816810
- Jayaram BM Type 2 diabetes and its complications: a preventive program 1st ed Bangalore Micro Labs 2008
- Takai N Yoshida Y Kakudo Y Secretion and re-absorption of glucose in rat submandibular and sublingual saliva J Dent Res 1983 62 10 1022 1025 6413563
- Qureshi A Qureshi A Qureshi H Khan AA Blood glucose level, salivary pH and oral bacterial count in type 1 diabetic children Infect Dis J 2007 16 2 45 48