Abstract
Objective
The aim of this study was to describe the minimum number of anthropometric measures that will optimally predict insulin resistance (IR) and to characterize the utility of these measures among obese and nonobese adolescents.
Research design and methods
Six anthropometric measures (selected from three categories: central adiposity, weight, and body composition) were measured from 1298 adolescents attending two New York City public high schools. Body composition was determined by bioelectric impedance analysis (BIA). The homeostatic model assessment of IR (HOMA-IR), based on fasting glucose and insulin concentrations, was used to estimate IR. Stepwise linear regression analyses were performed to predict HOMA-IR based on the six selected measures, while controlling for age.
Results
The stepwise regression retained both waist circumference (WC) and percentage of body fat (BF%). Notably, BMI was not retained. WC was a stronger predictor of HOMA-IR than BMI was. A regression model using solely WC performed best among the obese II group, while a model using solely BF% performed best among the lean group. Receiver operator characteristic curves showed the WC and BF% model to be more sensitive in detecting IR than BMI, but with less specificity.
Conclusion
WC combined with BF% was the best predictor of HOMA-IR. This finding can be attributed partly to the ability of BF% to model HOMA-IR among leaner participants and to the ability of WC to model HOMA-IR among participants who are more obese. BMI was comparatively weak in predicting IR, suggesting that assessments that are more comprehensive and include body composition analysis could increase detection of IR during adolescence, especially among those who are lean, yet insulin-resistant.
Introduction
Obesity has reached epidemic proportions over the last three decades.Citation1 Perhaps no group has undergone more startling changes than adolescents. The National Health and Nutrition Examination Survey reports that in 2008, 16.9% (12.5 million) of children and adolescents aged 2–19 years in the USA were obese.Citation2 Obesity, the accumulation of excessive body fat, is an important risk factor for serious pathologies, including hypertension, dyslipidemia, insulin resistance, and type 2 diabetes.Citation3 Although obesity is, itself, clinically useful as a predictor of diabetes, the relationship between obesity and insulin resistance (IR), a prediabetic condition, is far from absolute. Some obese individuals remain metabolically healthy, and some lean individuals have significant insulin resistance.Citation3 Therefore, it is important to establish which of the clinical anthropomorphic measures that have been associated with obesity help optimize the clinical prediction of IR.
A variety of methods have been used to quantify the degree of IR, with the hyperinsulinemic euglycemic clamp serving as the gold standard. The clamp provides a dynamic and accurate assessment, but it remains expensive, invasive, and time-consuming, making it unsuitable for clinical purposes or large-scale studies.Citation4 The homeostasis model assessment of IR (HOMA-IR) was developed to provide a simple, reliable, and inexpensive correlate to the clamp.Citation5,Citation6 Although the HOMA-IR is a static measure, it has been validated against the clampCitation6 and used extensively in adolescents, with a value of 3.16 proposed as the low value, above which there may be significant IR in adolescents.Citation4
While the HOMA-IR provides a reasonable estimate of insulin resistance, it is rarely performed without an initial degree of clinical suspicion. Often, this suspicion is based on excessive weight. Body mass index (BMI)Citation7 has been shown to be a useful predictor of insulin resistance.Citation8 Because body weight is the composite of the weight of all tissue types, BMI does not differentiate muscle from fat and, therefore, is a particularly poor measure of obesity among individuals such as athletes, who may have substantially greater muscle mass.Citation9
The simplicity of BMI makes it an attractive choice for clinicians; however, a number of more nuanced methods for quantifying body composition (adipose tissue, in particular) have been developed. Because BMI increases throughout adolescence, the Centers for Disease Control and Prevention (CDC) has produced growth charts that provide percentiles of BMI based on age and sex.Citation10 Many methods focus on quantifying central adiposity – the amount of fat in the abdominal region – which has been shown to be a powerful predictor of IR and other pathologies, such as metabolic syndrome and hypertension.Citation11 Waist circumference (WC), the most commonly utilized measure to quantify central adiposity, is an independent predictor for blood pressure, lipid levels, and IR.Citation12 However, WC has limitations as an absolute measure, and many have proposed a modification, the so called “waist- to-height” ratio, which is remarkably stable during normal adolescent growth.Citation13
A number of methods have been developed to measure more directly the amount of fat tissue. Computed tomography and magnetic resonance scans can accurately measure abdominal fat,Citation14–Citation16 but they are expensive (in the case of computed tomography, there is also radiation exposure) and require highly trained personnel for scan acquisition and data interpretation. Densitometric determinations of fat mass rely on submerging the subject underwater to perform hydrostatic weighing and volumetric measurements.
Bioelectric impedance analysis (BIA) has been in use since the 1980s to assess body composition. The advantages of BIA are that it is portable, relatively low cost, and noninvasive, and at the same time, maintains a high degree of accuracy and precision.Citation17,Citation18 A four-site cross-validation study showed high correlations (r2 > 0.9) between BIA measures and densitometrically determined lean body mass.Citation17 BIA is a useful method to estimate body composition for studies interested in a scalable and low-cost method.
Developing effective, inexpensive, noninvasive, and scalable screening techniques that can be used as markers for IR will facilitate the identification of individuals who would benefit from an intervention aimed at minimizing obesity-associated disease. Earlier detection of IR can potentially result in earlier interventions and improved health outcomes. Variability in IR based on age, ethnicity,Citation19 sex,Citation20 and body morphologyCitation11 have prompted investigations to search for more accurate and precise methods of assessing an adolescent’s risk of IR. A recent study by Gomez-Ambrosi et al shows that the overreliance on one mode of measurement may underserve patients who are physiologically normal according to one measurement (such as BMI), but are abnormal by other measures, such as body fat percentage or lipid profiles.Citation21 These patients will need more comprehensive evaluations, in order not to miss existent pathological conditions or delay interventions, and to keep the human and economic costs of preventable clinical disease from accruing.
The abundance of options for quantifying adiposity has led to discussions regarding which measures provide the most clinically useful and predictive information.Citation22,Citation23 While most researchers have focused on using only one measure at a time,Citation24 we sought to ascertain the possible combination of measures, feasible in a community setting, which would lead to optimized prediction of HOMA-IR value as a marker of IR. We used measures from three anthropomorphic categories: central adiposity, body composition, and BMI. In summary, the goal of this study was to describe which measures are necessary to predict HOMA-IR optimally and to characterize the relative importance of these measures between obese and nonobese individuals.
Research design and methods
The study was approved by the Institutional Review Boards of the New York University School of Medicine, the Nathan Kline Research Institute, the New York City Department of Education, and the New York City Department of Health and Mental Hygiene. The study procedures were carried out in accordance with the principles of the Declaration of Helsinki. Written informed consent was obtained from all participants (from the participants’ parents for those under 18 years of age).
The study group included 1298 subjects (714 females and 584 males), 14–20 years of age, from two New York City public high schools serving predominately Hispanic and African American students. At these schools, 82% of the students were eligible for the free lunch program, for which only economically disadvantaged households qualify. We excluded 26 participants due to self-reported type 1 diabetes, glucocorticoid use, BMI less than 16 kg/m2, or self-reported failure to fast during the 10 hours prior to the early morning blood draw. An additional 13 participants were excluded because they had fasting glucose levels either more than three SDs above the average or below the lower limit of normal glucose (<60 mg/dL). The characteristics of the included participants are shown in . For further details on the study and a complete description of the BODY Project procedures, please refer to Sweat and colleagues.Citation25
Table 1 Participant characteristics
Anthropometric methods
Each student was measured individually and confidentially, behind privacy screens. Height was measured in centimeters with no shoes, heels together, and the back of the subject parallel to the stadiometer (214 height rod; SECA, Hamburg, Germany). Weight was measured with an electronic, calibrated Health-O-Meter 349KLX balance beam scale (400 lb capacity) (Pelstar LLC, Bridgeview, IL), with only light clothes on. BMI was calculated in the standard way, using the algorithm provided by the CDC (Weight [kg])/(Height [m])2. We classified the participants into four groups, according to BMI: Lean (BMI < 24.9 kg/m2), Overweight (25 ≤ BMI < 29.9), Obese I (30 ≤ BMI < 34.9), and Obese II (BMI ≥ 35). Using the CDC growth chart, the BMI scores were transformed to produce age- and sex-adjusted BMI percentiles.
Waist circumference was measured, in centimeters, over a single layer of light clothes, with the student standing with a tape measure placed circumferentially parallel to the ground, just above the iliac crest, which generally corresponds to the level just below the umbilicus.
Body composition was estimated with bioelectrical impedance analysis, using a body composition 2.1 RJL Portable System and the Quantum IV Bioelectrical Impedance Analyzer (RJL Systems, Clinton Township, MI). Electrodes were placed on the standing subject’s clean skin on ipsilateral hand and foot; then, a small, imperceptible current was passed between those electrodes, and the body’s electrical resistance was recorded. By utilizing reference norms provided by the RJL, and depending on body frame size, estimates of body fat percentage and skeletal muscle mass were derived. First, fat mass was calculated using Chumlea’s equations, based on the National Health and Nutrition Examination Survey III data set.Citation18 Then, body fat percentage was derived by dividing the participant’s fat mass by his or her total weight. Skeletal muscle mass was also determined through bioelectrical impedance analysis, and was calculated using Janssen’s equation.Citation26
Laboratory determinations
Fasting blood samples to measure glucose and insulin levels were obtained between 7:30 and 8:00 am, after an overnight fast. The samples were collected prior to the beginning of the school day to limit the variability in activity among the students. IR was estimated by the HOMA-IR, using the equation HOMA-IR = fasting insulin concentration (μU/mL) × fasting glucose concentration (mg/dL)/405. Although HOMA-IR is a quantitative variable, we also created a qualitative measure of IR using the HOMA-IR lower limit of 3.16, above which adolescents were deemed insulin resistant.
Statistical analysis
Stepwise linear regression analyses, utilizing six candidate anthropomorphic measures as potential independent predictors, were performed to predict HOMA-IR. The six anthropomorphic measures used were WC, weight (kg), BMI, age- and sex-adjusted BMI percentile, body fat percentage (BF%), and skeletal muscle mass. Given that IR can be affected by age in adolescents, all regressions were run controlling for age. Due to the skewed nature of HOMA-IR scores in our sample, we used the natural log of HOMA-IR in the analysis to normalize its distribution. A stepwise regression was performed on all 1298 participants, using six anthropomorphic measures as predictive variables and Ln(HOMA-IR) as the dependent variable. Please note that to control for age-dependent variation in insulin sensitivity, age was manually entered into all regressions. Entry parameters were set at (F < 0.05), and removal parameters were set at (F > 0.10). A second stepwise regression was run, with the same conditions, after dividing the participants by sex.
After producing our multivariable model using stepwise regression, we wanted to assess how the new model would perform in the clinical prediction of IR. To this end, we entered the predicted HOMA-IR scores as a “test variable” in a receiver operator characteristic (ROC) curve, with the “state variable” being a HOMA-IR score above 3.16, as determined by the fasting glucose and insulin levels. In other words, participants were sorted into “normal” or “insulinresistant” groups by the predicted HOMA-IR scores of our newly derived model, and the accuracy of these groupings was compared with the actual degree of IR of our participants, as determined by blood samples. For the sake of comparison, the same procedure was performed to create ROC curves based on univariate models derived from WC, BF%, and BMI. Each model was analyzed for sensitivity and specificity at its optimal point of dichotomization as determined by selecting the point on the ROC curve with the maximal Youden index (calculated as 1 − sensitivity + specificity).
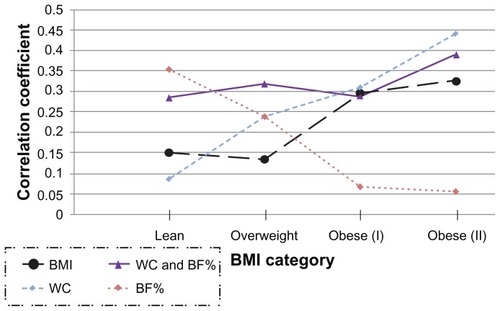
Finally, the correlation coefficients between the predicted HOMA-IR values (based on four different sets of predictive measures) and the observed HOMA-IR values were calculated for participants in each of the four BMI groups (lean, overweight, obese I, and obese II). These correlations were graphed to depict the strength of different predictive variables in predicting HOMA-IR across the different BMI categories. All statistical analyses were performed using SPSS software (v. 19; SPSS Inc, Chicago, IL).
Results
We had a total of 1298 students (470 lean, 462 overweight, 223 obese I, and 143 obese II) of predominantly Hispanic origin (922 Hispanic, 242 black, 134 other). The majority of our participants were not classified as insulin-resistant: 982 students had a HOMA-IR value less than 3.16, while only 316 students had a HOMA-IR value above 3.16. The proportion of participants classified as insulin-resistant was, as expected, highest among obese subjects, in particular in the obese II group; nevertheless, 8% of the lean group and 19% of the overweight group had HOMA-IR scores ≥3.16.
After we manually entered age into the equation, the stepwise regression produced an equation that retained only WC and BF%. The standardized beta coefficients of these variables were WC = 0.421, BF% = 0.229, and age = −0.157, indicating that WC predicted the largest amount of variance in Ln (HOMA-IR). BMI was not retained by the stepwise model, indicating that BMI has no predictive value once WC and BF% are accounted for. A comparison of single-variable regression models revealed WC to be the most predictive variable.
Females are known to have a larger percent of body fat than males across all weight groups, and as BF% was retained in the models predicting HOMA-IR for the whole population, we ran the same stepwise regression again, separating the group by sex.Citation27 These sex-specific stepwise regressions returned the same two predictive variables as did the overall model, but with slightly modified beta coefficients. Although both models were highly significant in their prediction of Ln(HOMA-IR), the model for males (r2 = 0.427) predicted a higher percentage of variance than did the model for females (r2 = 0.275).
The strength of the correlation between modeled HOMA-IR values and actual HOMA-IR values varied across BMI groups. The regression model using WC as a predictive factor performed the best in the obese II group, and had the worst predictive capacity in the lean group. The opposite was true of the regression model based on BF%; this model performed best among the lean group and worst among the obese II group. In contrast, the regression model that combined both WC and BF% was much more consistent across BMI ranges. In order to illustrate these findings, we calculated each participant’s “modeled HOMA-IR score” using four models with unique predictive measures: BMI, WC and BF%, WC, and BF%. These modeled HOMA-IR scores were then related to the measured HOMA-IR values by means of correlation coefficients in each of the four weight categories. shows these correlations. Please note that although BMI was not retained in the stepwise model, its ability to predict HOMA-IR is shown in as a reference, as it is often used clinically.
Figure 1 Correlation coefficients between modeled and actual HOMA-IR values, separated by BMI type.
Abbreviations: BF%, percentage of body fat; BMI, body mass index; HOMA-IR, homeostasis model of assessment-insulin resistance; WC and BF%, waist circumference and percentage of body fat; WC, waist circumference.
Finally, our ROC curves showed that a model based on WC and BF% was the best combination of anthropomorphic measures for predicting HOMA-IR, having the largest area under the curve (AUC), with a value of 0.816. This was significantly larger than the three other models, which scored as follows: WC (AUC = 0.811), BMI (AUC = 0.802), and BF% (AUC = 0.717). Finally, comparing the two models at their optimal dichotomization points (by selecting the point on the ROC curve that produced the largest value of [sensitivity + specificity]) indicated that our WC and BF% model was more sensitive in detecting IR than BMI (0.80 vs 0.75), but this came at the expense of a slight decrease in specificity (0.68 vs 0.71). The gap in models was most profound among participants with a BMI <30. Among these nonobese participants, the optimal BMI model had a sensitivity = 0.40, with a specificity = 0.86, while the WC and BF% model’s performance had better sensitivity (0.58) with only a small reduction in specificity (0.80).
Conclusions
This study provided two main findings. The first is that waist circumference combined with body fat percentage was the best predictor of HOMA-IR. The second finding was that the higher performance of the WC and BF% model can be partly attributed to the strength of BF% in predicting HOMA-IR among leaner participants, and the strength of WC in predicting HOMA-IR among participants who are more obese. These findings point to the relative weakness of BMI in predicting IR and suggest that assessments that are more comprehensive and include body composition analyses may increase detection of IR during adolescence. These data suggest that for obese patients (BMI ≥ 30), the use of WC is a highly informative predictor of HOMA-IR and could serve as a convincing basis for suspicion of clinical IR. However, in overweight and lean adolescents (BMI <30 kg/m2), the proportion of body fat may add important information about increases in adipose tissue that are not detected with WC.
It is worth noting that we were better able to predict HOMA-IR scores for male participants than for females. We suspect that the lower predictive capacity among females may be due to nonmodeled variability of HOMA-IR caused by variations in the estrous cycle among females; it is known that insulin production varies throughout the estrous cycle.Citation27 We also observed a wider distribution of WC and muscle mass among males, which may have contributed to a more precise modeling of HOMA-IR.
While we did not classify our participants by Tanner stage, our data shows a trend of increasing insulin sensitivity as participants exit puberty. As our participants were mostly 16–19 years old, the correlation of a lower HOMA-IR with older age agrees with previous studies showing a drop in insulin sensitivity during midadolescence.Citation28
As has been described by other investigators, it is likely that the subset of insulin resistant, nonobese individuals may have an increase in intramuscular fat deposits.Citation29 The existence of a lean, yet insulin-resistant, phenotype suggests that any model to detect IR based solely on weight (eg, BMI) will be insensitive among this subset of patients. This problem is emphasized by the work of Gomez-Ambrosi et al, who showed that some “lean” subjects are actually “obese” when measuring percentage of body fat.Citation21 While Gomez-Ambrosi showed that air-displacement plethysmography could uncover these “hidden” obese participants, our data suggests that the measurement of BF% using a simple bioimpedance analysis method is also useful. This is important because it indicates that body fat can be measured using a cheaper, portable, scalable method, while still producing results accurate enough to be clinically useful.
illustrates how body-impedance analysis provides special insight about lean patients. The findings suggest that WC has improved sensitivity when obesity has become extensive enough to produce clear central adiposity, while the sensitivity of BF% among leaner participants suggests that noncentral adiposity, such as fat accumulation in muscle and/or the liver, may also significantly contribute to IR in some individuals.Citation30
The use of ROC curves allowed us to determine whether higher r2 values would directly translate into increased sensitivity and specificity in the classification of IR. It could be argued that optimization of the dichotomization point should take into account underlying disease prevalence and weigh the risks and benefits of identifying someone erroneously as IR (false positive) versus missing someone who is IR (false negative). However, given that the first line of treatment for IR is centered around improvements in lifestyle, we would advocate that it is preferable to intervene when not necessary, rather than missing someone in need of intervention. The dichotomization point for WC or BF% to establish risk will differ, depending on characteristics of the individual. However, by looking at an average participant, our results most closely adhere to the following previously recommended cutoffs for WC and BF%: 88 cm for females and 102 cm for males, 35% for females and 25% for males, respectively.Citation31,Citation32
The strengths of this study were the large sample size, its applicability to the real world because of the low cost, and evaluation in a community setting. Our emphasis on an adolescent population is another strength of this study. By focusing on anthropomorphic measures with low collection costs that can be reliably collected by trained nonmedical personnel in a community setting, we hope to encourage the increased practice of screening for IR in adolescents.
Perhaps the most significant weakness of our study was the lack of ethnic diversity among our participants, with the vast majority being Hispanic, thus limiting our ability to generalize to a broader population. Second, HOMA-IR has the limitation of being a nondynamic assessment of insulin function. Furthermore, the splitting of HOMA-IR from a quantitative variable into a qualitative variable for the ROC curve reduced the statistical power of our findings. However, this seemed a worthwhile tradeoff, as it provided the clinically pertinent values of sensitivity and specificity; the quantitative HOMA-IR scores produced by our linear regression models are less understandable to clinicians.
We conclude that the use of BMI as the sole screening tool for IR in adolescents is insufficient. Not only have single measures other than BMI, such as waist circumference, been shown to be more accurate predictors of HOMA, but the use of multiple variables, as documented in this study, provide further additive improvements in prediction. We propose that the use of WC, with judicious further utilization of BF% by means of body impedance analysis in leaner subjects, would provide optimal predictive capacity while keeping the process clinically feasible and scalable.
Acknowledgments
This work was supported by the NYU Langone Medical Center Community Service Plan and the Nathan Kline Institute.
Disclosure
The authors report no conflicts of interest in this work.
References
- Sinha R Fisch G Teague B Prevalence of impaired glucose tolerance among children and adolescents with marked obesity N Engl J Med 2002 346 11 802 810 11893791
- Hedley AA Ogden CL Johnson CL Carroll MD Curtin LR Flegal KM Prevalence of overweight and obesity among US children, adolescents, and adults, 1999–2002 JAMA 2004 291 23 2847 2850 15199035
- Golay A Ybarra J Link between obesity and type 2 diabetes Best Pract Res Clin Endocrinol Metab 2005 19 4 649 663 16311223
- Keskin M Kurtoglu S Kendirci M Atabek ME Yazici C Homeostasis model assessment is more reliable than the fasting glucose/insulin ratio and quantitative insulin sensitivity check index for assessing insulin resistance among obese children and adolescents Pediatrics 2005 115 4 e500 e503 15741351
- DeFronzo RA Tobin JD Andres R Glucose clamp technique: a method for quantifying insulin secretion and resistance Am J Physiol 1979 237 3 E214 E223 382871
- Bonora E Targher G Alberiche M Homeostasis model assessment closely mirrors the glucose clamp technique in the assessment of insulin sensitivity: studies in subjects with various degrees of glucose tolerance and insulin sensitivity Diabetes Care 2000 23 1 57 63 10857969
- Quetelet LA Anthropometrie ou Mesure des Differentes Facultes de l’homme Brussels, Belgium C. Muquardt 1871
- McAuley KA Williams SM Mann JI Diagnosing insulin resistance in the general population Diabetes Care 2001 24 3 460 464 11289468
- Prentice AM Jebb SA Beyond body mass index Obes Rev 2001 2 3 141 147 12120099
- National Center for Health Statistics 2000 CDC Growth Charts for the United States: Body Mass Index for Age Tables, Children Ages 2–20 Years, Selected Percentiles Available from: http://www.cdc.gov/growthcharts/html_charts/bmiagerev.htm Accessed November 25, 2011
- Mokha JS Srinivasan SR Dasmahapatra P Utility of waist-to-height ratio in assessing the status of central obesity and related cardiometabolic risk profile among normal weight and overweight/obese children: the Bogalusa Heart Study BMC Pediatr 2010 10 1 73 20937123
- Zimmet P Alberti KG Kaufman F The metabolic syndrome in children and adolescents – an IDF consensus report Pediatr Diabetes 2007 8 5 299 306 17850473
- Aeberli I Gut-Knabenhans I Kusche-Ammann RS Molinari L Zimmermann MB Waist circumference and waist-to-height ratio percentiles in a nationally representative sample of 6–13 year old children in Switzerland Swiss Med Wkly 2011 141 w13227 21720967
- Rössner S Bo WJ Hiltbrandt E Adipose tissue determinations in cadavers – a comparison between cross-sectional planimetry and computed tomography Int J Obes 1990 14 10 893 902 2269582
- Abate N Burns D Peshock RM Garg A Grundy SM Estimation of adipose tissue mass by magnetic resonance imaging: validation against dissection in human cadavers J Lipid Res 1994 35 8 1490 1496 7989873
- Browning LM Mugridge O Dixon AK Aitken SW Prentice AM Jebb SA Measuring abdominal adipose tissue: comparison of simpler methods with MRI Obes Facts 2011 4 1 9 15 21372606
- Segal KR Van Loan M Fitzgerald PI Hodgdon JA Van Itallie TB Lean body mass estimation by bioelectrical impedance analysis: a four-site cross-validation study Am J Clin Nutr 1988 47 1 7 14 3337041
- Chumlea WC Guo SS Kuczmarski RJ Body composition estimates from NHANES III bioelectrical impedance data In J Obes Relat Metab Disord 2002 26 12 1596 1609
- Abate N Chandalia M The impact of ethnicity on type 2 diabetes J Diabetes Complications 2003 17 1 39 58 12505756
- Wang H Shara NM Calhoun D Umans JG Lee ET Howard BV Incidence rates and predictors of diabetes in those with prediabetes: the Strong Heart Study Diabetes Metab Res Rev 2010 26 5 378 385 20578203
- Gomez-Ambrosi J Silva C Galofre JC Body adiposity and type 2 diabetes: increased risk with a high body fat percentage even having a normal BMI Obesity (Silver Spring) 2011 19 7 1439 1444 21394093
- Wahrenberg H Hertel K Leijonhufvud BM Persson LG Toft E Arner P Use of waist circumference to predict insulin resistance: retrospective study BMJ 2005 330 7504 1363 1364 15833749
- Lee S Bacha F Gungor N Arslanian SA Waist circumference is an independent predictor of insulin resistance in black and white youths J Pediatr 2006 148 2 188 194 16492427
- Luksiene DI Petkeviciene J Jureniene K Klumbiene J Smalinskiene A Tamosiunas A Association between anthropometric indexes and cardiovascular risk factors Cent Eur J Med 2011 6 4 411 417
- Sweat V Bruzzese JM Albert S Pinero DJ Fierman A Convit A The Banishing Obesity and Diabetes in Youth (BODY) Project: description and feasibility of a program to halt obesity-associated disease among urban high school students J Community Health 2012 37 2 365 371 21826529
- Janssen I Heymsfield SB Baumgartner RN Ross R Estimation of skeletal muscle mass by bioelectrical impedance analysis J Appl Physiol 2000 89 2 465 471 10926627
- Geer EB Shen W Gender differences in insulin resistance, body composition, and energy balance Gend Med 2009 6 Suppl 1 60 75 19318219
- Lindgren F Dahlquist G Efendić S Persson B Skottner A Insulin sensitivity and glucose-induced insulin response changes during adolescence Acta Paediatr Scand 1990 79 4 431 436 2140921
- Park SY Cho YR Kim HJ Mechanism of glucose intolerance in mice with dominant negative mutation of CEACAM1 Am J Physiol Endocrinol Metab 2006 291 3 E517 524 16638824
- Ryan AS Buscemi A Forrester L Hafer-Macko CE Ivey FM Atrophy and intramuscular fat in specific muscles of the thigh: associated weakness and hyperinsulinemia in stroke survivors Neurorehabil Neural Repair 2011 25 9 865 872 21734070
- Janssen I Katzmarzyk PT Ross R Body mass index, waist circumference, and health risk: evidence in support of current National Institutes of Health guidelines Arch Intern Med 2002 162 18 2074 2079 12374515
- Li L Wang C Bao Y Peng L Gu H Jia W Optimal body fat percentage cut-offs for obesity in Chinese adults Clin Exp Pharmacol Physiol 2012 39 4 393 398 22320261