Abstract
Background
Recent studies have demonstrated an increased incidence of pancreatitis in patients with type 2 diabetes compared with obese nondiabetic individuals. Serum lipase and pancreatic amylase concentrations are used in conjunction with clinical findings to diagnose pancreatitis.
Methods
In two large clinical trials of overweight/obese nondiabetic and type 2 diabetic subjects, lipase and pancreatic amylase were measured at screening and 2–5 weeks later at baseline (prior to treatment with study medication).
Results
Lipase and pancreatic amylase concentrations were above the upper limit of normal (ULN) in 13% and 6% of type 2 diabetic subjects, respectively, and were approximately three-fold (3 ×) higher than the proportion of nondiabetic subjects with levels above ULN. Elevations exceeding ULN were seen in many subjects asymptomatic for pancreatitis; however, elevations >2 × ULN and >3 × ULN were uncommon, and elevations >3 × ULN were often associated with a history of dyslipidemia, hyperlipidemia, and gastrointestinal disorders. Additionally, enzyme concentrations varied within this 2–5-week screening period, including shifts between elevated and normal levels.
Conclusion
Results from this post hoc analysis suggest that, although pancreatic enzymes can be a useful marker for pancreatitis within the proper clinical context, diagnosis of pancreatitis may be confounded in populations known to have asymptomatic elevations associated with disease, such as type 2 diabetes. Further effort is needed to clarify the etiology and epidemiology of pancreatic enzyme elevations in type 2 diabetes.
Keywords:
Introduction
In recent years, postmarketing safety surveillance has raised concerns about the risk of pancreatitis in patients with type 2 diabetes who receive antidiabetic therapies. The US Food and Drug Administration has issued safety alerts that identified cases of acute pancreatitis associated with the glucagon-like peptide-1 receptor agonists, exenatide and liraglutide, and with the dipeptidyl peptidase-4 inhibitor, sitagliptin.Citation1–Citation3 Because acute pancreatitis is associated with considerable morbidity and mortality, the Food and Drug Administration has recommended revisions to prescribing information to alert health care professionals to this potentially serious adverse event. However, a caveat to these reports is that a definitive diagnosis of pancreatitis was available for only a portion of these cases; many patients who received exenatide did not have imaging studies or other diagnostic procedures to confirm the diagnosis. This issue is further complicated by an increased incidence of pancreatitis observed in individuals with type 2 diabetes compared with individuals without diabetes.Citation4–Citation6
Measurement of serum lipase and pancreatic amylase concentrations, although useful in the differential diagnosis of acute abdominal pain,Citation7 can be confounded because abnormally high levels are found in diseases other than pancreatitis, including hyperglycemia, dehydration, ketoacidosis, and benign pancreatic hyperenzymemia, and in cases of traumatic injury and recent surgery.Citation8–Citation10 The objective of this post hoc analysis was to evaluate the variability in pancreatic enzyme concentrations in type 2 diabetic and obese nondiabetic (control) populations.
Materials and methods
Subjects and study design
Subjects were recruited for two large clinical trials that included individuals with type 2 diabetes (ClinicalTrials.gov NCT00637273) and overweight/obese individuals without diabetes (NCT00673387). Subjects were at least 18 years old and had a body mass index of 25–45 kg/m2 and 27–45 kg/m2 in the diabetes and obesity trials, respectively. Subjects in the diabetes trial had an HbA1c measurement of 6.5%–11.0% at screening. Subjects in the obesity trial were excluded from participation if fasting plasma glucose was ≥126 mg/dL at screening and/or there was a history of diabetes.
Serum lipase and pancreatic amylase were measured in the subjects at screening and at baseline (prior to treatment with study medication), up to 2 weeks later in the diabetes trial, and up to 5 weeks later in the obesity trial. All samples were assayed by the same laboratory (Quintiles Laboratories Ltd, Marietta, GA) using the same enzymatic colorimetric assays. Normal ranges of pancreatic amylase and lipase were defined as 13–53 IU/L and 0–60 U/L, respectively. Participating study centers conducted trials using a clinical protocol approved by their respective institutional review boards. All participants gave their written informed consent. Studies were conducted in accordance with the principles described in the Declaration of Helsinki, including all amendments through the 1996 South Africa revision.Citation11
Statistical analysis
Mean ± standard deviation enzyme concentrations and changes in concentrations from screening to baseline were summarized for each subject population, separated by subjects who failed screening (screening data only) and subjects who did not fail screening who were randomized (screening and baseline data available). The proportion of subjects with abnormal pancreatic amylase and/or lipase values greater than once, twice, and three times the upper limit of normal (ULN) were also summarized. Two-sample t-tests were used to compare the mean pancreatic enzyme concentration by analyte and visit between the two study populations (type 2 diabetic versus obese nondiabetic) in subjects who were subsequently randomized into their respective studies. A correlation analysis between HbA1c and each pancreatic enzyme was also conducted by analyte and visit, separately for subjects who failed screening and subjects who were randomized.
Results
Patient disposition and baseline characteristics
This analysis included data from a population of subjects with type 2 diabetes (screening, n = 917; baseline, n = 514) and a population without diabetes who were overweight or obese, but otherwise healthy (screening, n = 952; baseline, n = 608). The higher number of subjects at screening compared with baseline reflects the inclusion of screening failures at the screening time point. Analysis of the screen failures (type 2 diabetic, n = 403 and obese nondiabetic, n = 344) showed no apparent difference in mean amylase and lipase concentrations in this group compared with those individuals who were randomized to study medication (ie, the baseline group, see ). Although amylase and lipase concentrations above normal and a history of pancreatitis were not exclusion criteria in either trial, potential subjects could fail the screening on the basis of abnormal laboratory findings or medical conditions judged by the investigators to be clinically significant. Subjects received no therapeutic intervention (including dietary modification) between the screening and baseline time points. Demographic and baseline characteristics at baseline varied somewhat between the type 2 diabetic and obese nondiabetic populations (). The difference in ethnicity between the two populations was due to the nondiabetic obesity trial being conducted in the US, whereas the diabetes trial was conducted in multiple countries.
Figure 1 Mean pancreatic enzyme concentrations at screening and baseline in subjects with or without diabetes, separated by randomized subjects and subjects who failed screening. The time between screening and baseline was up to 2 weeks in the type 2 diabetic population and up to 5 weeks in the obese nondiabetic population. (A) Mean (±standard deviation) lipase concentrations. (B) Mean (±standard deviation) pancreatic amylase concentrations.
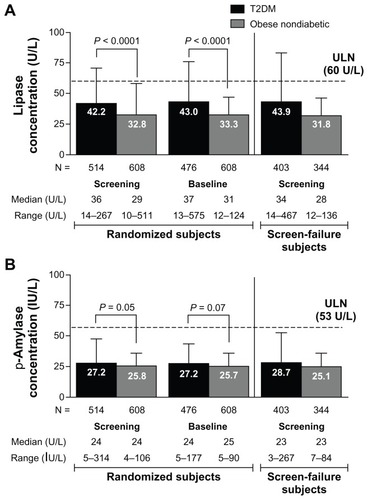
Table 1 Patient demographics
Lipase and pancreatic amylase concentrations
Overall, lipase and pancreatic amylase concentrations were elevated in more subjects with diabetes than in subjects without diabetes in the randomized subject population. The mean lipase concentration was 29% higher in type 2 diabetic subjects than in obese nondiabetic subjects at screening (42.2 ± 28.7 U/L versus 32.8 ± 25.5 U/L, respectively; P < 0.0001) and baseline (43.0 ± 33.4 U/L versus 33.3 ± 13.7 U/L; P < 0.0001, see ). Data for screen-failure subjects are shown in . In contrast, mean pancreatic amylase concentration was only slightly (6%–7%) higher in type 2 diabetic subjects compared with obese nondiabetic subjects at both screening (27.7 ± 19.8 IU/L versus 25.8 ± 10.3 IU/L; P = 0.05) and baseline (27.2 ± 16.3 IU/L versus 25.7 ± 9.9 IU/L; P = 0.07, see ).
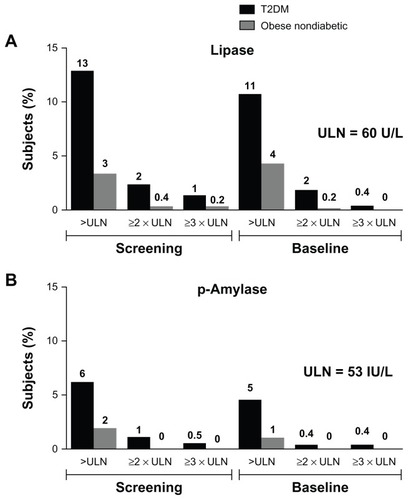
At screening, more subjects in the type 2 diabetic group had elevated (>ULN) lipase (13%) or elevated pancreatic amylase (6%) concentrations than did subjects in the obese nondiabetic group (4% and 2%, respectively). Similar proportions of elevated enzyme levels were seen at baseline (). The proportion of subjects with elevated enzyme levels (>ULN) at screening was similar in subjects who failed screening and subjects who were randomized in each study. Elevations in lipase or pancreatic amylase three times above (3 ×) ULN were rare. In the screened type 2 diabetic population, 13 subjects (1.0%) at screening and two subjects (0.4%) at baseline had >3 × ULN lipase levels; in the obese nondiabetic population, two subjects (0.2%) at screening and no subjects at baseline had >3 × ULN lipase concentrations (). Examination of the medical histories for the randomized subjects with lipase >3 × ULN revealed that the subjects had histories of hyperlipidemia, dyslipidemia, hypercholesterolemia, a hepatobiliary disorder, or obesity.
Figure 2 Percentage of all screened subjects (type 2 diabetic, N = 917; obese nondiabetic, N = 952) with elevated enzyme concentrations >ULN, ≥2 × ULN, and ≥3 × ULN. (A) Percentage of subjects with elevated lipase concentrations. (B) Percentage of subjects with elevated pancreatic amylase concentrations.
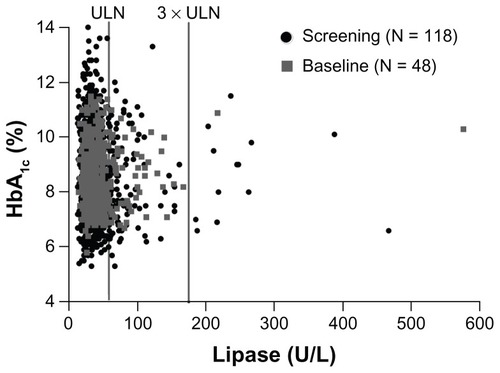
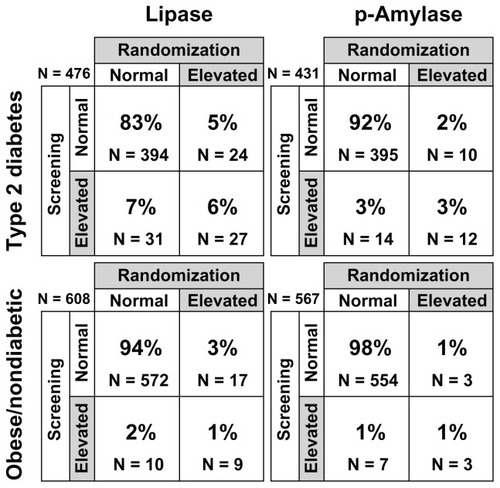
Evaluation of categorization of subjects by normal (≤ULN) or high (>ULN) enzyme status showed a change in status from screening to baseline for many subjects (). In the type 2 diabetic population, 53% (31/58) of subjects with elevated lipase and 54% (14/26) with elevated pancreatic amylase at screening had normal levels at baseline. In the obese nondiabetic population, 53% (10 of 19) of subjects with elevated lipase levels and 70% (7/10) with elevated pancreatic amylase levels at screening had normal levels at baseline. Elevations in lipase or pancreatic amylase were not associated with abdominal pain at the time the samples were obtained, nor were any symptoms of pancreatitis identified in subjects with elevated concentrations. Additionally, in the subjects with type 2 diabetes, the correlation between HbA1c and lipase or pancreatic amylase concentrations were all weak at screening or baseline (correlation coefficient between −11% and 8%, with most P values >0.05, ).
Figure 3 Categorical designations, ie, normal (≤ULN) or elevated (>ULN), indicating percentages of subjects with no change, change from elevated to normal, or change from normal to elevated from screening to baseline.
Figure 4 Scatter plot of HbA1c values versus lipase concentrations in subjects with type 2 diabetes and elevated lipase at screening (black circles) and baseline (gray squares).
Note: Number (N) of subjects included in this analysis was based on the number of subjects with available data at screening and baseline.
Note: Percentages may not add to 100% due to rounding.
Abbreviations: ULN, upper limit of normal; p-Amylase, pancreatic amylase.
Discussion
The results of this exploratory analysis show that pancreatic enzyme concentrations are generally higher in individuals with type 2 diabetes than in those without diabetes, are highly variable between individuals, and vary over time. Subjects with diabetes were more likely to have abnormal enzyme concentrations than were subjects without diabetes. Over half of the subjects with elevated enzyme concentrations at screening had normal concentrations at baseline 2–5 weeks later. These results are consistent with previous reports showing that the type 2 diabetic population is likely to have enzyme elevations in the absence of pancreatitis.Citation8,Citation12 The etiology and significance of these asymptomatic increases in pancreatic enzymes in the type 2 diabetic population is still unknown and warrants further investigation.
The incidence of pancreatitis has increased in the general population in the past two decades,Citation13 much of which may be due to alcohol abuse, obesity, cholelithiasis, and hypertriglyceridemia.Citation13–Citation15 Moreover, an association between increased risk of pancreatitis and type 2 diabetes has been observed.Citation4–Citation6 In a study of 337,067 patients using a large US health care database, patients with type 2 diabetes were at a 2.8-fold greater risk of developing pancreatitis compared with individuals without diabetes (95% confidence interval −2.61 to 3.06).Citation6 Although the direct pathogenic mechanism by which diabetes increases the susceptibility to pancreatitis is unknown, insulin resistance and hyperglycemia appear to be important factors linked to the increase in pancreatitis in individuals with type 2 diabetes.Citation16 A previous study of amylase and lipase abnormalities found that pancreatic enzyme concentrations increased with metabolic disequilibrium such as hyperglycemia (and poor glucose control), dehydration, and ketoacidosis.Citation8 However, in the current analysis, no correlation was found between HbA1c and lipase concentrations in the type 2 diabetic group. There is also no clear explanation for the high rate of variability in pancreatic enzyme concentrations, as demonstrated by the majority of type 2 diabetic subjects with elevated enzymes at screening returning to normal 2 weeks later.
Elevations in lipase above 3 × ULN, in the absence of renal failure, are generally consistent with acute pancreatitis.Citation7 In this analysis, elevations above 3 × ULN were rare, but did occur in 12 subjects without pancreatitis. Notable comorbidities or histories of dyslipidemia, hyperlipidemia, or hepatobiliary disorders were found in all patients with lipase >3 × ULN. Due to the small number of patients affected, a definitive link could not be made between the presence of diabetes, lipase >3 × ULN, and the comorbidities associated with pancreatitis; however, the association of these factors warrants further study. Excessive alcohol consumption (more than 1–2 drinks per day) was an exclusion criterion for the clinical trials included in this analysis, so alcohol was less likely to be a contributing factor to enzyme elevations in these studies. However, obesity and hyperlipidemia were prevalent in these subjects; in addition to the subjects in the obese nondiabetic group, many of the subjects in the type 2 diabetic group included in this analysis were obese, with a mean body mass index of 32 kg/m2. Only a weak correlation was found between HbA1c and lipase concentrations in the type 2 diabetic group.
Limitations
Although the two studies were similar in many ways, there were some differences in baseline characteristics that had an unknown effect on enzyme concentrations in this analysis. In both trials, potential subjects could be excluded from participation on the basis of abnormal laboratory findings or medical conditions judged by the investigators to be clinically significant (including chronic pancreatitis). However, gender, race, body mass index, and body weight were different between the groups at screening. The effect of these factors is unknown, and this limitation reflects the retrospective nature of the analysis. A prospective, controlled analysis would help to elucidate the etiology of pancreatic enzyme elevations in these populations. Further, elevations in enzymes may have been influenced by comorbidities commonly found in diabetic and obese nondiabetic patients (eg, cholelithiasis, hypertriglyceridemia). However, it is not possible to speculate whether patients without risk factors for pancreatitis (ie, healthy subjects) would have similar incidences of increased pancreatic enzyme concentrations, because this study only included patients with diabetes and obesity, both of which are common comorbidities with pancreatitis. This analysis was also limited to two time points relatively close together (<5 weeks), thus a longer, noninterventional analysis and follow-up imaging or other confirmatory procedures completed during the screening period are not available.
Conclusion
Overall, subjects with type 2 diabetes had higher pancreatic enzyme concentrations than those without diabetes prior to treatment with the study medication, and enzyme concentrations varied greatly, both between subjects and in the same subject over time. The results of this post hoc analysis suggest that in patients with type 2 diabetes, asymptomatic elevations in pancreatic enzymes are common and may confound the diagnosis of pancreatitis. Enzyme concentrations >3 × ULN should be considered in context with compatible clinical features of pancreatitis, as recommended in recent clinical guidelines.Citation7,Citation17 The potential underlying connection between elevated asymptomatic pancreatic enzyme concentrations and diabetes warrants further investigation in patients with type 2 diabetes.
Acknowledgments
We thank the patients and investigators who participated in the included studies. The authors also thank Carmelle V Remillard for her assistance in editing the manuscript and Maria Aisporna and Jenny Han for their assistance in data analysis.
Disclosure
This study was sponsored by Amylin Pharmaceuticals LLC. JM, KG, KS, and SC are employees and shareholders and PY is a previous employee of Amylin Pharmaceuticals LLC.
References
- Food and Drug Administration Information for healthcare professionals: exenatide (marketed as Byetta) – 8/2008 update Available from: http://www.fda.gov/Drugs/DrugSafety/PostmarketDrugSafetyInformationforPatientsandProviders/ucm124713.htm Accessed October 23, 2012
- Food and Drug Administration Information for healthcare professionals – acute pancreatitis and sitagliptin (marketed as Januvia and Janumet) Available from: http://www.fda.gov/Drugs/DrugSafety/PostmarketDrugSafetyInformationforPatientsandProviders/DrugSafetyInformationforHeathcareProfessionals/ucm183764.htm Accessed October 23, 2012
- Food and Drug Administration Information for healthcare professionals – Victoza (liraglutide [rDNA origin]) injection: REMS – risk of thyroid C-cell tumors, acute pancreatitis Available from: http://www.fda.gov/Safety/MedWatch/SafetyInformation/SafetyAlertsforHumanMedicalProducts/ucm258826.htm Accessed October 23, 2012
- Garg R Chen W Pendergrass M Acute pancreatitis in type 2 diabetes treated with exenatide or sitagliptin: a retrospective observational pharmacy claims analysis Diabetes Care 2010 33 11 2349 2354 20682680
- Gonzalez-Perez A Schlienger RG Rodríguez LA Acute pancreatitis in association with type 2 diabetes and antidiabetic drugs: a population-based cohort study Diabetes Care 2010 33 12 2580 2585 20833867
- Noel RA Braun DK Patterson RE Bloomgren GL Increased risk of acute pancreatitis and biliary disease observed in patients with type 2 diabetes: a retrospective cohort study Diabetes Care 2009 32 5 834 838 19208917
- American Gastroenterological Association AGA Institute medical position statement on acute pancreatitis Gastroenterology 2007 132 5 2019 2021 17484893
- Vantyghem MC Haye S Balduyck M Changes in serum amylase, lipase and leukocyte elastase during diabetic ketoacidosis and poorly controlled diabetes Acta Diabetol 1999 36 1–2 39 44 10436251
- Manjuck J Zein J Carpati C Astiz M Clinical significance of increased lipase levels on admission to the ICU Chest 2005 127 1 246 250 15653991
- Gullo L Lucrezio L Migliori M Benign pancreatic hyperenzy-memia or Gullo’s syndrome Adv Med Sci 2008 53 1 1 5 18650145
- World Medical Association Declaration of Helsinki: Ethical principles for medical research involving human subjects 2008 Available from: http://www.wma.net/en/30publications/10policies/b3/index.html Accessed October 23, 2012
- Semakula C Vandewalle CL Van Schravendijk CFH Abnormal circulating pancreatic enzyme activities in more than twenty-five percent of recent-onset insulin-dependent diabetic patients: association of hyperlipasemia with high-titer islet cell antibodies. Belgian Diabetes Registry Pancreas 1996 12 4 321 333 8740397
- Frossard JL Steer ML Pastor CM Acute pancreatitis Lancet 2008 371 9607 143 152 18191686
- Yadav D Lowenfels AB Trends in the epidemiology of the first attack of acute pancreatitis: a systematic review Pancreas 2006 33 4 323 330 17079934
- Martínez J Johnson CD Sánchez-Payá J Obesity is a definitive risk factor of severity and mortality in acute pancreatitis: an updated meta-analysis Pancreatology 2006 6 3 206 209 16549939
- Solanki NS Barreto SG Saccone GT Acute pancreatitis due to diabetes: the role of hyperglycaemia and insulin resistance Pancreatology 2012 12 3 234 239 22687379
- Banks PA Freeman ML Practice guidelines in acute pancreatitis Am J Gastroenterol 2006 101 10 2379 2400 17032204