Abstract
Introduction
Urinary albumin excretion (UAE) is a marker of the early phase of diabetic nephropathy. Although a low-carbohydrate diet (LCD) has been shown to effectively improve glycemic control in patients with type 2 diabetes (T2DM), its effects on UAE remain unknown.
Patients and methods
A total of 124 patients (mean age ± standard deviation, 61.6 ± 9.2 years) with T2DM were instructed to consume a moderate LCD (1734 ± 416 kcal/d; % carbohydrate:fat:protein = 38:37:19) for 12 months. We measured the levels of UAE, hemoglobin A1c, fasting plasma glucose, fasting serum insulin (IRI), and the serum lipid profiles in the patients and recorded their dosages of antidiabetic drugs during this 12-month period.
Results
Of the 124 patients, 68 were normoalbuminuric, 50 were microalbuminuric, and six were macroalbuminuric at baseline. The patients had relatively good compliance with the moderate LCD diet. After 12 months, the mean levels of hemoglobin A1c, fasting plasma glucose, IRI, homeostasis model assessment-estimated insulin resistance, and the body mass index of all participants significantly decreased (P = 0.003 for IRI and P < 0.001 for the other parameters). Among the microalbuminuric patients (n = 50), remission to normoalbuminuria was frequently achieved (52%) and the geometric mean UAE significantly decreased by 53% (95% confidence interval: 43, 62) over 12 months (P < 0.001). After patients taking an angiotensin 2 receptor blocker were excluded, the UAE significantly decreased by 41% (n = 26, 95% confidence interval: 25, 54; P < 0.001). Moreover, the reduction in UAE was significantly and positively correlated with a reduction in homeostasis model assessment-estimated insulin resistance levels (rs = 0.308; P = 0.031).
Conclusion
A moderate LCD (38% carbohydrate diet) achieved a remarkable reduction in UAE over 12 months in microalbuminuric patients with T2DM.
Introduction
Diabetic nephropathy develops in approximately 20% to 40% of patients with type 2 diabetes (T2DM) and is the leading cause of end-stage renal disease.Citation1–Citation3 Urinary albumin excretion (UAE) is a marker of early phase diabetic nephropathy and endothelial damage.Citation1–Citation5 A gradual increase in microalbuminuria results in progression to macroalbuminuria and a rapid decline in renal function. A decrease in UAE is associated with a lower risk of cardiovascular and renal events in T2DM patients.Citation1,Citation2,Citation4,Citation5 Therefore, early intervention to decrease UAE may prevent the development of microalbuminuria and the progression of existing microalbuminuria; early intervention may also result in the remission of existing albuminuria.Citation1–Citation5
The available therapeutic strategies for the management of UAE include measures to control glucose levels and hypertension and the treatment of dyslipidemia.Citation1,Citation2,Citation4,Citation5 Under high-carbohydrate conditions, intensive glycemic control using insulin and/or sulfonylureas for 6 to 8 years prevents progression from microalbuminuria to macroalbuminuria more efficiently than conventional therapy.Citation1,Citation4,Citation6 Moreover, angiotensin-converting enzyme (ACE) inhibitors and angiotensin 2 receptor blockers (ARBs) have been shown to reduce albuminuria in patients with T2DM.Citation2,Citation4,Citation7
Low-carbohydrate diets (LCDs) are more effective than high-carbohydrate diets (HCDs) at improving glycemic control among patients with T2DM.Citation8,Citation9 Because LCDs increase serum high-density lipoprotein (HDL) cholesterol level and decrease both body weight and serum triglyceride level,Citation10 LCDs are more effective in the management of cardiovascular risk factors than HCDs among patients with T2DM.Citation9–Citation11 Compared with Western populations, the proportion of energy derived from carbohydrates in East Asian populations is generally higher (approximately 60%) and the fat proportion is generally lower (approximately 25%).Citation12,Citation13 Therefore, compared with HCDs, moderate, nonketogenic LCDs (but not ketogenic LCDs) may be sufficiently effective for glycemic control in East Asian patients with T2DM. The carbohydrate-reduced diet (CARD), a moderate LCD, has been shown to effectively reduce weight and hemoglobin A1c (HbA1c) levels and to improve serum lipid profiles in Japanese patients with mild or severe T2DM.Citation14–Citation16 Recently, moderate LCDs have attracted growing interest for the management of cardiovascular risk factors in patients with T2DM, owing to the possible increases in mortality from cancer and unspecified causes that have been associated with stricter carbohydrate restriction in studies carried out over the past 20 years.Citation17,Citation18
Although LCDs have a potential role in the management of T2DM, the effects of LCDs on UAE have not yet been characterized. Therefore, we conducted the present study with the following aims: to assess the effects of a moderate LCD on changes in UAE in T2DM patients over 12 months and to elucidate the changes in cardiovascular risk factors that accompany the changes in UAE in microalbuminuric patients.
Patients and methods
Patients
Between January 2008 and July 2010, we invited all new Haimoto Clinic T2DM outpatients with HbA1c levels of 6.5% or above to participate in this study. All patients met the National Diabetes Data Group criteria for T2DM.Citation3 The patients were seen at the outpatient clinic every month. Patients with serum creatinine (Cr) levels greater than 1.5 mg/dL, severe diabetes complications (eg, proliferative retinopathy, symptomatic neuropathy, or diabetic foot syndrome), ketoacidosis, soft-drink ketosis,Citation19 cancer, severe heart failure, or liver cirrhosis, were excluded. Of the 144 eligible Japanese patients, 134 participated in the study; ten refused to take part because they did not accept carbohydrate restriction or the dietary treatment. During the study period, seven patients were voluntarily lost to follow-up and three relocated, leaving 124 for the analyses (62 men and 62 women; age: mean ± standard deviation = 62 ± 9 years, range: 34–83 years).
The protocol for the present study was identical to the protocols of previous studiesCitation14,Citation15 and as approved by the Ethical Committee of the Nagoya Tokushukai General Hospital (approval number: 07-10-102). All patients provided written informed consent, and the study was performed in accordance with the Declaration of Helsinki.
Moderate LCD
The main principle of the CARD is to eliminate carbohydrate- rich food (the list of these foods has been reported elsewhere)Citation14,Citation15 once or twice daily, at breakfast and/or dinner.Citation14 The target dietary percentage of energy derived from carbohydrates (%C) was 30%–40%. Patients with HbA1c levels < 9% were instructed to eliminate carbohydrate- rich food at dinner (less strict CARD), whereas those with levels ≥ 9% were instructed to eliminate it at both dinner and breakfast (strict CARD). All patients were forbidden to consume carbohydrate-containing foods between meals, but were permitted to eat as much protein and fat, including saturated fats, as they wished. There were no other restrictions. These protocols made it easier for our diabetic outpatients to successfully implement the diets.
The patients had not consumed LCDs before this intervention. An experienced dietician performed all of the dietary assessments and gave instructions to all of the participants three times during the first month and once per month thereafter. At the midpoint of the study period, the patients’ dietary intake was assessed based on 3-day dietary records.
The patients were requested to maintain their usual level of physical activity throughout the study. Changes in activity levels were evaluated using a questionnaire.
Clinical assessment
We measured the body mass index (BMI), blood pressure (BP), and the HbA1c level of each patient every month. As soon as the HbA1c levels of the patients were controlled, we decreased the dosage of sulfonylureas and prescribed metformin or acarbose in place of the sulfonylureas.
Fasting plasma glucose (FPG), fasting serum insulin (IRI), triglycerides, low-density lipoprotein cholesterol, HDL cholesterol, and Cr levels were obtained from venous blood samples after an overnight (12-hour) fast every 6 months.
The urinary albumin concentration was determined at baseline and after 12 months (the end of the study). For each measurement, a spot urine sample was collected after overnight fasting on two separate occasions,Citation3 and the mean UAE value of the two samples was used for statistical analysis, at the baseline and at the end of the study. Normoalbuminuria, microalbuminuria, and macroalbuminuria were defined as UAE levels < 30 mg/g Cr, 30–299 mg/g Cr, and ≥300 mg/g Cr, respectively.
Hypertension was defined as a BP ≥ 140/90 mmHg and/or the use of antihypertensive therapy at baseline. The target BP was 135/85 mmHg because at the time of study, these BP values had been shown to slow the progression of renal diseases in T2DM patients.Citation20 A low dose of olmesartan (5 or 10 mg/d), an ARB, in combination with indapamide (0.5 or 1.0 mg/d) was primarily used for the treatment of hypertension because the use of ARBs in such combinations improves renal outcomes in subjects with hypertension and T2DM.Citation21 If the patient’s BP did not reach the optimal value, other classes of antihypertensive drugs, including calcium channel blockers and/or guanabenz, were added.
The doses of all antihypertensive, lipid-lowering, or antidiabetic drugs (glibenclamide, gliclazide, glimepiride, tolbutamide, metformin, nateglinide, pioglitazone, voglibose, sitagliptin, and insulin) taken by the patients were also recorded.
Laboratory methods
Plasma glucose concentrations were determined using enzymatic methods (QUICKAUTONEO GLU-HK, Shino-Test Co, Kanagawa, Japan). Serum insulin levels were measured using the standard double antibody radioimmunoassay method (LUMIPULSE Prestoinsulin, Fujirebio Inc, Tokyo, Japan). Serum and urinary Cr and triglyceride concentrations were measured using enzymatic methods (PUREAUTOS CRE-L and PUREAUTOS TG-N, Daiichi Pure Chemicals Co, Tokyo, Japan). Serum low-density lipoprotein cholesterol and HDL cholesterol levels were assayed using direct methods (Cholestest LDL and CholestestN HD, Daiichi Pure Chemicals Co). The HbA1c levels were measured by high-performance liquid chromatography (ADAMS A1c HA-8170, Arkley Co, Kyoto, Japan). The UAE was measured using an immunoturbidimetric assay (JCA-BM8000, Nihon Denshi, Tokyo, Japan).
Statistical analysis
The parameter change (Δ) for each biomarker was defined as the level after 12 months minus the level at baseline. All the values except UAE are expressed as the mean ± standard deviation. The UAE was logarithmically transformed before analysis because of its skewed distribution and is reported as the geometric mean (95% confidence interval [CI]). The homeostasis model assessment of insulin resistance (HOMA-IR) parameter was computed as follows: ([FPG (mg/dL)] × [fasting serum insulin (μIU/mL)])/405.Citation22 The estimated glomerular filtration rate (eGFR) was computed using a previously described equation, with modifications for Japanese subjects.Citation23
The Wilcoxon test was used to assess the changes in each parameter (except for UAE) caused by the moderate LCD, comparing the baselines with the levels after 12 months for all patients. The paired t-test was used to assess changes in UAE.
The Mann–Whitney test was additionally applied to compare the baseline levels of each biomarker in the normoalbuminuric and microalbuminuric patients. Moreover, the test was used to compare macronutrients and changes in biomarker levels in patients on less strict CARD and those on strict CARD.
We computed Spearman’s correlation coefficients (rs) to examine the correlation of the UAE percentage change (Δ% UAE) with changes in cardiovascular risk factors.
P values < 0.05 were considered statistically significant. All statistical analyses were performed using SPSS (v 15.0; SPSS, Inc, Chicago, IL).
Results
Effects of the moderate LCD on glycemic control and cardiovascular risk factors
The baseline characteristics of the 124 patients are shown in . Interestingly, there were no significant differences between the analyzed patients and the 20 eligible patients excluded from study. The baseline characteristics of the excluded patients were 60.9 ± 11.2 years of age, 25.6 ± 3.8 BMI, 7.9% ± 1.1% HbA1c levels, and 3.1 ± 2.4 HOMA-IR. Of these 20 patients, 14 (70%) were normoalbuminuric, five (25%) were microalbuminuric, and one (5%) was macroalbuminuric at baseline.
Table 1 Body mass index, glycemic control, serum lipid profiles, blood pressure, and drugs at baseline and 12 months in all patients (n = 124)
Compared with the baseline values, the mean HbA1c and FPG levels and the mean BMI significantly decreased after 12 months, from 7.9% ± 1.5% to 6.7% ± 0.6%, 151 ± 48 mg/dL to 130 ± 27 mg/dL, and 24.3 ± 3.7 to 23.5 ± 3.7, respectively (P < 0.001 for all parameters) (). The levels of other cardiovascular risk factors, such as IRI, HOMA-IR, and serum HDL cholesterol significantly improved (P = 0.003, P < 0.001, P = 0.001, respectively) among the patients treated with CARD for 12 months ().
At baseline, 44 of the 124 patients (35%) had already been prescribed antidiabetic drugs by other physicians. By the end of the study, 49 (40%) patients were taking antidiabetic drugs and these patients were typically prescribed a low dose of metformin and/or glimepiride ().
The number of patients taking metformin and the dosage of metformin both increased during the study period (). After excluding patients taking metformin, the mean HbA1c and FPG levels and the mean BMI and HOMA-IR significantly decreased (n = 99, P < 0.001 for all).
The number of patients on antidiabetic drugs apart from metformin, and/or the doses of these drugs taken, consistently decreased during the 12-month study period (). The proportion of patients on sulfonylureas decreased (for glibenclamide and nateglinide) or did not change (for gliclazide and glimepiride) during the 12-month study period and the mean daily dose of sulfonylureas per person tapered off. Three patients required a low dose of insulin therapy to achieve HbA1c levels of less than 6.5%.
Physical activity levels in two female patients (one normoalbuminuric patient and one microalbuminuric patient) increased during the study period despite our instructions; their increase in physical activity was no more than 1 hour of walking per day, 7 days per week, and 40 minutes of walking per day, 3 days per week, respectively.
Baseline characteristics of the normoalbuminuric, microalbuminuric, and macroalbuminuric patients
Of the 124 patients, 68 (55%) were normoalbuminuric, 50 (40%) were microalbuminuric, and six (5%) were macroalbuminuric at baseline (). The mean baseline UAE levels in the normoalbuminuric, microalbuminuric, and macroalbuminuric patients were 11 mg/g Cr (95% CI: 3, 47), 67 mg/g Cr (56, 80), and 945 mg/g Cr (234, 3802), respectively. The HbA1c and FPG levels were significantly higher in the microalbuminuric patients than in the normoalbuminuric patients ().
Table 2 Baseline characteristics of patients by level of UAE (n = 124)
Dietary assessment
The patients showed relatively good compliance with the moderate LCD. The average total daily energy intake was 1734 ± 416 kcal/d (), and the average total daily energy intake per unit body weight was 28.4 ± 7.1 kcal/kg/d. The average daily intakes of carbohydrate, fat, and protein were 165 ± 51 g (38% ± 11% of total energy intake), 72 ± 30 g (37% ± 11% of total energy intake), and 81 ± 24 g (19% ± 4% of total energy intake), respectively (). The carbohydrates were mainly derived from rice (153 ± 97 g) and noodles (54 ± 68 g) made from wheat or buckwheat. Other carbohydrate sources included potatoes (19 ± 32 g), fruits (60 ± 80 g), bread (31 ± 35 g), confections (17 ± 24 g), and sugar (5 ± 6 g). The mean daily fiber intake was 14 ± 8 g.
Table 3 Differences of dietary assessment, BMI, HbA1c, and HOMA-IR in less strict and strict CARD patients
Patients instructed to follow the less strict CARD regimen (n = 101), whose baseline HbA1c levels were <9.0%, consumed a diet of approximately 40% carbohydrate and 36% fat; whereas patients instructed to follow the strict CARD regimen (n = 23), whose baseline HbA1c levels were ≥9.0%, consumed a diet of approximately 33% carbohydrate and 42% fat (). There were significant differences in dietary %C (P = 0.010) and dietary percentage of energy from fat (%F) (P = 0.006) between the patients on the less strict CARD regimen and the patients on the strict CARD regimen (). The strict CARD regimen was associated with significant decreases in FPG concentrations (−66 ± 50 vs −10 ± 35 mg/dL, P < 0.001), HbA1c levels (−3.6 ± 1.4 vs −0.7% ± 0.7%, P < 0.001), and HOMA-IR (−1.6 ± 2.7 vs −0.4 ± 1.3, P = 0.001), compared with the less strict CARD regimen ().
Changes in UAE, eGFR, and other cardiovascular risk factors in the normoalbuminuric patients
In the group of patients with normoalbuminuria, two patients (3%) progressed to microalbuminuria over the course of 1 year (). One patient was an 83-year-old female with an 84-month history of diabetes, microhematuria, hypertension, and hyperlipidemia. The other patient was a newly diagnosed 51-year-old female with hypertension, hyperlipidemia, and rheumatoid arthritis, who was treated with prednisolone and methotrexate.
Figure 1 Individual changes in UAE (mg/g Cr) in (A) normoalbuminuric patients (n = 68), (B) microalbuminuric patients (n = 50), and (C) macroalbuminuric patients (n = 6), over 12 months. Dot lines show borderlines between normoalbuminuria and microalbuminuria (30 mg/g Cr) in (A and B), and between microalbuminuria and macroalbuminuria (300 mg/g Cr) in (B and C).
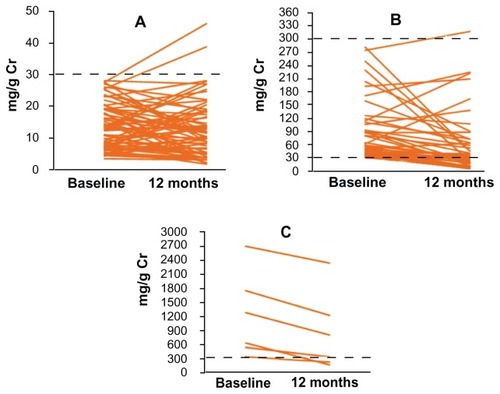
The UAE significantly decreased by 20% (95% CI: 4, 33) during the 1-year study period (P = 0.021) (). The values for BMI, FPG, HbA1c, IRI, HOMA-IR, serum HDL cholesterol, and systolic and diastolic BP, significantly decreased after 12 months in the normoalbuminuric patients (). The eGFR did not materially decrease.
Table 4 Changes in UAE, BMI, glycemic control, fasting serum insulin, serum lipid profiles, blood pressure, and eGFR over 12 months
Changes in UAE and other cardiovascular risk factors in the microalbuminuric and macroalbuminuric patients
Among the 50 patients with microalbuminuria, 26 (52%) underwent remission to normoalbuminuria during the follow- up period (). In contrast, one female patient (2%) progressed to macroalbuminuria. This patient was 68 years old and had hypertension, hyperlipidemia, and Wegener granulomatosis disease, and was treated with prednisolone.
The UAE significantly decreased in microalbuminuric by 53% (95% CI: 43, 62) during the 12-month study period (P < 0.001) (); the UAE decreased most (by 64% [95% CI: 51, 74]) in the hypertensive patients receiving olmesartan (n = 24). When patients taking olmesartan were excluded from consideration, the UAE still significantly decreased by 41% (n = 26, 95% CI: 25, 54, P < 0.001) and when patients taking either olmesartan or metformin were excluded, UAE significantly decreased by 40% (n = 24, 95% CI: 22, 54, P = 0.001). No significant difference was found between patients following less strict CARD (n = 35) (53%, 95% CI: 47, 64) and the patients following strict CARD (n = 15) (55%, 95% CI: 46, 68) (P = 0.89).
Additionally, in the macroalbuminuric patients, the UAE was significantly reduced by 41% (95% CI: 18, 57) over the 1-year period (P = 0.025) (). Two of the six patients achieved remission to microalbuminuria ().
In the microalbuminuric patients, the values for BMI, FPG, HbA1c, IRI, HOMA-IR, serum HDL cholesterol, and systolic BP significantly decreased (). The eGFR did not significantly decrease.
Correlation of Δ% UAE with changes in cardiovascular risk factors in microalbuminuric patients
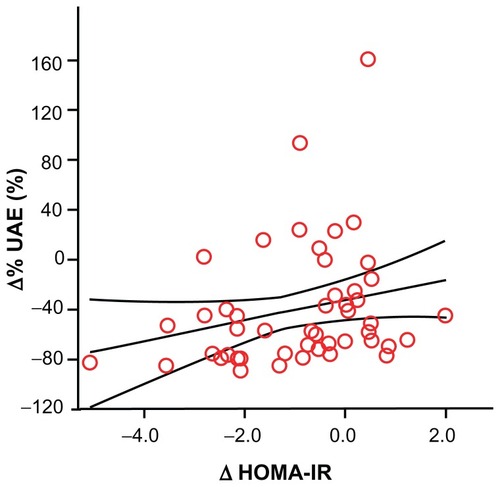
The Δ% UAE was significantly and positively correlated with Δ HOMA-IR levels (rs = 0.308; P = 0.031) () but not correlated with changes in the other clinical variables. Moreover, the Δ% UAE was significantly and inversely correlated with baseline HOMA-IR levels (rs = −0.367; P = 0.009) and IRI levels (rs = −0.349; P = 0.013). The Δ HOMA-IR levels were strongly and inversely correlated with the baseline HOMA-IR levels (rs = −0.687; P < 0.001).
Figure 2 Correlation of Δ% UAE with Δ HOMA-IR in the 50 microalbuminuric patients.
Abbreviations: Δ% UAE, percentage change in urinary albumin secretion; HOMA-IR, homeostasis model of assessment of insulin resistance.
Discussion
In this study, remission (52%) and a remarkable reduction (53%) in UAE were achieved with the consumption of a moderate LCD for 12 months by microalbuminuric outpatients with T2DM. Even when patients taking olmesartan were excluded from consideration, the UAE was significantly decreased by 41%. This reduction in UAE was significantly and positively correlated with a reduction in HOMA-IR levels.
These findings must be interpreted with caution because of the relatively small number of patients and the lack of control subjects treated with an HCD. Thus, findings could result in part from improved lifestyle and compliance to medication protocols. However, the analysis that excluded patients taking metformin during the study period did not materially change the findings and only two patients increased their physical activity levels.
“CARD” is defined as a moderate LCD (26% to 45% carbohydrate), as opposed to a LCD (<26% carbohydrate).Citation24 In this study, one principle of CARD was to adopt the proper method of carbohydrate restriction according to a patient’s baseline HbA1c level.Citation14,Citation15 This strategy resulted in different compositions of dietary macronutrients in the less strict CARD versus the strict CARD, with lower %C (33% carbohydrate) and higher %F (42% fat) in the strict CARD, compared with the less strict CARD (40% carbohydrate and 36% fat). The strict CARD regimen was associated with remarkable decreases in HbA1c and HOMA-IR levels when compared with the less strict CARD regimen. Nevertheless, both CARD regimens achieved an HbA1c level of ≤7.0% over 12 months despite different baseline HbA1c levels; the strict and less strict CARDs improved glycemic control among patients with severe T2DM and those with mild T2DM, respectively.
Along with improvements in cardiovascular risk factors (primarily BMI, glycemic control, and HOMA-IR), a remarkable reduction in UAE was achieved with the consumption of CARD in microalbuminuric patients over 12 months. Our results suggest that moderate LCDs have the ability to reduce microalbuminuria; however, the strict CARD and less strict CARD had a similar level of effect on reducing UAE. To address this issue, further studies are needed to investigate the difference in patients’ baseline %C (typically, a conventional calorie-restricted diet) and their %C in the strict or the less strict CARD.
Insulin resistance is a critical factor in the development of T2DM and is closely related to hypertension, atherogenic dyslipidemia, and obesity, which often manifest concomitantly in the clinical context.Citation25 The CARD achieved a significant reduction in HOMA-IR levels by 12 months in microalbuminuric patients and this reduction in insulin resistance may be associated with a reduction in UAE. Several cross-sectional studies have demonstrated that an increased UAE is related to higher insulin resistance as estimated by HOMA-IR levels.Citation26,Citation27 We demonstrated that the Δ% UAE was positively correlated with Δ HOMA-IR levels, higher HOMA-IR levels at baseline were associated with greater reductions in UAE, and the ΔHOMA-IR levels were inversely correlated with baseline HOMA-IR levels in the microalbuminuric patients treated with CARD. In association with the marked decrease in HOMA-IR levels, UAE decreased more among microalbuminuric patients with higher HOMA-IR at baseline, probably because there is greater room for improvement in HOMA-IR levels over a 12-month period.
High-dose ARBs can reduce the level of microalbuminuria by 30%–48% over a period of 6–24 months.Citation4,Citation7,Citation28 Many studies have shown that the reduction in microalbuminuria caused by ARBs in patients with T2DM under high-carbohydrate conditions is independent of the BP-lowering effects of ARBs.Citation4,Citation7 In the current study, a moderate LCD without the use of ARBs achieved a 41% reduction in UAE over a 12-month period among the microalbuminuric patients, which is equivalent to the efficacy of high-dose ARBs in T2DM patients under high-carbohydrate conditions. Moreover, the moderate LCD in combination with low-dose ARBs (olmesartan) reduced UAE by 64%. Our results, together with the effects of high-dose ARBs on microalbuminuria,Citation4,Citation7,Citation28 suggest that the combination therapy of moderate LCDs with the use of a higher dose of ARBs may have great potential for further reducing microalbuminuria.
In summary, a 53% reduction in UAE was achieved with the consumption of a moderate LCD (38% carbohydrate) over a 12-month period in microalbuminuric patients with T2DM. When patients taking olmesartan were excluded from consideration, the UAE was decreased by 41%. Moreover, 52% of these patients were in remission to normoalbuminuria at 12 months. The Δ% UAE was positively correlated with Δ HOMA-IR in patients with microalbuminuria. These data suggest that moderate LCDs have the ability to reduce UAE in patients with T2DM. Our findings warrant a long-term and large-scale interventional study to confirm the effects of LCDs on reducing albuminuria.
Authors’ contributions
HH and TS designed the study and participated in data collection. HH, KW, and HU performed the statistical analysis and interpreted the data. HH wrote the manuscript.
Disclosures
The authors declare no conflicts of interest in this work.
References
- Bilous R Microvascular disease: what does the UKPDS tell us about diabetic nephropathy? Diabet Med 2008 25 Suppl 2 25 29 18717975
- Gross JL de Azevedo MJ Silveiro SP Canani LH Caramori ML Zelmanovitz T Diabetic nephropathy: diagnosis, prevention, and treatment Diabetes Care 2005 28 1 164 176 15616252
- American Diabetes Association Standards of medical care in diabetes – 2008 Diabetes Care 2008 31 Suppl 1 S12 S54 18165335
- Basi S Fesler P Mimran A Lewis JB Microalbuminuria in type 2 diabetes and hypertension: a marker, treatment target, or innocent bystander? Diabetes Care 2008 31 Suppl 2 S194 S201 18227485
- Araki S Haneda M Koya D Kashiwagi A Uzu T Kikkawa R Clinical impact of reducing microalbuminuria in patients with type 2 diabetes mellitus Diabetes Res Clin Pract 2008 82 Suppl 1 S54 S58 18947896
- Gaede P Tarnow L Vedel P Parving HH Pedersen O Remission to normoalbuminuria during multifactorial treatment preserves kidney function in patients with type 2 diabetes and microalbuminuria Nephrol Dial Transplant 2004 19 11 2784 2788 15328385
- Casas JP Chua W Loukogeorgakis S Effect of inhibitors of the renin-angiotensin system and other antihypertensive drugs on renal outcomes: systematic review and meta-analysis Lancet 2005 366 9502 2026 2033 16338452
- Westman EC Yancy WSJr Mavropoulos JC Marquart M McDuffie JR The effect of a low-carbohydrate, ketogenic diet versus a low-glycemic index diet on glycemic control in type 2 diabetes mellitus Nutr Metab (Lond) 2008 5 36 19099589
- Accurso A Bernstein RK Dahlqvist A Dietary carbohydrate restriction in type 2 diabetes mellitus and metabolic syndrome: time for a critical appraisal Nutr Metab (Lond) 2008 5 9 18397522
- Katan MB Alternatives to low-fat diets Am J Clin Nutr 2006 83 5 989 990 16685038
- Volek JS Phinney SD Forsythe CE Carbohydrate restriction has a more favorable impact on the metabolic syndrome than a low fat diet Lipids 2009 44 4 297 309 19082851
- Tada N Maruyama C Koba S Japanese dietary lifestyle and cardiovascular disease J Atheroscler Thromb 2011 18 9 723 734 21685707
- Oza-Frank R Cheng YJ Narayan KM Gregg EW Trends in nutrient intake among adults with diabetes in the United States: 1988–2004 J Am Diet Assoc 2009 109 7 1173 1178 19559133
- Haimoto H Iwata M Wakai K Umegaki H Long-term effects of a diet loosely restricting carbohydrates on HbA1c levels, BMI and tapering of sulfonylureas in type 2 diabetes: a 2-year follow-up study Diabetes Res Clin Pract 2008 79 2 350 356 17980451
- Haimoto H Sasakabe T Wakai K Umegaki H Effects of a low-carbohydrate diet on glycemic control in outpatients with severe type 2 diabetes Nutr Metab (Lond) 2009 6 21 19419563
- Sasakabe T Haimoto H Umegaki H Wakai K Effects of a moderate low-carbohydrate diet on preferential abdominal fat loss and cardiovascular risk factors in patients with type 2 diabetes Diabetes Metab Syndr Obes 2011 4 167 174 21779148
- Hu FB Are refined carbohydrates worse than saturated fat? Am J Clin Nutr 2010 91 6 1541 1542 20410095
- Fung TT van Dam RM Hankinson SE Stampfer M Willett WC Hu FB Low-carbohydrate diets and all-cause and cause-specific mortality: two cohort studies Ann Intern Med 2010 153 5 289 298 20820038
- Tanaka K Moriya T Kanamori A Yajima Y Analysis and a long-term follow up of ketosis-onset Japanese NIDDM patients Diabetes Res Clin Pract 1999 44 2 137 146 10414933
- Weidmann P Schneider M Böhlen L Therapeutic efficacy of different antihypertensive drugs in human diabetic nephropathy: an updated meta-analysis Nephrol Dial Transplant 1995 10 Suppl 9 S39 S45
- Ruilope LM Segura J Kidney protection: a key target in the management of patients with diabetes J Hypertens Suppl 2009 27 1 S15 S18 19483503
- Muniyappa R Lee S Chen H Quon MJ Current approaches for assessing insulin sensitivity and resistance in vivo: advantages, limitations, and appropriate usage Am J Physiol Endocrinol Metab 2008 294 1 E15 E26 17957034
- Matsuo S Imai E Horio M for Collaborators developing the Japanese equation for estimated GFR Revised equations for estimated GFR from serum creatinine in Japan Am J Kidney Dis 2009 53 6 982 992 19339088
- Feinman RD Fad diets in the treatment of diabetes Curr Diab Rep 2011 11 2 128 135 21234818
- Chapman MJ Sposito AC Hypertension and dyslipidaemia in obesity and insulin resistance: pathophysiology, impact on atherosclerotic disease and pharmacotherapy Pharmacol Ther 2008 117 3 354 373 18215759
- Esteghamati A Ashraf H Nakhjavani M Najafian B Hamidi S Abbasi M Insulin resistance is an independent correlate of increased urine albumin excretion: a cross-sectional study in Iranian Type 2 diabetic patients Diabet Med 2009 26 2 177 181 19236623
- De Cosmo S Minenna A Ludovico O Increased urinary albumin excretion, insulin resistance, and related cardiovascular risk factors in patients with type 2 diabetes: evidence of a sex-specific association Diabetes Care 2005 28 4 910 915 15793194
- Ikeda H Hamamoto Y Honjo S Nabe K Wada Y Koshiyama H Olmesartan reduced microalbuminuria in Japanese subjects with type 2 diabetes Diabetes Res Clin Pract 2009 83 1 117 118 19062123