Abstract
Background
The purpose of this study was to characterize the burden of illness among adult subjects with painful diabetic peripheral neuropathy (pDPN) seeking treatment in the US.
Methods
This observational study recruited 112 subjects with pDPN during routine visits from general practitioner and specialist sites. Subjects completed a one-time questionnaire, which included demographics, symptom duration, health care resource use, out-of-pocket costs, employment status, and validated measures that assessed pain, functioning, sleep, anxiety and depression, health status, and productivity. Investigators completed a case report form based on a 6-month retrospective chart review to capture clinical information, pDPN-related treatments, and other pDPN-related health care resource use over the past 6 months. Annualized costs were extrapolated based on reported 6-month health care resource use.
Results
The mean age of the subjects was 61.1 years, 52.7% were female, and 17.9% were in paid employment. The most common comorbid conditions were sleep disturbance/insomnia (43.8%), depressive symptoms (41.1%), and anxiety (35.7%). The mean pain severity score was 5.2 (0–10 scale), and 79.5% reported moderate or severe pain. The mean pain interference with function score was 5.0 (0–10 scale) overall, with 2.0 among mild, 5.1 among moderate, and 7.0 among severe. The mean Medical Outcomes Study sleep problems index score was 48.5 (0–100 scale). The mean health state utility score was 0.61. Among subjects employed for pay, mean overall work impairment was 43.6%. Across all subjects, mean overall activity impairment was 52.3%. In total, 81.3% were prescribed at least one medication for their pDPN; 50.9% reported taking at least one nonprescription medication. Adjusted mean annualized total direct and indirect costs per subject were $4841 and $9730, respectively. Outcomes related to pain interference with function, sleep, health status, activity impairment, prescription medication use, and direct and indirect costs were significantly worse among subjects with more severe pain (P < 0.0020).
Conclusion
Subjects with pDPN exhibited high pain levels, which were associated with poor sleep, function, and productivity. Health care resource utilization in pDPN was prevalent and costs increased with greater pain severity. The burden of pDPN was greater among subjects with greater pain severity.
Introduction
Painful diabetic peripheral neuropathy (pDPN) is the most common of the diabetic neuropathies, a family of nerve disorders caused by diabetes mellitus, and is also known as distal symmetric sensorimotor polyneuropathy.Citation1 In the US, an estimated 15% to 30% of people with diabetes have pDPN.Citation2,Citation3 Further, it is generally believed that pDPN will continue to increase due to aging of the population and higher survival rates from diseases that are associated with neuropathic pain, including diabetes.Citation4 Although there are characteristic symptoms associated with neuropathic pain across all subtypes, the most frequent location of pDPN is the lower extremities, particularly in the leg or foot.Citation5 The most frequent pain pattern reported by patients with pDPN is persistent pain with slight fluctuations. Patients with pDPNs also frequently report that their pain has a radiating quality.Citation6 Previous research suggests that patients with pDPN have higher rates of anxiety disorders and lower rates of optimal sleep compared with other types of neuropathic pain, such as post-herpetic neuropathy.Citation6 pDPN can be severe, chronic, and disabling, leading to substantial functional, psychological, and social limitations, particularly with increasing pDPN severity.Citation1,Citation5,Citation7–Citation9
In the US, several studies have evaluated the impact of pDPN on patient-reported outcomes. Previous US studies have shown that pDPN is associated with substantial humanistic burden based on the following validated patient-reported outcome measures: Brief Pain Inventory-Short Form (BPI-SF), Hospital Anxiety and Depression Scale (HADS), Medical Outcomes Study (MOS) Sleep Scale, 12-item Short-Form Health Survey (SF-12v2), and EuroQol 5-dimensions, 3-levels (EQ-5D-3 L).Citation1,Citation10 The negative impact of pDPN on patient-reported outcomes is greater in subjects with more severe pain.Citation1,Citation10 The patient-reported burden of pDPN by pain severity has also been demonstrated in a number of European studies.Citation5,Citation7,Citation9 One European study of pDPN reported substantial pain severity and pain-related interference.Citation7
Several US studies have also assessed the health care resource utilization and costs associated with pDPN. Compared with controls, patients with pDPNs have a higher rate of health care resource utilization and costs associated with diagnostic procedures, prescriptions, and interventional treatments.Citation11,Citation12 In one study, patients with pDPN had consistently higher health care resource utilization and costs across categories of care, including hospital admissions.Citation12 The same study reported that excess costs associated with pDPN were approximately $6000 annually.Citation12 Another study demonstrated that pDPN-related pain severity was significantly associated with higher rates of absenteeism and presenteeism, leading to higher indirect costs.Citation10
The objective of this study was to characterize recent trends in subjects with pDPN with respect to the following: sociodemographic and clinical characteristics; the impact of pDPN on anxiety, depression, sleep, and health status; current treatment patterns and health care resource utilization; costs to payers and subjects; and indirect costs due to lost productivity. This study adds to the published literature by combining clinical assessment, patient self-reporting on disease impact, health care resource utilization, and productivity loss in one holistic assessment of the patients with pDPN. All analyses have been performed by pain severity.
Materials and methods
This cross-sectional, observational study recruited a convenience sample of subjects with pDPN between September 30, 2011 and December 9, 2011 from 20 community-based physician practices across the US, including seven general practitioners/primary care physicians, five neurologists, three pain specialists, three endocrinologists, as well as one podiatrist and one rheumatologist. The study was approved by a central institutional review board (Concordia Clinical Research, Cedar Knolls, NJ, USA).
Sites were asked to identify eligible subjects with pDPN as they presented for routine office visits. Adult subjects (>18 years) diagnosed with pDPN, defined as subjects with diabetic distal symmetrical sensorimotor polyneuropathy (peripheral neuropathy), at least 6 months earlier who also were managed at the physician’s practice for at least 6 months were eligible for enrollment. Subjects were also required to read and understand English and must have experienced symptoms due to neuropathy for at least 3 months prior to enrollment. Subjects were not eligible for enrollment if: they had participated in an investigational drug study in the 6 months prior to enrollment; had a serious or unstable medical or psychological condition that, in the opinion of the physician, would compromise participation in the study; or had a concomitant illness unrelated to pDPN that may confound the assessment of pDPN (ie, fracture, lupus, rheumatoid arthritis).
Subjects were asked to complete a self-administered questionnaire, which included questions related to demographics, symptom duration, nonprescription treatments, out-of-pocket costs (in the past 4 weeks) related to pDPN pain treatments, employment status, and productivity, as well as the following validated measures: the SF-12v2, one-week recall,Citation13 the EQ-5D-3 L,Citation14 the BPI-SF,Citation15 the MOS Sleep Scale,Citation16 the HADS,Citation17,Citation18 and the Work Productivity and Activity Impairment-Specific Health Problem (WPAI-SHP) (customized to pDPN).Citation19
The participating physician or site coordinator conducted a 6-month retrospective chart review to collect time since pDPN diagnosis, duration of diabetes (underlying condition), number of comorbid conditions, pDPN-related treatments, and other pDPN-related health care resource utilization over the previous 6 months.
The BPI-SF includes four items measuring pain severity (at its worst, at its least, on average, and currently) and seven items measuring how pain interferes with activities of daily living and functioning (general activity, mood, walking ability, normal work, relationships with other people, sleep, and enjoyment of life).Citation20 All items are assessed on 11-point numeric rating scales ranging from 0 (no pain) to 10 (pain as bad as you can imagine). The BPI Pain Severity Index is calculated by taking the average of the worst, least, average, and current pain ratings. The BPI Pain Interference is calculated by averaging the mean of the seven interference items, with higher scores indicating greater interference with activities of daily living.
The HADS is designed to detect the presence and severity of anxiety or depression and has been used extensively in a variety of subject populations.Citation17,Citation18 The HADS includes 14 multiple-choice questions that are combined to form two subscales (anxiety and depression). Each subscale is based on the responses to seven questions. The overall score for each subscale ranges from 0 to 21, with higher scores representing poorer emotional well-being. Scores of 0–7 on either subscale represent “normal”, 8–10 represents “mild”, 11–14 represents “moderate”, and 15–21 represents “severe” levels of anxiety and depression.
The SF-12v2 (acute version: one-week recall) contains 12 items that assess eight domains, including physical functioning, role limitations due to physical health, bodily pain, general health perceptions, vitality, social functioning, role limitations due to emotional problems, and mental health. A physical and mental component score is also calculated. Higher scores on the SF-12 indicate better outcomes.Citation21
The EQ-5D-3 L is a general health status and utility measure that includes five items assessing subjects’ overall functioning and well-being with respect to mobility, selfcare, performance of usual activities, pain or discomfort, and anxiety or depression.Citation14 Subjects indicate their health state by selecting the most appropriate response (ie, no problems, some problems, or extreme problems) for each statement within each dimension. US health state valuation scores range from –0.11 to 1.00, with a higher score indicating better health status.
The MOS Sleep Scale has been validated for use in patients with pDPN.Citation22 This scale includes 12 questions that are combined to form six subscales measuring sleep disturbance, snoring, awakening short of breath or with a headache, sleep adequacy, somnolence, and sleep quantity.Citation16 In addition, nine of the 12 items also can be summarized into a nine-item overall index. With the exception of sleep quantity, the sub-scales and the nine-item Sleep Problems Index scores range from 0 to 100. The sleep quantity scale is the mean number of hours of sleep per night reported over the past week. Higher scores indicate worse outcomes for all domains except for Sleep Adequacy and Sleep Quantity scales, where higher scores indicate better outcomes.
The WPAI-SHP is a six-item measure used to assess the amount of absenteeism, presenteeism, and daily activity impairment attributable to a specific health problem quantitatively,Citation19 and the specific health problem in this study was pDPN. Scores on the WPAI-SHP are multiplied by 100 and expressed as impairment percentages, with higher values indicating greater impairment and less productivity (ie, worse outcomes).Citation23
Direct medical costs to payers related to pDPN included health care provider visits for pDPN, including visits to physicians and nonphysician health care providers, prescription medications for pDPN, portable transcutaneous electrical nerve stimulation unit and supplies, office-based tests and procedures for pDPN, emergency room visits for pDPN, hospital outpatient visits for pDPN, and hospitalizations for pDPN. Direct costs to subjects (out-of-pocket costs) related to pDPN included medical care, child care, help with house and/or yard work, and help with activities of daily living. Indirect costs related to pDPN included overall work impairment, disability, unemployment, early retirement, and reduced work schedule.
Costing algorithms were developed to assign a “per unit” cost (2012 US$) to all health care resource utilization, excluding subject-reported out-of-pocket expenses, which were used as reported and did not need to be monetized. Unit costs for office visits, as well as office-based procedures and tests, were based on the fiscal year 2012 Medicare Physician Fee Schedule. Unit costs for hospital outpatient visits and emergency room visits were based again on the fiscal year 2012 Medicare Hospital Outpatient Prospective Payment System. Information on discharge diagnosis, procedures performed, and length of stay were used to map hospitalizations resulting in admission to appropriate Diagnosis Related Groups. Unit costs for hospitalizations were based on the fiscal year 2012 Medicare Hospital Inpatient Prospective Payment System. The 2012 Redbook was used to identify the unit cost of prescription generic and brand medications. To calculate the prescribed medication costs, the average wholesale price minus 18% plus a dispensing fee was used for brand medications, and average wholesale price minus 47% plus a dispensing fee was used for generic medications.Citation24 For generics, the median price was selected if multiple price options were available for the strength indicated and bottle/package size needed. If the median price was between two options, the lower cost option was selected. Unit cost for use of a portable transcutaneous electrical nerve stimulation unit was based on the 2012 Medicare reimbursement schedule for Durable Medical Equipment, Prosthetics, Orthotics, and Supplies.
The six-month and one-year cost of pDPN per subject was calculated and summarized as the direct medical cost to payers, direct costs to subjects, and indirect cost to society. In order to annualize direct medical costs to payers, the units of health care resource utilization used over the 6 months were multiplied by two (excluding transcutaneous electrical nerve stimulation units), and the annualized health care resource utilization was multiplied by the average cost per unit of the health care resource utilization. Direct out-of-pocket costs of pDPN to the subject were based on the 4-week data reported on the subject questionnaire. These costs were multiplied by 6.5 and 13 to calculate the 6-month (26-week) and annualized (52-week) costs of pDPN per subject, respectively.
Indirect costs associated with lost work-related productivity for those currently employed were calculated using the average hourly wage values obtained through the Bureau of Labor StatisticsCitation25 multiplied by the overall work impairment score from the WPAI:pDPN.Citation26 Indirect costs to society as a result of lost productivity for subjects who were unemployed, retired early, or reduced their work schedule due to pDPN were calculated by multiplying the average hourly wage by time since change in employment status due to pDPN (up to 26 weeks for 6-month costs and up to 52 weeks for annualized costs). Indirect costs to society as a result of lost productivity for subjects disabled due to pDPN were calculated using the average hourly wage plus the average monthly disability payment from the Social Security Administration applied to the time since subjects were disabled due to pDPN.Citation27
Statistical analyses
Summary statistics (means and standard deviations [SD] for continuous variables and frequency distributions for categorical variables) were used to describe the sample. Scores on the BPI Pain Severity were used to classify average pain severity as follows: 0–3 represents mild pain, 4–6 represents moderate pain, and 7–10 represents severe pain.Citation28,Citation29 To evaluate the association between pain severity (categorized as mild, moderate, or severe) and other outcomes, we used Kruskal–Wallis for continuous outcomes and Chi-square or Fisher’s Exact tests for categorical outcomes. Statistical significance was evaluated at the 0.05 level.
The association between pain severity (mild, moderate, severe) and costs of neuropathic pain was examined using multiple (adjusted) linear regression. For the adjusted model, stepwise regression was used with the following pool of covariates: age, gender, race, ethnicity, pain severity, employment status (employed for pay/disabled/retired/unemployed/other), ability to walk, insurance coverage (yes/no), pDPN prescription coverage (yes/no), worker’s compensation, time since diagnosis, and comorbid conditions. All analyses were performed using PC-SAS version 9.1.3 (SAS Institute, Cary, NC).
Results
One hundred and twelve subjects with pDPN were enrolled in the study from 114 who were formally screened. Two potential subjects with pDPN failed screening, because they had more than one type of neuropathic pain.
Demographic and clinical characteristics
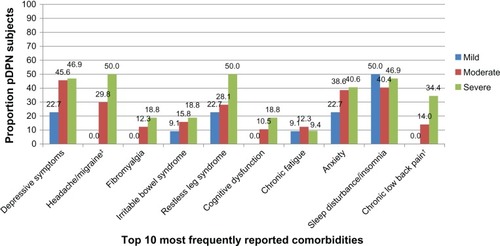
presents the demographic and clinical characteristics of the sample overall and by pain severity. The mean age of the 112 subjects with pDPN enrolled in this cross-sectional, observational study was 61.1 ± 12.1 years overall (mild, 66.9 ± 10.78 years; moderate, 60.6 ± 12.25 years; severe, 57.8 ± 11.84; P = 0.0231, ). There were 53 (47.3%) males and 59 (52.7%) females (). The mean pain severity score was 5.2 (0–10 scale) overall (mild 1.9 ± 1.19; moderate 5.0 ± 0.92; severe 7.8 ± 1.08), and subjects were distributed across pain severity levels as follows: 19.6% mild, 50.9% moderate, and 28.6% severe. One subject did not respond to all required items needed to calculate a mean BPI pain severity score, so the subject’s pain severity score is missing. Subjects had an average of 3.1 ± 2.2 comorbidities (). The most common conditions included sleep disturbance/insomnia (43.8%), depressive symptoms (41.1%), and anxiety (35.7%, ).
Table 1 Demographic and clinical characteristics, overall and by average pain severity
Figure 1 Comorbidities among pDPN subjects, by average pain severity.*
Ninety-one (81.3%) of the 112 subjects were diagnosed with diabetes more than 2 years prior to the date of consent, and another 15 (13.4%) were diagnosed with diabetes one year prior to the date of consent (). The overall mean time since pDPN diagnosis was 70.9 ± 65.3 months (), and the mean difference in time from first experiencing symptoms and diagnosis of pDPN was 17 months. On average, mean time since pDPN diagnosis was 81.8 ± 90.8, 68.5 ± 51.0, and 69.2 ± 69.3 months for subjects with mild, moderate, and severe pain severity scores, respectively (). Twenty (17.9%) of the 112 subjects reported being employed for pay (). Among those not employed for pay, most were either retired (36.6%) or disabled (33.9%, ). Thirteen (11.6%) subjects reported being disabled due to their pDPN (data not shown).
Health-related quality of life
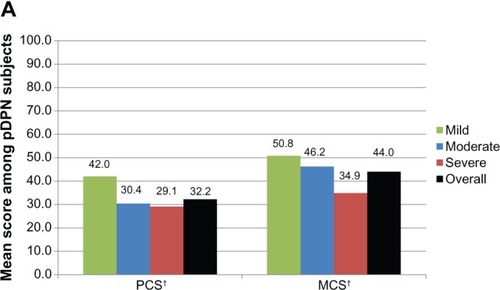
The mean Physical Component Summary and Mental Component Summary scores were 32.2 ± 10.1 and 44.0 ± 12.1, respectively (). Across all SF-12 domains, including both summary scores, higher pain severity was associated with lower health status (P < 0.0007, ). Using the EQ-5D, the mean health utility score overall was 0.61 ± 0.22 (). Health utility scores also decreased significantly as pain severity increased (mild, 0.80 ± 0.13; moderate, 0.66 ± 0.17; and severe, 0.39 ± 0.18; P < 0.0001, ).
Table 2 Subject-reported outcomes, overall and by average pain severity
Figure 2A SF-12 physical and mental component summary scores, overall and by average pain severity.*
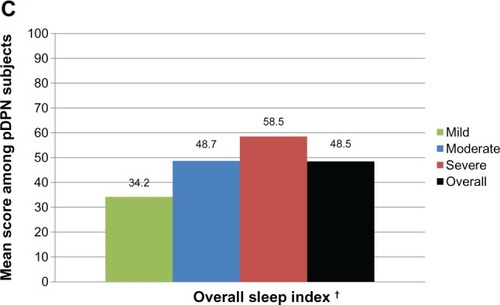
The mean BPI-SF pain interference score was 5.0 ± 2.6, and mean scores increased significantly as pain severity increased (mild, 2.0 ± 1.8; moderate, 5.1 ± 1.9; and severe, 7.0 ± 1.9; P < 0.0001, ). The mean MOS Sleep Overall Index score was 48.5 ± 19.6, and worsened significantly as pain severity increased (mild, 34.2 ± 15.0; moderate, 48.7 ± 19.7; and severe, 58.5 ± 16.1; P < 0.0001, ). Scores on the HADS Anxiety and Depression scales indicate that over half (57.2%) of subjects with pDPN experienced some level of anxiety, and close to half (43.8%) experienced some level of depression ().
Figure 2B Pain interference with function, overall and by average pain severity.*
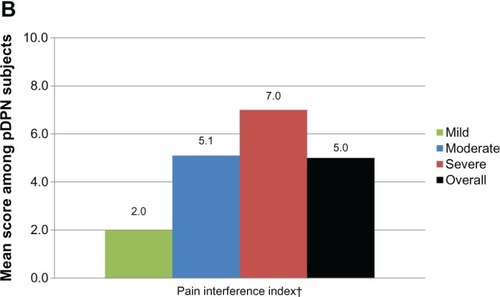
Figure 2C MOS-SS overall sleep index, overall and by average pain severity.*
Health resource use
Ninety-one (81.3%) of the subjects were prescribed at least one medication for the treatment of pDPN (). As pain severity increased, the proportion of subjects prescribed one or more medications increased significantly (P = 0.0004), with 96.9% of subjects in the severe pain group prescribed at least one prescription medication for pDPN. Overall, subjects were prescribed 1.6 ± 1.3 medications; across pain severity groups, the mean number of prescription medications per subject increased (mild 0.9 ± 1.0; moderate: 1.5 ± 1.1; severe, 2.2 ± 1.4; P = 0.0004, ). The top four medication classes prescribed were antiepileptics (55.4%), weak short-acting opioids (17.0%), strong short-acting opioids (14.3%), and nonsteroidal anti-inflammatory drugs (14.3%, ). Among subjects prescribed antiepileptics, the most commonly prescribed medications were gabapentin (61.3%) and pregabalin (38.7%, data not shown). Among subjects prescribed weak short-acting opioids, all (100%) were prescribed hydrocodone-acetaminophen (data not shown). Among subjects prescribed strong short-acting opioids, the most commonly prescribed medications were oxycodone-acetaminophen (37.5%) and oxycodone hydrochloride immediate-release (31.3%, data not shown). Among subjects prescribed nonsteroidal anti-inflammatory drugs, the most commonly prescribed medications were ibuprofen (56.3%) and meloxicam (25.0%, data not shown). Thirteen (11.6%) subjects were prescribed a transcutaneous electrical nerve stimulation home device for neuropathic pain (data not shown).
Figure 3A Proportion of pDPN subjects taking prescription medications for pDPN, overall and by average pain severity.*
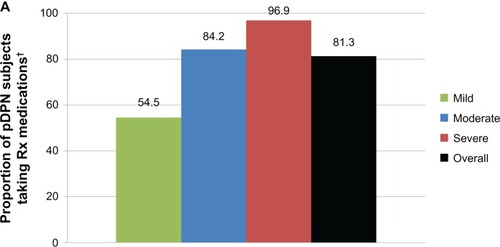
Figure 3B Use of prescription treatments for pDPN, overall.*
Abbreviations: AEDs, antiepileptics; SAO, strong-acting opioids; NSAIDs, nonsteroidal anti-inflammatory drugs; LAO, long-acting opioids; SNRIs, Serotonin–norepinephrine reuptake inhibitors; TCAs, tricyclic antidepressants; SSRI, selective serotonin re-uptake inhibitors.
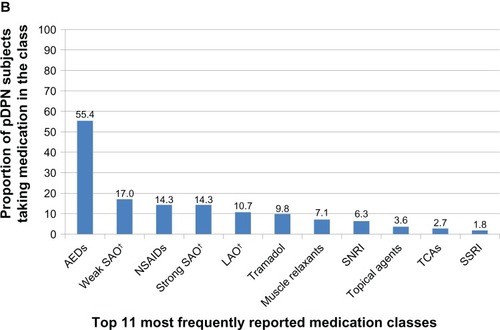
Table 3 Resource utilization for painful diabetic peripheral neuropathy, overall and by average pain severity
In addition to prescription medications, 57 (50.9%) subjects reported taking nonprescription medications in the 4 weeks prior to enrolment; the top three most frequently used nonprescription medications in the pDPN cohort were ibuprofen (25.0%), vitamins (17.9%), and acetaminophen (12.5%, ). Overall, subjects reported taking 0.9 ± 1.2 nonprescription medications over a 4-week period; across the pain severity groups, the mean number of nonprescription medications per subject increased (mild, 0.7 ± 0.9; moderate, 1.0 ± 1.4; severe, 0.9 ± 1.1) although the difference was not statistically significant ().
Table 4 Subject-reported nonprescription medications used to treat painful diabetic peripheral neuropathy, overall and by average pain severity
The mean number of pDPN-related physician office visits per subject in the 6 months prior to consent was 2.5 ± 1.9 (). The number of physician office visits increased as pain severity increased (mild, 1.7 ± 1.4; moderate, 2.4 ± 1.6; severe, 3.3 ± 2.3; P = 0.0171, ). The mean number of pDPN-related other (nonphysician) health care provider visits per subject in the 6 months prior to consent of 0.1 ± 0.2 did not differ significantly by pain severity (). The mean number of total office-based tests and procedures performed in the 6 months prior to consent was 0.8 ± 1.9, with fewer tests and procedures performed on subjects with more severe pain (mild, 1.0 ± 1.5; moderate, 0.8 ± 2.1; severe, 0.5 ± 1.8; P = 0.0143, ). There was one pDPN-related emergency room visit in the 6 months prior to consent; no hospitalizations or hospital outpatient visits were reported ().
Lost productivity
Subjects reported on work and activity impairment due to their pDPN. Among subjects employed for pay (n = 20, 17.9%), mean overall work impairment was 43.6% (32.9%, ). Across all subjects, mean overall activity impairment due to pDPN was 52.3% (31.1%, ). Higher values indicate greater impairment in both domains. Activity impairment increased/worsened as pain severity increased (mild, 21.4% ± 21.9%; moderate, 52.5% ± 27.7%; severe, 74.8% ± 23.2%; P < 0.0001, ).
Table 5 Work productivity and activity impairment: pDPN (WPAI:pDPN), overall and by average pain severity
Costs
Unadjusted mean annualized direct health care costs to the payer were $3302 ± $4611 per subject, and increased significantly as pain severity increased (mild, $1624 ± $2021; moderate, $3353 ± $4606; severe, $4464 ± $5595; P = 0.0134, data not shown). Annualized prescription medication costs were the primary driver of the total direct costs to the payer, making up, on average, 86.8% of the total unadjusted mean annualized direct costs to the payer, followed by physician office visits (10.7%, data not shown). Unadjusted mean annualized direct costs to subjects (out-of-pocket costs) were $1352 ± $2627 overall ($1075 ± $1386 for mild; $1346 ± $3181 for moderate; and $1587 ± $2233 for severe pain subgroups; P = 0.8037, data not shown). Unadjusted total mean annualized direct health care costs were $4654 ± $5605, and increased significantly as pain severity increased (mild, $2699 ± $2827; moderate, $4699 ± $6047; severe, $6051 ± $5976; P = 0.0267, data not shown).
Unadjusted total mean annualized indirect costs per subject were $9632 ± $19,108 overall ($1595 ± $4514 for mild; $9007 ± $17,980 for moderate; and $16,574 ± $24,702 for severe pain subgroups; P = 0.1131, data not shown).
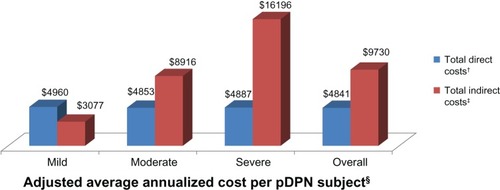
The total mean annualized adjusted direct health care costs per subject were $4841 and total mean annualized adjusted indirect costs per subject were $9730 (). Across pain severity levels, differences in annualized adjusted direct (P < 0.0001) and indirect (P = 0.0003) costs were significant ().
Figure 4 Adjusted average annualized cost per pDPN subject, overall and by average pain severity.*
Discussion
This is one of the few studies that attempted to evaluate comprehensively the overall burden of illness (ie, patient-reported outcomes, health care resource utilization, lost productivity, and cost) among adults in the US with pDPN. Subjects in this study were required to have a diagnosis of pDPN for at least 6 months and were actively seeking care (presented at routine office visits). The current study sample is consistent with samples in other published studies in the US and Europe, with regards to age, gender, race, proportion of subjects employed, and high proportion of subjects with moderate or severe pain.Citation1,Citation5,Citation10,Citation30,Citation31
In comparison with US normative data on the MOS Overall Sleep Index of 25.8,Citation16 patients with pDPNs in this study had substantially higher scores (overall 48.5; mild 34.2; moderate 48.7; severe 58.5), which indicate worse sleep outcomes. Previous US research demonstrates that patients with pDPN report significantly lower sleep adequacy than a diabetes sample without painful neuropathy.Citation32 Gore et al reported that subjects with pDPN have greater sleep problems compared with the general US population (mean Overall Sleep Index score 47.1 versus 25.8 population norm),Citation1 and the current study also supports this conclusion. The subjects with pDPN in the current study were comparable with those included in the study by Gore et al with regards to age, gender, race, employment status, duration of pDPN, pain severity, and sleep outcomes, as well as presence of mood disorders. Specifically, over half of the subjects with pDPN experienced some level of anxiety, and close to half experienced some level of depression, with the proportion of subjects reporting some level of anxiety and/or depression greater in subjects with greater pain severity. Gore et al reported that 60.4% of subjects had some level of anxiety and 50.6% had some level of depression.Citation1
This study found an association between pain severity and subject-reported health and well-being. Health status decreased as pain severity increased using both the SF-12 and EQ-5D. Although subjects were actively managed, the results support the finding that subjects with pDPN experienced substantially lower health status than the general US population, as reflected by scores on the Mental Component Summary (44.0), Physical Component Summary (32.2), and EQ-5D utilities (0.61), compared with the US norms of 49.48 (Mental Component Summary), 49.70 (Physical Component Summary), and 0.87 (EQ-5D utility).Citation33,Citation34 This study also found an association between mean utilities and pain severity (mild 0.80; moderate 0.66; and severe 0.39; P < 0.0001). Toelle et al similarly reported a substantial decrement in health status among subjects with pDPN measured by EQ-5D health state valuations (0.59, 0.43, and 0.20 for mild, moderate, and severe pain, respectively; P < 0.001).Citation7 The subjects with pDPN in the current study were comparable with those included in the study by Tolle et al with regards to duration of pDPN, pain severity, and health status. In order for physicians to create a tailored pDPN management strategy, an evaluation of depression, anxiety, and sleep, as well as the impact of pDPN on other measures of health status, is needed prior to and following initiation of treatment.Citation35
A comprehensive evaluation of the direct and indirect costs of pDPN, overall and by severity level, from a US patient-centered perspective, was conducted. Health care resource use, specifically the number of pDPN-related prescription medications (mild 0.9; moderate 1.5; severe 2.2; P = 0.0004), as well as the number of office visits per subject (mild 1.7; moderate 2.4; severe 3.3; P = 0.0171), increased as neuropathic pain severity level increased. A similar trend of increased health care resource utilization among those with greater pain severity has been shown in previous studies of pDPN with comparable pDPN samples (specifically age, gender, race, employment status, duration of pDPN, and pain severity).Citation8,Citation10 Gore et al estimated that approximately 60% of patients with pDPN had had at least two health care provider visits over the preceding 3 months and that subjects had averaged 3.8 prescription medications and 2.1 nonprescription medications in the previous week.Citation8 Our study found an average of 2.5 physician office visits and 1.6 prescription medications in the past 6 months for the management of pDPN, and 0.9 pDPN nonprescription medications in the past 4 weeks. Although DiBonaventura et al reported a similar trend of higher health care resource utilization among those with greater pain severity, they reported more health care provider visits, hospitalizations, and emergency room visits per subject.Citation10 It is important to note that DiBonaventura et al reported all-cause health care resource utilization and relied on patient self-reporting via the National Health and Wellness Survey.
High health care resource utilization rates resulted in substantial total direct medical costs per patient. This study demonstrated that costs increased as pain severity increased. The major drivers of the direct medical costs in our study were prescription medications (86.8% of mean annualized direct medical costs) and physician office visits (10.7% of mean annualized direct medical costs). Two US studies that reported costs did not collect data on medication use; both reported that hospitalizations were the primary driver of direct costs. Ritzwoller et al reported more than half of the total annual direct costs for subjects with pDPN were due to inpatient stays.Citation12 Ritzwoller et al used medical claims to assess resource use; resource use identified through medical claims databases cannot be attributed directly to pDPN. The pDPN sample analyzed by Ritzwoller et al was slightly older but had a gender distribution similar to that in the current study. DiBonaventura et al reported mean annual direct costs ($5786 among mild, $7762 among moderate, and $12,856 among severe). The primary drivers of the direct costs were hospitalizations ($2725) and provider visits ($2389). Direct costs were higher among those with greater pain.Citation10 Although the estimated direct costs reported by DiBonaventura et al are greater than in the current study, it is important to note that these reflect all-cause health care resource utilization, while the current study reports costs specific to pDPN. The current study also collected data on subjects’ out-of-pocket costs.
Indirect costs due to lost productivity, as well as indirect costs due to changes in employment status due to pDPN, were calculated, making the assessment of indirect costs more comprehensive than that in the current published literature. DiBonaventura et al reported total annual indirect costs due to lost productivity of $3641, $3413, and $3927 among mild, moderate, and severe pain groups, respectively.Citation10 The findings of the current study suggest that changes in employment status as well as lost productivity have a substantial impact on total costs. WPAI scores also showed a significant increase in activity impairment with increasing pain severity, thus establishing a clear relationship between pain and activities of daily living in this patient population. The results of this study point to the potential economic benefits of more effective management of pDPN.
Limitations
There are several limitations inherent in this analysis, particularly related to the possibility of incurring selection bias. First, this study enrolled subjects actively seeking medical care for their pDPN, as they presented for a routine medical appointment. Further, this study enrolled subjects diagnosed with pDPN at least 6 months earlier who had been managed at the physician’s practice for at least 6 months. As such, these findings may not be generalizable to others with pDPN who are not seeking treatment, or do not regularly visit their physician. However, in comparing standard demographic and clinical characteristics, including age, gender, race, employment status, duration of pDPN, pain severity, sleep outcomes, and anxiety and depression, the current study sample appears consistent with samples in previously published studies, which used alternative sampling methods.
This cross-sectional study required a retrospective review of medical records, which could lead to overreporting or underreporting of health care resource utilization. The subject’s medical record may not include all visits to other physicians, health care providers, facilities, and pDPN-related tests and procedures conducted, and medications prescribed outside of the study site. However, physicians and site coordinators were asked to review the health care resource utilization with subjects during their appointment. Similarly, data captured in this study was based on the physician and/or study site coordinator’s assessment of health care resource utilization attributable to pDPN versus the underlying condition, ie, diabetes. Therefore, it may have been difficult to separate out neuropathic pain-related health care resource utilization from that due to diabetes.
Direct costs were assigned using a standard algorithm. Actual costs to the payer may be higher or lower. Similarly costs were assigned to indirect costs based on average wage data, which may have overestimated or underestimated these costs. Finally indirect costs and out-of-pocket costs were based on subject recall, so may have resulted in overestimation or underestimation of annualized costs.
Conclusion
In summary, subjects with pDPN in this study reported moderate and severe levels of pain, on average, and suboptimal levels of overall health, functioning, and well-being despite receiving active management. Further, the economic burden of pDPN was increased when pain severity was greater. These findings highlight the importance and value of effective pain management in subgroups of subjects with pDPN.
Disclosure
This research was supported by Pfizer Inc. AS and BP are paid employees of Pfizer Inc. RB, FB, RM, and CS are employees of Covance Market Access Services Inc, who were paid consultants to Pfizer Inc in the development and execution of this study and manuscript. AA and SN were paid investigators for the study. BS, EN, and MT were not financially compensated for their collaborative efforts on this project, including publication-related activities.
References
- Gore M Brandenburg NA Dukes E Hoffman DL Tai K-S Stacey B Pain severity in diabetic peripheral neuropathy is associated with patient functioning, symptom levels of anxiety and depression, and sleep J Pain Symptom Manage 2005 30 4 374 385 16256902
- Sadosky A McDermott AM Brandenburg NA Strauss M A Review of the epidemiology of painful diabetic peripheral neuropathy, postherpetic neuralgia, and less commonly studied neuropathic pain conditions Pain Practice 2008 8 1 45 56 18211592
- Gregg EW Sorlie P Paulose-Ram R Prevalence of lower-extremity disease in the US adult population ≥40 years of age with and without diabetes: 1999–2000 national health and nutrition examination survey Diabetes Care 2004 27 1591 1597 15220233
- Galluzzi KE Management of neuropathic pain J Am Osteopath Assoc 2005 105 Suppl 4 S12 S19 16273720
- Taylor-Stokes G Pike J Sadosky A Chandran A Toelle T Association of patient-rated severity with other outcomes in patients with painful diabetic peripheral neuropathy Diabetes Metab Syndr Obes 2011 4 401 408 22253538
- Baron R Tölle TR Gockel U Brosz M Freynhagen R A cross-sectional cohort survey in 2100 patients with painful diabetic neuropathy and postherpetic neuralgia: Differences in demographic data and sensory symptoms Pain 2009 146 1 34 40 19592166
- Tolle T Xu X Sadosky AB Painful diabetic neuropathy: a cross-sectional survey of health state impairment and treatment patterns J Diabetes Complications 2006 20 1 26 33 16389164
- Gore M Brandenburg NA Hoffman DL Tai KS Stacey B Burden of illness in painful diabetic peripheral neuropathy: the patients’ perspectives J Pain 2006 7 12 892 900 17157775
- Jensen MP Chodroff MJ Dworkin RH The impact of neuropathic pain on health-related quality of life Neurology 2007 68 15 1178 1182 17420400
- daCosta DiBonaventura M Cappelleri JC Joshi AV A longitudinal assessment of painful diabetic peripheral neuropathy on health status, productivity, and health care utilization and cost Pain Med 2011 12 1 118 126 21087406
- Dworkin RH Panarites CJ Armstrong EP Malone DC Pham SV Health care utilization in people with postherpetic neuralgia and painful diabetic peripheral neuropathy J Am Geriatr Soc 2011 59 5 827 836 21568954
- Ritzwoller DP Ellis JL Korner EJ Hartsfield CL Sadosky A Comorbidities, health care service utilization and costs for patients identified with painful DPN in a managed-care setting Curr Med Res Opin 2009 25 6 1319 1328 19419344
- Ware JE Kosinski M Turner-Bowker DM Sundaram M Gandek B Maruish ME User’s Manual for the SF-12v2 Health Survey Second Edition Lincoln, RI QualityMetric Incorporated 2009
- Rabin R de Charro F EQ-5D: a measure of health status from the EuroQol Group Ann Med 2001 33 5 337 343 11491192
- Cleeland CS Ryan KM Pain assessment: global use of the Brief Pain Inventory Ann Acad Med Singapore 1994 23 2 129 138 8080219
- Hays RD Martin SA Sesti AM Spritzer KL Psychometric properties of the Medical Outcomes Study Sleep measure Sleep Med 2005 6 1 41 44 15680294
- Snaith R P Zigmond AS The Hospital Anxiety and Depression scale Br Med J (Clin Res Ed) 1986 292 6516 344
- Zigmond AS Snaith RP The Hospital Anxiety And Depression scale Acta Psychiatr Scand 1983 67 6 361 370 6880820
- Reilly MC Zbrozek AS Dukes EM The validity and reproducibility of a work productivity and activity impairment instrument Pharmacoeconomics 1993 4 5 353 365 10146874
- Cleeland C The Brief Pain Inventory User Guide 2009 Available from: http://www.mdanderson.org/education-and-research/departments-programs-and-labs/departments-and-divisions/symptom-research/symptom-assessment-tools/BPI_UserGuide.pdf Accessed September 15, 2011
- Ware JJr Kosinski M Keller SD A 12-Item Short-Form Health Survey: construction of scales and preliminary tests of reliability and validity Med Care 1996 34 3 220 233 8628042
- Viala-Danten M Martin S Guillemin I Hays RD Evaluation of the reliability and validity of the Medical Outcomes Study sleep scale in patients with painful diabetic peripheral neuropathy during an international clinical trial Health Qual Life Outcomes 2008 6 113 19091084
- Reilly Associates WPAI Scoring Available from: http://www.reillyassociates.net/WPAI_Scoring.html Accessed December 10, 2012
- Pharmacy Benefit Management Institute Pharmacy and drug manufacturer reimbursement Available from: http://www.benefitdesignreport.com/PharmacyReimbursement/tabid/66/Default.aspx Accessed November 26, 2012
- US Department of Labor Bureau of Labor Statistics Available from: http://www.bls.gov/oes/current/oes_nat.htm#00-0000 Accessed November 26, 2012
- Lofland JH Pizzi L Frick KD A review of health-related workplace productivity loss instruments Pharmacoeconomics 2004 22 3 165 184 14871164
- Social Security Administration Research, Statistics and Policy Analysis Available from: http://www.ssa.gov/policy/docs/quickfacts/stat_snap_shot/ Accessed November 26, 2012
- Zelman DC Dukes E Brandenburg N Bostrom A Gore M Classification of mild, moderate and severe pain due to diabetic peripheral neuropathy based on levels of functional disability J Pain 2004 5 Suppl 1 114
- Zelman DC Dukes E Brandenburg N Bostrom A Gore M Identification of cut-points for mild, moderate and severe pain due to diabetic peripheral neuropathy Pain 2005 115 1–2 29 36 15836967
- McDermott AM Toelle TR Rowbotham DJ Schaefer CP Dukes EM The burden of neuropathic pain: results from a cross-sectional survey Eur J Pain 2006 10 2 127 135 16310716
- O’Connor AB Neuropathic pain: quality-of-life impact, costs and cost effectiveness of therapy Pharmacoeconomics 2009 27 2 95 112 19254044
- Zelman DC Brandenburg NA Gore M Sleep impairment in patients with painful diabetic peripheral neuropathy Clin J Pain 2006 22 8 681 685 16988563
- Ware JE Kosinski M Turner-Bowker DM Sundaram M Gandek B Maruish ME User’s Manual for the SF-12v2 Health Survey Second Edition Lincoln, RI QualityMetric Incorporated 2009
- Luo N JJ Shaw JW Feeny D Coons SJ Self-reported health status of the general adult US population as assessed by the EQ-5D and Health Utilities Index Med Care 2005 43 11 1078 1086 16224300
- Cruccu G Anand P Attal N EFNS guidelines on neuropathic pain assessment Eur J Neurol 2004 11 3 153 162 15009162