
Abstract
Objective
To study the characteristics of selective polyadenylation (APA) in gestational diabetes mellitus (GDM) by poly(A) site sequencing and to explore the role of APA process in the pathogenesis of GDM.
Methods
Three pregnant women diagnosed as GDM in our hospital were randomly selected as the GDM group, and three healthy pregnant women at the same time as the control group. The placental tissues of two groups of pregnant women after delivery were collected for high-throughput transcriptome sequencing (RNA-seq) and poly(A) site sequencing (PAS-seq) to screen differentially expressed genes and variable 3’UTR genes in GDM. Gene Ontology (GO) analysis and pathway analysis were used to analyze the functional classification and pathway of differential genes, and preliminarily explore the susceptible genes in GDM.
Results
Compared with the control group, there were 202 TTS loci in the GDM group, including 103 genes with shortened TTS loci and 99 genes with delayed TTS loci. There were 57 genes with significant difference in TTS (P<0.05). Subsequently, we found that VCPIP1 and LGR4 were differentially expressed in RNA-seq. The genes in advance of TTS locus were enriched in biological processes such as cell development, protein transport and phosphorylation, signal transduction, etc. Delayed TTS genes are enriched in biological processes such as transcriptional regulation, cell migration and cycle, DNA repair and damage.
Conclusion
The abnormality of APA process may be involved in the occurrence and development of GDM. The genes with significantly different changes in TTS locus may become biomarkers or predictors for GDM to assess the incidence, disease progression and disease severity, and may also become potential targets for GDM treatment.
Introduction
Gestational diabetes mellitus (GDM) is defined as glucose intolerance of various degrees that is first detected during pregnancy.Citation1 GDM is a common chronic disease during pregnancy, damaging the health of millions of women around the world.Citation2,Citation3 Nowadays, the incidence rate of gestational diabetes is increasing, and it has reached 9–25% worldwide due to different ethnic groups, regions and other elements.Citation4,Citation5 The obvious feature of GDM is impaired glucose tolerance as a result of maternal pancreatic β-cell dysfunction, which leads to imbalance of glucose and lipid metabolism during pregnancy.Citation6 GDM has short-term and long-term adverse effects on health of mother and fetus. However, until now, the pathophysiology of GDM is not fully understood.
In eukaryotes, it is estimated that 30%–70% of the genes will produce mRNA with multiple selectable 3’UTRs, which is called selective polyadenylation (APA). The APA modification of mRNA has become an important mechanism of post-transcriptional gene regulation in higher eukaryotes. The 3’UTR regions with variable length may lead to different levels of protein expression. In order to better explore the mechanism of APA’s role in GDM, we chose a method based on deep sequencing, called Poly(A) site sequencing (PAS-seq), to quantitatively analyze RNA polyadenylation at the transcriptome level.Citation7 When the RNA chain extends to the transcription termination site (TTS), the process of transcription is terminated. The change of TTS site leads to the change of 3’UTR length, and further changes the interaction with microRNAs or other regulatory RNA binding proteins (RBPs) to affect the stability, location, transport and even translation of mRNA. The target site of miRNA exists in the 3’UTR region. The change of the length of the 3’UTR region during APA affects the function of miRNA. RBPs have similar effects. They bind to the 3’UTR region and exist as mRNA unstable elements.Citation8
Nowadays, in the exploration of GDM, numerous sequencing research have been published, which provide new ideas and directions for the pathogenesis and clinical potential application of GDM. For the first time, we introduced the change of APA events in GDM, and pointed out some differential genes that may play a key role in it. In conclusion, we believe that exploring the mechanism of APA events participating in the occurrence and development of GDM is of positive significance for the study of GDM, including its risk factors, biomarkers and health management.
Materials and Methods
Sample Collection
GDM pregnant women and healthy pregnant women who were delivered by Caesarean section at Shengjing Hospital of China Medical University from January 2022 to June 2022 were selected as the study subjects. Each diagnosis of GDM was based on the Guidelines for the Prevention and Treatment of Type 2 diabetes in China (2020). A 75-g oral glucose tolerance test (OGTT) was performed as required between 24 and 28 weeks during pregnancy. A diagnosis of GDM was made if the blood glucose of the patient met the following criteria at any point: 5.1 mmol/L≤fasting blood glucose <7.0 mmol/L, OGTT 1h blood glucose ≥10.0 mmol/L, or ≤8.5 mmol/L OGTT 2h blood glucose <11.1 mmol/L. The control group comprised healthy pregnant women who were hospitalized for caesarean section during the same period as those in the GDM group. The pregnant women in two groups all had single pregnancies without pregnancy hypertension, heart disease, infectious disease, serious liver and kidney disease, or endocrine disease, or other pregnancy complications. Ultimately, three normal and three GDM women were selected as the study subjects. The general clinical data of the subjects is shown in .
Table 1 Clinical Information of the Subjects
Within 10 minutes of the placenta being delivered, tissue was collected (about 1cm3 from the maternal side of the placenta within 2cm of the diameter of the umbilical cord root) and was immediately placed into liquid nitrogen for preservation after washing with normal saline. The study was conducted in accordance with the Declaration of Helsinki (as revised in 2013). This research scheme was approved by the Ethics Committee of Shengjing Hospital of China Medical University [2022PS313K].
RNA Extraction and Sequencing
Total RNA of tissue was extracted by the TRIZOL (Ambion). The RNA was further purified with two phenol-chloroform treatments and then treated with RQ1 DNase (Promega, Madison, WI, USA) to remove DNA. The quality and quantity of the purified RNA were redetermined by measuring the absorbance at 260 nm/280 nm (A260/A280) using Nanodrop one (Thermo). RNA integrity was further verified by 1.5% agarose gel electrophoresis. For each sample, 5 μg of total RNA was treated with RQ1 DNase (Promega) to remove DNA, fragmented RNAs were used for RNA-seq library preparation. mRNAs were captured with mRNA Capture Beads kit (Vazyme, N401-01). Fragmented mRNAs were used for directional PAS-seq library preparation by KAPA Stranded mRNA-Seq Kit for Illumina® Platforms (KK8544). Fragmented mRNAs were transcribed into cDNA with pas-RT primer; following end repair and A tailing, the DNAs were ligated to Diluted Roche Adaptor (KK8726). After purification of ligation product and size fractioning to 300–500 bp, the ligated products were amplified and purified, quantified and stored at -80°C before sequencing. The strand marked with dUTP (the second cDNA strand) is not amplified, allowing strand-specific sequencing. For high-throughput sequencing, the libraries were applied to Illumina Novaseq 6000 system for 150 nt paired-end sequencing.
RNA-Seq Raw Data Clean and Alignment
Raw reads containing more than 2-N bases were first discarded. Then, adaptors and low-quality bases were trimmed from raw sequencing reads using FASTX-Toolkit (Version 0.0.13). The short reads less than 16nt were also dropped. After that, clean reads were aligned to the GRCh38 genome by HISAT2 allowing four mismatches. Uniquely mapped reads were used for gene reads number counting and FPKM calculation (fragments per kilobase of transcript per million fragments mapped).
Peak Calling
After mapping, pA site information was extracted. In pas-seq data analysis, the localization of the 3’ end of effective poly(A) reads that can be compared to the reference genome was defined as poly(A) site. CAGEr was used for screening and statistical analysis of these poly(A) sites. Values of shifting score are in range between -Inf and 1. Positive values can be interpreted as the proportion of transcription initiation in the sample with lower expression that is happening “outside” (either upstream or downstream) of the region used for pA sites in the other sample. In contrast, negative values indicate no physical separation. The shift distance is at least greater than 10nt.
Key Genes Analysis
The R Bioconductor package DESeq2 was utilized to screen out the differentially expressed genes (DEGs). The P value <0.05 and fold change >1.5 or <0.67 were set as the cut-off criteria for identifying DEGs. Target scan (8.0), a miRNA prediction database, was used to predict miRNAs associated with key genes. RBPs of key gene interactions were predicted by starbase database, and DEGs in RNA-seq were analyzed for overlap.
Results
Preliminary Analysis of PAS-Seq Sequencing Data
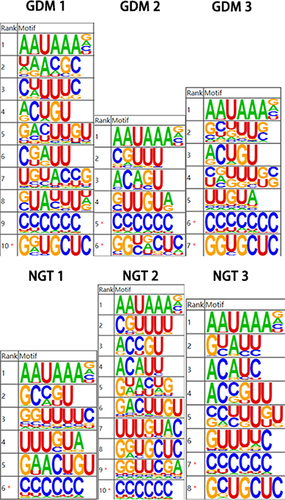
We conducted high-throughput sequencing and database building for the samples. The database was built using illumina Nextseq 500 sequencing platform for double-ended sequencing, and high-quality transcriptome data were obtained. We take the peak of poly(A) site as the center, extend 40bp upstream, extract the sequence within this range, and then conduct sequence feature enrichment analysis. It is found that the most enriched motif near poly(A) site in the sample is AAUAAA, which is consistent with the reported classical poly(A) signal sequence, as shown in .
Figure 1 Sequence analysis of poly(A) loci.
The clinical information of the sample is shown in . Relevant results of RNA-seq are shown in Figure S1.
PAS-Seq Reveals Alternative Polyadenylation Events in GDM
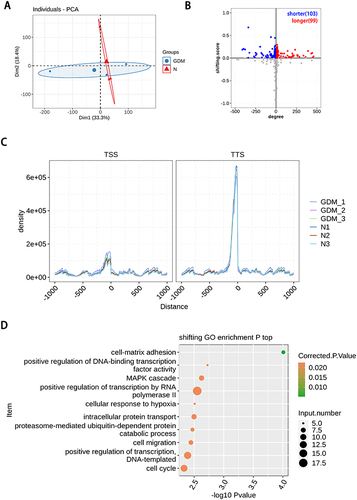
Through the analysis of PAS-seq database, 202 TTS loci were found to have different changes, including 112 genes with TTS locus in advance and 109 genes with TTS locus in delay. There were 57 genes with significant difference in TTS (P<0.05). The genes in advance of TTS locus were enriched in biological processes such as cell development, protein transport and phosphorylation, signal transduction, etc. The delayed genes at TTS site are enriched in such biological processes as transcriptional regulation, cell migration and cycle, DNA repair and damage. These results are shown in . By searching the documents related to GDM and TTS locus genes with significant differential changes, 13 authentic and credible genes, including ADHFE1, CD44, CHURC1, COLEC11, KDELR2, LGR4, LIPT2, VN1R1, ZNF701, DDX58, VCPIP1, LYPD3 and GIMAP5, were found worthy of attention.
Figure 2 Poly(A) site sequencing revealed alternative polyadenylation events in gestational diabetes mellitus. (A) PCA base on FPKM value of all detected genes in PAS-seq. The ellipse for each group is the confidence ellipse; (B) scatter plot showing the number of genes changing TTS. Gray dots refer to genes with no statistical significance; (C) enrichment of around transcriptional start site (TSS) and terminal site (TTS). Normalized reads count (RPM) in a ± 1000 bp window around TSS and TTS for all transcripts. RPM, reads per million; (D) the Scatter plot exhibiting the most enriched GO biological process results of the difference with TTS.
VCPIP1 and LGR4 Change TTS Site and mRNA Expression in GDM
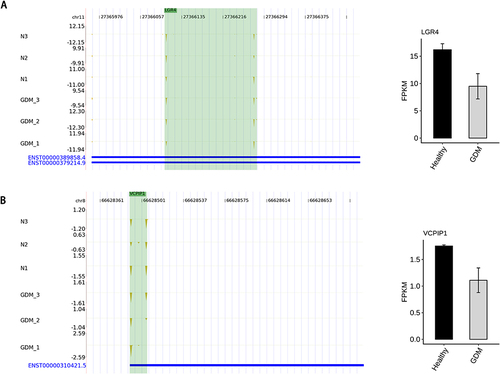
We found that a total of eight genes changed simultaneously in PAS-seq and RNA-seq. Among them, the mRNA of VCPIP1 and LGR4 had significant differential expression. In the sequencing, the mRNA expression of LGR4 and VCPIP1 was decreased in the GDM group. The TTS locus of LGR4 was shortened in advance, that is, 3’UTR, while the TTS locus of VCPIP1 was delayed, that is, 3’UTR was prolonged, as the results can be seen in .
Figure 3 Alternative polyadenylation in the mRNAs results in transcript instability. (A) The TTS distribution of LGR4, Left panel: IGV-sashimi plot showing the distribution of TTS locus reads, the green panels represent the position of changing. Reads distribution is plotted in the up panel and the transcripts of each gene are shown below. Right panel: The Bar plot showing the expression pattern and statistical difference of DEGs. Error bars represent mean±SEM. (B) The TTS distribution of VCPIP1, Left panel: IGV-sashimi plot showing the distribution of TTS locus reads, the green panels represent the position of changing. Reads distribution is plotted in the up panel and the transcripts of each gene are shown below. Right panel: The Bar plot showing the expression pattern and statistical difference of DEGs. Error bars represent mean±SEM.
Prediction miRNAs and RBPs Combined to Key Genes
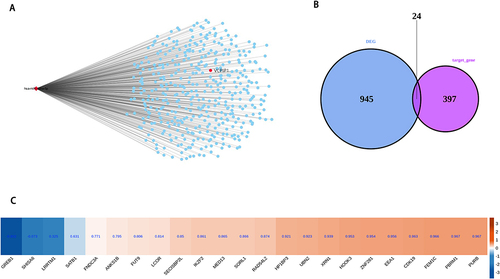
The miRNA and RBP of VCPIP1 and LGR4 were predicted. It was found that VCPIP1 bound has-miR-499a-5p, while LGR4 predicted two miRNAs, hsa-miR-520f-3p and hsa-miR-302c-3p. Through literature search, it is found that has-miR-499a-5p has a high correlation with GDM. Then, look for other targets of miR-499a-5p, and conduct overlapping analysis in DEGs. It is found that 24 target mRNA have significant differential expression in RNA-seq of this project, of which 2 genes are up-regulated and 22 genes are down-regulated (.
Figure 4 miR-499a-5p binds to the VCPIP1 3’UTR. VCPIP1, valosin-containing protein interacting protein 1. (A) The network plot showing the miR-499a-5p and its target mRNA; (B) Venn diagram showing the overlapped genes between DEGs and target mRNA; (C) Hierarchical clustering heat map showing expression correlations of overlap genes with VCPIP1.
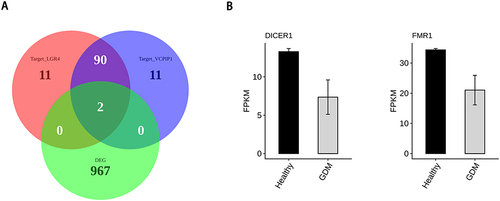
The starbase database was used to predict the RBPs interacting with LGR4 and VCPIP1, and the overlap analysis with DEGs showed that FMR1 and DICER1 were the most reliable, and they were differentially expressed in RNA-seq that we can see in .
Figure 5 RBP binds to VCPIP1, and LGR4 influences mRNA stability. RBP, RNA binding protein; VCPIP1, valosin-containing protein interacting protein 1; LGR4, leucine-rich repeat-containing G-protein coupled receptor 4. (A) Venn diagram showing the overlapped genes between DEGs and target RBP of LGR4 and target RBP of VCPIP1; (B) Bar plot showing the expression pattern and statistical difference of DEGs for overlap genes. Error bars represent mean±SEM.
Discussion
GDM refers to diabetes with normal glucose metabolism before pregnancy or potential impaired glucose tolerance, which occurs or is diagnosed during pregnancy. More than 80% of abnormal glucose metabolism in pregnant women is GDM. The glucose metabolism of GDM patients can return to normal after delivery, but the risk of T2DM will increase in the future.Citation6,Citation9 In the second and third trimesters of pregnancy, the increase of anti-insulin-like substances in pregnant women, such as placental lactogen, estrogen, progesterone, cortisol and placental insulinase, makes the sensitivity of pregnant women to insulin decrease with the increase of gestational weeks. In order to maintain normal glucose metabolism, insulin demand must be increased accordingly.Citation10
GDM has short-term and long-term adverse effects on health. For mothers, the short-term will increase the probability of adverse pregnancy events, and the long-term will increase women’s risk of T2DM and cardiovascular disease (CVD).Citation11,Citation12 For the fetus, the probability of macrosomia is significantly increased, and infant hypoglycemia occurs.Citation13–16 If not handled properly, it will also cause brain damage.Citation17 In the long term, infants born with GDM pregnancy are at increased risk of obesity, T2DM, CVD and related metabolic diseases.Citation6
When the RNA chain extends to the TTS site, the RNA polymerase will no longer form a new phosphodiester bond, the RNA DNA hybrid will be separated, the transcription bubble will collapse, and the DNA will return to the double-stranded state, while the RNA polymerase and RNA chain will be released from the template, which is the termination of transcription. The change of TTS site makes the transcript 3’UTR lengthen or shorten. The median length of 3’UTR varies from 140nt to 2300nt. RBPs bound by 3’UTR interact with cell movement or other proteins, which may guide variable 3’UTR to be located in different regions to perform different functions. 3’UTR binding to AU-rich RBPs or miRNAs will lead to instability of mRNA and shorten the half-life of mRNA. 3’UTR binding RBPs interact with translation initiation factors to regulate mRNA translation. In addition, it has also been reported that the function of 3’UTR not only affects the relevant attributes of mRNA. It can also affect newborn proteins, which recruit proteins to translation sites by acting as scaffolds, so that proteins can form complexes with newborn peptide chains, and regulate the formation and positioning of membrane proteins. It has also been reported that RBP can regulate the variable 3’UTR events of pre-mRNA.Citation18
Through our analysis of sequencing data, we found that there are two differentially expressed genes, VCPIP1 and LGR4, which are most likely to cause changes in mRNA due to changes in TTS sites.
VCPIP1, also known as VCIP135, is a kind of ubiquitination enzyme, which is related to the reorganization of Golgi apparatus and endoplasmic reticulum after mitosis, and is also involved in DNA protein cross-linking (DPC) repair. It is reported that VCPIP1 can also stably catalyze light-chain metalloproteinases. Other studies have shown that VCPIP1 −/− mice are born normally, and they are prone to genomic instability and premature aging. VCPIP1 knockout also causes hypersensitivity to DPC inducers, Top1cc accumulation, chromosomal abnormalities and micronucleus formation, indicating that VCPIP1 is crucial in DPC repair and maintaining genomic stability.Citation19 It has been found that in GDM, the expression of Has-miRNA-499a-5p is increased, and it may be related to hypertension in pregnancy, preeclampsia, etc.Citation20 These studies suggest that VCPIP1 in GDM may lead to the prolongation of 3’UTR region through the change of TTS site, leading to the increase of binding miRNA-499a-5p, thus affecting the stability of VCPIP1 mRNA, further affecting its protein expression, and reducing its expression.
LGR4 is a G protein-coupled receptor-4 rich in leucine sequence, belonging to the B subfamily of G protein-coupled receptor superfamily, which controls multiple pathways and biological processes. At the molecular level, LGR4 is involved in different intracellular signal transduction pathways, including Wnt, NFκB, TGFβ and cAMP, which indicates that LGR4 is involved in excessive mechanisms that control cell events in a tissue-specific manner. LGR4 also plays an important role in metabolic regulation, coordinating various metabolic signals.Citation21 Recently, Dong et alCitation22,Citation23 described RSPO2/LGR4 as a key regulator for the differentiation of precursor cells into adipocytes. In addition, Li et al observed that the level of LGR4 in diabetes patients was significantly lower than that in non-diabetes patients (P<0.05), and the level of LGR4 in hypertensive patients was lower than that in non-hypertensive patients with higher blood pressure.
To sum up, this study screened five signal pathways and eight key genes through high-throughput sequencing of GDM placental tissue and bioinformatics analysis of data. Through literature search, we further found two genes that may play a key role in the occurrence and development of GDM, VCPIP1 and LGR4, which are expected to become the susceptible genes predicted by GDM, new molecular markers for diagnosis, and new targets for the development of targeted drugs for treatment.
Conclusion
The abnormality of APA process may be involved in the occurrence and development of GDM. The genes with significantly different changes in TTS locus may become biomarkers or predictors for GDM to assess the incidence, disease progression and disease severity, and may also become potential targets for GDM treatment.
We speculate that LGR4 and VCPIP1 may be related to TTS site changes in the placenta of pregnant women with diabetes, and miRNAs or RBPs bind to 3’UTR of LGR4 and VCPIP1 to inhibit their expression that to affect the stability of its mRNA, and ultimately down regulate its expression.
Ethics Statement
This research scheme was approved by the Ethics Committee of Shengjing Hospital affiliated to China Medical University [2022PS313K].
Disclosure
The authors declare no conflicts of interest in this work.
Acknowledgment
We gratefully acknowledge Yueyang Zhao for providing intellectual support and technical assistance.
Additional information
Funding
References
- American Diabetes A. Diagnosis and classification of diabetes mellitus. Diabetes Care. 2013;36(Suppl1):S67–74.
- Hanson MA, Gluckman PD, Ma RC, Matzen P, Biesma RG. Early life opportunities for prevention of diabetes in low and middle income countries. BMC Public Health. 2012;12:1025. doi:10.1186/1471-2458-12-1025
- Poon LC, McIntyre HD, Hyett JA, et al. The first-trimester of pregnancy - A window of opportunity for prediction and prevention of pregnancy complications and future life. Diabetes Res Clin Pract. 2018;145:20–30. doi:10.1016/j.diabres.2018.05.002
- Schneider S, Bock C, Wetzel M, Maul H, Loerbroks A. The prevalence of gestational diabetes in advanced economies. J Perinat Med. 2012;40(5):511–520. doi:10.1515/jpm-2012-0015
- Hoffman DJ, Reynolds RM, Hardy DB. Developmental origins of health and disease: current knowledge and potential mechanisms. Nutr Rev. 2017;75(12):951–970. doi:10.1093/nutrit/nux053
- Plows JF, Stanley JL, Baker PN, Reynolds CM, Vickers MH. The pathophysiology of gestational diabetes mellitus. Int J Mol Sci. 2018;19:11. doi:10.3390/ijms19113342
- Shepard PJ, Choi EA, Lu J, Flanagan LA, Hertel KJ, Shi Y. Complex and dynamic landscape of RNA polyadenylation revealed by PAS-Seq. RNA. 2011;17(4):761–772. doi:10.1261/rna.2581711
- Zheng D, Wang R, Ding Q, et al. Cellular stress alters 3’UTR landscape through alternative polyadenylation and isoform-specific degradation. Nat Commun. 2018;9(1):2268. doi:10.1038/s41467-018-04730-7
- Catalano PM, McIntyre HD, Cruickshank JK, et al. The hyperglycemia and adverse pregnancy outcome study: associations of GDM and obesity with pregnancy outcomes. Diabetes Care. 2012;35(4):780–786. doi:10.2337/dc11-1790
- Westermeier F, Saez T, Arroyo P, et al. Insulin receptor isoforms: an integrated view focused on gestational diabetes mellitus. Diabetes Metab Res Rev. 2016;32(4):350–365. doi:10.1002/dmrr.2729
- Shostrom DCV, Sun Y, Oleson JJ, Snetselaar LG, Bao W. History of gestational diabetes mellitus in relation to cardiovascular disease and cardiovascular risk factors in US women. Front Endocrinol (Lausanne). 2017;8:144. doi:10.3389/fendo.2017.00144
- Peters RK, Kjos SL, Xiang A, Buchanan TA. Long-term diabetogenic effect of single pregnancy in women with previous gestational diabetes mellitus. Lancet. 1996;347(8996):227–230. doi:10.1016/S0140-6736(96)90405-5
- Schwartz R, Gruppuso PA, Petzold K, Brambilla D, Hiilesmaa V, Teramo KA. Hyperinsulinemia and macrosomia in the fetus of the diabetic mother. Diabetes Care. 1994;17(7):640–648. doi:10.2337/diacare.17.7.640
- Fetita LS, Sobngwi E, Serradas P, Calvo F, Gautier JF. Consequences of fetal exposure to maternal diabetes in offspring. J Clin Endocrinol Metab. 2006;91(10):3718–3724. doi:10.1210/jc.2006-0624
- Gascho CL, Leandro DM, Ribeiro EST, Silva JC. Predictors of cesarean delivery in pregnant women with gestational diabetes mellitus. Rev Bras Ginecol Obstet. 2017;39(2):60–65. doi:10.1055/s-0037-1598644
- Scifres CM, Feghali M, Dumont T, et al. Large-for-gestational-age ultrasound diagnosis and risk for cesarean delivery in women with gestational diabetes mellitus. Obstet Gynecol. 2015;126(5):978–986. doi:10.1097/AOG.0000000000001097
- Esakoff TF, Cheng YW, Sparks TN, Caughey AB. The association between birthweight 4000 g or greater and perinatal outcomes in patients with and without gestational diabetes mellitus. Am J Obstet Gynecol. 2009;200(6):672 e671–674. doi:10.1016/j.ajog.2009.02.035
- Chu WK, Hung LM, Hou CW, Chen JK, Regulates PKC. YAP Expression through alternative splicing of YAP 3’UTR Pre-mRNA by hnRNP F. Int J Mol Sci. 2021;22:2. doi:10.3390/ijms22020694
- Huang J, Zhou Q, Gao M, et al. Tandem deubiquitination and acetylation of SPRTN promotes DNA-protein crosslink repair and protects against aging. Mol Cell. 2020;79(5):824–835 e825. doi:10.1016/j.molcel.2020.06.027
- Hromadnikova I, Kotlabova K, Dvorakova L, Krofta L. Diabetes mellitus and cardiovascular risk assessment in mothers with a history of gestational diabetes mellitus based on postpartal expression profile of microRNAs associated with diabetes mellitus and cardiovascular and cerebrovascular diseases. Int J Mol Sci. 2020;21(7):2437. doi:10.3390/ijms21072437
- Filipowska J, Kondegowda NG, Leon-Rivera N, Dhawan S, Vasavada RC. LGR4, a G protein-coupled receptor with a systemic role: from development to metabolic regulation. Front Endocrinol (Lausanne). 2022;13:867001. doi:10.3389/fendo.2022.867001
- Dong H, Sun W, Shen Y, et al. Identification of a regulatory pathway inhibiting adipogenesis via RSPO2. Nat Metab. 2022;4(1):90–105. doi:10.1038/s42255-021-00509-1
- Li JY, Chai B, Zhang W, Fritze DM, Zhang C, Mulholland MW. LGR4 and its ligands, R-spondin 1 and R-spondin 3, regulate food intake in the hypothalamus of male rats. Endocrinology. 2014;155(2):429–440. doi:10.1210/en.2013-1550