
Abstract
Background
Laparoscopic sleeve gastrectomy (LSG) is considered as an effective bariatric and metabolic surgery for patients with severe obesity. Chronic low-grade inflammation of adipose tissue is associated with obesity and obesity-related complications.
Objective
This study intends to establish a nomogram based on inflammatory response-related methylation sites in intraoperative visceral adipose tissue (VAT) to predict excess weight loss (EWL)% at one-year after LSG.
Methods
Based on EWL% at one-year after LSG, patients were divided into two groups: the satisfied group (group-A, EWL%≥50%) and the unsatisfied group (group-B, EWL%<50%). Next, we defined genes corresponding to the methylation sites in the 850 K methylation microarray as methylation-related genes (MRGs). We then took the intersection of MRGs and inflammatory response-related genes. After that, inflammatory response-related methylation sites were identified based on overlapping genes. Moreover, difference analysis was carried out to obtain inflammatory response-related differentially methylated sites (IRRDMSs) between group-A and group-B. LASSO analysis was used to identify the hub methylation sites. Finally, we developed a nomogram based on the hub methylation sites.
Results
There were 26 patients in the study, with 13 in group-A and 13 in group-B. After data filtering and difference analysis, 200 IRRDMSs were identified (143 hypermethylated sites and 57 hypomethylated sites). Then, we identified three hub methylation sites (cg03610073, cg03208951, and cg18746357) by LASSO analysis and built a predictive nomogram (Area under the curve=0.953).
Conclusion
The predictive nomogram based on three inflammatory-related methylation sites (cg03610073, cg03208951, and cg18746357) in intraoperative visceral adipose tissue can predict one-year EWL% after LSG effectively.
Introduction
Recently, the number of people with excess body weight has surpassed 2 billion, accounting for 30% of the global population.Citation1 Obesity increases the incidence of other diseases, such as type 2 diabetes mellitus (T2DM), coronary heart disease, stroke, hypertension, and cancer.Citation2 In individuals with overweight and obesity, metabolic disease and organ tissue complications are mechanistically related to chronic low-grade inflammation of adipose tissue.Citation3,Citation4 Chronic inflammation in adipose tissue is linked to dysfunctional adipocytes that secret inflammatory adipokines and immune cells that produce cytokines and chemokines.Citation5 Chronic inflammation-mediated tissue damage has been observed in many organs, including the heart, pancreas, liver, lungs, brain, and intestines.Citation6 Currently, an increasing number of studies attempt to investigate the mechanisms of obesity from the perspective of inflammation.
Weight control is essential for both treating obesity and preventing obesity-related complications.Citation7 Treatment methods for obesity include bariatric and metabolic surgery (BMS), medication intervention, lifestyle modification, and nutritional changes.Citation8 BMS is considered the most satisfied and cost-effective procedure for patients with severely obesity by altering the gastrointestinal tract.Citation9,Citation10 The most common BMS is laparoscopic sleeve gastrectomy (LSG), accounting for nearly half of all obesity surgeries performed worldwide.Citation11 The excess weight loss% (EWL%)≥50% proves to be a specific and sensitive criterion for satisfied BMS.Citation12 However, poor EWL% was observed in about 20–30% of patients with severely obesity who underwent BMS.Citation13 Thus, it is particularly important to explore effective methods to identify patients at high risk of poor EWL%.
There is a correlation between a patient’s epigenetic background and the outcome of BMS.Citation14,Citation15 DNA methylation is one of the essential types of epigenetic modifications, primarily characterized as the attachment of a methyl group at the 5th carbon of a cytosine, known as 5-methyl cytosine (5-mC).Citation16 As a kind of epigenetic modification, DNA methylation has been reported to be linked with obesity.Citation17,Citation18 What’s more, aberrant DNA methylation profiles could exacerbate inflammation. Thus, it is reasonable to explore the impact of DNA methylation profiles on the outcome of BMS from the perspective of inflammatory response. However, it must be acknowledged that research about inflammatory response-related methylation sites (IRRMSs) in BMS is still in its infancy and significant questions remain.
This study proposes developing a nomogram based on IRRMSs in intraoperative visceral adipose tissue (VAT) to predict EWL% at one year after LSG. Our study sheds new light on the prediction of EWL% after BMS from the perspective of IRRMSs.
Methods
Patient Population
This study included 26 patients with obesity who underwent LSG in our hospital. We collected VAT at the time of LSG from 26 patients. Based on EWL% at one year after LSG, patients were divided into two groups: the satisfied group (group-A, EWL%≥50%) and the unsatisfied group (group-B, EWL%<50%). The Institutional Review Board (IRB) of our hospital approved this study (Approval No. sjtkyll-lx-2019-58). The study protocol conformed to the ethical guidelines of the 1975 Declaration of Helsinki. Written informed consent was obtained from each participant.
Clinical Characteristics
The detailed inclusion and exclusion criteria have been described in Supplementary File 1. The detailed LSG procedure was described in Supplementary File 2. The procedures for 850 K methylation microarray were described in Supplementary File 3. Clinical characteristics collected in this study included sex, age, body mass index (BMI), waist-to-hip ratio (WHR), T2DM, hypertension, hyperuricemia, hyperlipidemia, fatty liver and marital status. Post-operative follow-up was carried out by telephone.
Formula Calculation
Based on the original data, BMI, WHR, EWL%, and β-value for this study were calculated using the following formula.
(1) BMI = weight in kg/(height in m)2;
(2) WHR = waist in cm/hip in cm;
(3) EWL%=(weight loss/baseline excess weight)×100%, where weight loss = preoperative weight−postoperative weight; baseline excess weight = initial weight−the ideal weight. Where ideal weight was calculated using an ideal BMI, and the ideal BMI cutoff point is 23 kg/m2.
(4) β-value = methylated probe intensity/overall probe intensity (overall probe intensity=methylated intensity+unmethylated probe intensity+constant α, where α = 100).
Identification and Validation of Hub Methylation Sites
Firstly, we defined genes corresponding to the methylation sites in the 850 K methylation microarray as methylation-related genes (MRGs). Inflammatory response-related genes were obtained from the Gene Set Enrichment Analysis (GSEA) gene set (http://www.gsea-msigdb.org/gsea/index.jsp, M5932). Then, we took the intersection of MRGs and inflammatory response-related genes. After that, IRRMSs were identified based on overlapping genes. Moreover, difference analysis was carried out to obtain inflammatory response-related differentially methylated sites (IRRDMSs) between group-A and group-B. The least absolute shrinkage and selection operator (LASSO) analysis was utilized to identify hub methylation sites. Finally, three different methods were used to evaluate hub methylation sites: (1) Correlation analysis between β-values of hub methylation sites and EWL% at one-year after LSG; (2) Difference analysis of hub methylation sites between group F and group S; (3) Receiver operating characteristic (ROC) curves.
Establishment and Evaluation of Nomogram
We built a predictive nomogram using the “RMS” R package based on hub methylation sites. Then, the ROC and calibration curves were used to assess the predictive ability of the nomogram. Furthermore, decision curve analysis (DCA) was performed to evaluate the clinical usefulness of the nomogram.
Statistical Analysis
t-tests were used to evaluate differences for quantitative data and regularly distributed variables, while Wilcoxon rank-sum tests were used to analyze differences for non-normally distributed variables. The linear association between variables was assessed by the Spearman’s rank correlation coefficient test. All statistical p-values were two-sided, and p-value < 0.05 indicates statistical significance. All of the data were processed in the R version 4.2.1 software.
Results
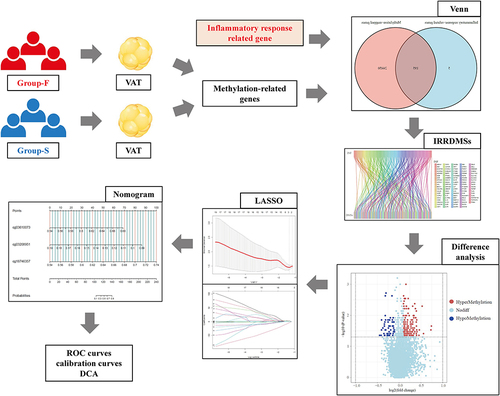
The workflow of this study was illustrated in .
Figure 1 Design and workflow of the study.
Patient Classification and Clinical Characteristics
Based on EWL% at one year after LSG, 26 patients were divided into two groups: 13 in group-A (EWL%≥50%) and 13 in group-B (EWL%<50%). There were no statistically significant differences in the preoperative characteristics (age, sex, WHR, BMI, T2DM, hypertension, hyperlipidemia, hyperuricemia, and fatty liver) between group-A and group-B (Supplementary Table 1).
Identification of DMSs
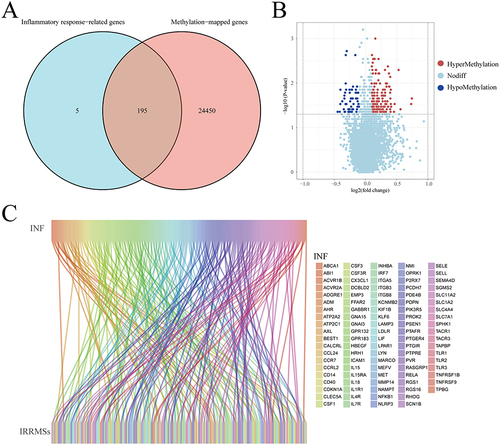
A total of 743,543 methylation sites and 24,645 MRGs were detected in VAT of patients with obesity. Two hundred inflammatory response-related genes were obtained from the GSEA (Supplementary Table 2). Then, 195 overlapping genes between the MRGs and inflammatory response-related genes were discovered using venn tools (, Supplementary Table 3). We mapped overlapping genes to methylation sites based on their genomic location, a total of 4974 IRRMSs were identified (Supplementary Table 4). After data filtering and difference analysis, 200 IRRDMSs (143 hypermethylated sites and 57 hypomethylated sites) were identified between group-A and group-B ( and ).
Figure 2 Identification of inflammatory response-related differentially methylated sites (IRRDMSs). (A) The venn diagram showed the intersection of methylation-related genes and inflammatory response-related genes. (B) The volcano map of IRRDMSs between the group-B (EWL%<50%) and group-A (EWL%≥50%); (C) The Sankey diagram linked inflammatory response-related genes to IRRDMSs.
Characteristics of IRRDMSs
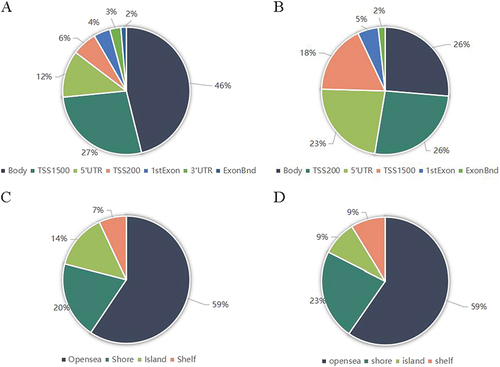
The percentages of hypermethylated sites were 46.15%, 27.27%, 11.89%, 6.29%, 4.20%, 2.80%, and 1.40% in the body, 200–1500 bases upstream of the transcription start site (TSS1500), 5’ untranslated region (5’ UTR), 0–200 methylation profile analysis in obesity 1441 bases upstream of the transcription start site (TSS200), 1st Exon, 3’ UTR, and Exonbnd, respectively (). However, the percentages of hypomethylated sites were 26.32%, 26.32%, 22.81%, 17.54%, 5.26% and 1.75% in the body, TSS200, 5’ UTR, TSS1500, 1st Exon, and Exonbnd, respectively (). The percentages of hypermethylated CpG sites in the open sea, shore, island, and shelf were 59.44%, 19.58%, 13.99%, and 6.99%, respectively (). At the same time, the percentages of hypermethylated CpG sites in the open sea, shore, island, and shelf were 59.65%, 22.81%, 8.77%, and 8.77%, respectively ().
Figure 3 Genomic features of inflammatory response-related differentially methylated sites between group-B (EWL%<50%) and group-A (EWL%≥50%). (A) Distribution of the hypermethylated differentially methylated CpG sites across the annotated gene regions; (B) Distribution of the hypomethylated differentially methylated CpG sites across the annotated gene regions; (C) Distribution of the hypermethylated differentially methylated CpG sites in relation to CpG islands; (D) Distribution of the hypomethylated differentially methylated CpG sites in relation to CpG islands.
Identification and Validation of Hub Methylation Sites
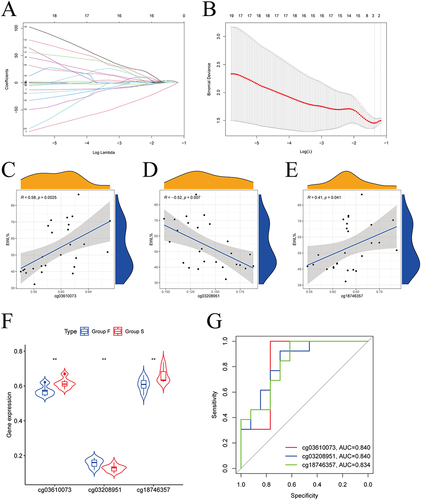
We identified three hub methylation sites, including cg03610073, cg03208951, and cg18746357 by LASSO analysis ( and ). And cg03610073, cg03208951, and cg18746357 maps to toll-like receptor 2 (TLR2), epithelial membrane protein 3 (EMP3), and p65 (RELA), respectively. The results of the correlation analysis () showed that cg03610073 and cg18746357 were significantly positively correlated one-year EWL% after LSG (Rcg03610073=0.58, Pcg03610073=0.003, and Rcg18746357=0.41, Pcg18746357=0.041), but cg03610073 was significantly negatively correlated one-year EWL% after LSG (Rcg03610073=−0.52, Pcg03610073<0.001). The violin diagram showed statistically significant differences in β-values of three hub methylation sites between group-B and group-A (). The ROC curves showed the area under the curve (AUC) were 0.840, 0.840, and 0.834 for cg03610073, cg03208951, and cg18746357, respectively ().
Figure 4 Identification of hub methylation sites. (A) LASSO coefficient profiles of 200 genes; (B) Cross-validation for choosing tuning parameter of LASSO model; (C) The results of the correlation analysis showed that cg03610073 was significantly positively correlated one-year EWL% after LSG; (D) The results of the correlation analysis showed that cg03208951 was significantly negatively correlated one year EWL% after LSG; (E) The results of the correlation analysis showed that cg18746357 was significantly positively correlated one-year EWL% after LSG; (F) Box plots showed statistically significant differences in β-values for the 3 hub methylation sites between group-B (EWL%<50%) and group-A (EWL%≥50%); (G) ROC curve showed the potential of cg03610073, cg03208951, and cg18746357 predicting EWL% at one year following LSG.
Establishment and Evaluation of Nomogram
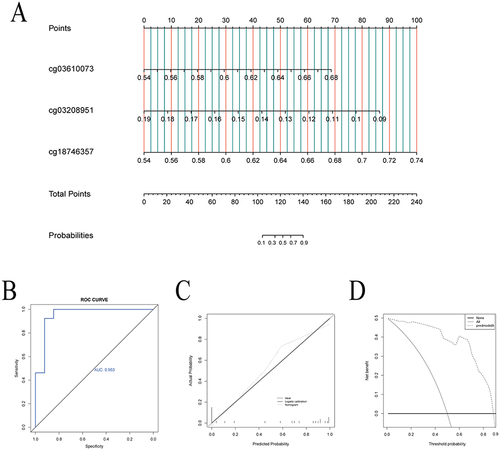
Based on the three hub methylation sites, we developed a nomogram to predict EWL% at one year following LSG (). The ROC curve for the nomogram was positioned near the desirable upper left corner while the AUC was 0.953, indicating that the accuracy of the nomogram was high (). The calibration plot demonstrated the concordance of our nomogram result with the actual endpoints (). Decision curve analysis (DCA) indicated that our nomogram yielded a high clinical net benefit (). The nomogram was used in the following way: the β-values of three hub methylation sites were detected in VAT collected from patients who underwent LSG. Assuming that the three hub methylation sites’ β-values were 0.59 (cg03610073), 0.13 (cg03208951), and 0.60 (cg18746357), corresponding to the scores 25, 52, and 30 in turn. Therefore, the total score was calculated to be 107. The probability of EWL%≥50% at one-year following LSG was considered 10–30%.
Figure 5 Establishment and evaluation of nomogram. (A) The nomogram, based on the 3 hub methylation sites, for predicting EWL% at one year following LSG; (B) The receiver operating characteristic curve showed the potential of the nomogram in predicting EWL% at one year following LSG; (C) Calibration curves of the nomogram. (D) Decision curve analysis of the nomogram.
Discussion
LSG is a surgical procedure performed frequently to treat patients with obesity and associated comorbidities worldwide. Twenty to thirty percent of patients who undergo LSG suffer unsatisfactory outcomes, including premature weight stabilization and weight regain after surgery.Citation19,Citation20 Weight regain after LSG has adverse effects on health and quality of life.Citation21 And more than 97% of specialists agreed that redo-surgeries after LSG was the appropriate treatment option in cases of weight regain or unsatisfied weight loss.Citation22 Therefore, it is imperative to identify patients at high risk of suffering unsatisfied EWL% following LSG. DNA methylation regulates gene expression epigenetically.Citation16 The DNA methylation marks have emerged as a promising tool for the screening, diagnosis, prognosis, and prediction of obesity and metabolic syndrome features.Citation23 Moreover, obesity appears to cause a metabolic inflammatory state, defined as a low-grade, chronic inflammation orchestrated by metabolic cells and inflammatory markers in response to excess nutrients and energy.Citation24 Adipose cell-specific epigenetic signatures may serve as potential mechanisms underlying the restoration of metabolic health following BMS, suggesting useful predictive biomarkers.Citation25,Citation26 In this study, we aim to establish a model based on IRRMSs in intraoperative VAT to predict EWL% at one year after LSG. We started with obtaining the overlapping genes between MRG and inflammatory response-related genes in intraoperative VAT. Then, we identified IRRDMSs by difference analysis between group-A and group-B. Moreover, we identify hub inflammatory response-associated methylation sites by LASSO analysis. Finally, we build a nomogram to predict EWL% at one year after LSG.
In our study, the three hub IRRDMSs were cg03610073, cg03208951, and cg18746357, mapping to TLR2, EMP3, and RELA, respectively. The first hub methylation site is cg03610073, which exhibited a positive association with EWL% at one-year after LSG (R=0.58, P=0.003) and located in the shore of TLR2. On one hand, TLR2 is a subtype of the TLR family and plays an essential role in the acute phase response of inflammation.Citation27 On the other hand, compared to normal individuals, TLR2 expression is increased in patients with obesity, resulting in pathogenic effects such as T2DM.Citation28,Citation29 Our results indicated that the β-values of cg03610073 were higher in group-A than those in group-B, which suggest that TLR2 expression in group-A was lower than in group-B. The second hub methylation site is cg18746357, which exhibited a positive association with EWL% at one-year after LSG (R=0.41, P=0.041) and located in the body of RELA. RELA, also known as the NF-κB p65 subunit, is an important component of the NF-κB signaling pathway.Citation30 NF-κB signaling is critically involved in both the activation and inhibition of the immune system.Citation31 In our study, the β-values of cg18746357 were higher in group-A than in group-B, which suggested that RELA expression in group-A was lower than in group-B. The third hub methylation site is cg03208951, which exhibits a positive association with EWL% at one-year after LSG (R=−0.52, P=0.007) and located in the 1stExon of EMP3 gene. EMP3 is a tetraspanin membrane protein that represses the induction and function of cytotoxic T lymphocytes.Citation32 According to the results of our research, the β-values of cg03208951 were higher in group-B than they were in group-A, which implied EMP3 expression was lower in group-B than in group-A. The AUC values for cg03610073, cg03208951, and cg18746357 were 0.840, 0.840, and 0.834, respectively. The AUC is an indicator of a model’s accuracy. We considered AUC values 0.5–0.7, 0.7–0.9, and >0.9 to indicate low, medium, and high performance, respectively. Thus, cg03610073, cg03208951, and cg18746357 all have medium predictive capacity. Interestingly, our study also found that cg03610073 and cg18746357 correlated positively with EWL% at one year after LSG, while cg03208951 correlated negatively with EWL%. Therefore, these three hub IRRDMSs could not only be utilized to predict outcomes at one year after LSG but also to analyze the level of EWL%.
A nomogram was established based on three hub methylation sites. The nomogram combines β-values of the three methylation sites, calculates the total score, and includes the possibility of outcome event EWL%≥50% in the graph. The nomogram can display the outcomes of the risk model intuitively and effectively and is more convenient to apply in clinical practice.Citation33 The AUC value of the nomogram was greater than 0.90, indicating that the nomogram has an excellent predictive ability. Moreover, the calibration curve of the nomogram demonstrated a good consistency between the actual clinical results and the predicted outcomes. The results of the DCA further demonstrated that our nomogram conferred significantly high clinical net benefits. Based on our nomogram, we can identify patients at high risk of poor EWL% on time. These patients might need additional postoperative intervention, including but not limited to more stringent food intake, lifestyle reconstruction, and modest exercise.
Many preoperative factors, such as stress,Citation34 age,Citation35 BMI,Citation36 and polycystic ovary syndrome,Citation37 could be utilized to predict EWL% after BMS. However, traditional clinical characteristics have some shortcomings in predicting EWL%. These deficiencies may be attributable to the fact that deeper factors such as epigenetic background and metabolic inflammatory state were not considered. While, we used three hub IRRMSs for the first time to predict EWL% at one year after LSG. From the viewpoint of IRRMSs, this study offered new insights on predicting EWL%. In addition, intraoperative methylation detection provides rapid and effective feedback.
Our study has several advantages. At the beginning, we utilized IRRMSs to predict one-year EWL% after LSG for the first time. Second, our nomogram has a concise scoring system that allows surgeons to estimate EWL% easily at one year after LSG. Moreover, our nomogram was an effective model performed excellently in an independent population. Third, timely detection on hub methylation sites after intraoperative acquisition of VAT could lead to early intervention and greater clinical benefits for patients at high risk of poor EWL%.
Despite the strengths, there are several shortcomings in our study. First, DNA methylation sites detection in VAT requires a well-developed medical device system, which makes the nomogram difficult to be utilized in some primary hospitals. Second, the number of our sample was limited, and further validation is required on larger sample size and multiple populations.
Conclusion
The predictive nomogram based on three inflammatory-related methylation sites (cg03610073, cg03208951, and cg18746357) in intraoperative visceral adipose tissue can predict one-year EWL% after LSG effectively.
Data Sharing Statement
The data presented in this study are available in article and Supplementary Material. Further inquiries can be directed to the corresponding authors.
Ethics Approval and Consent to Participate
The Institutional Review Board (IRB) of Beijing Shijitan Hospital approved this study (Approval No. sjtkyll-lx-2019-58). All procedures performed in studies involving human participants were following the ethical standards of the institutional and/or national research committee and with the 1964 Helsinki declaration and its later amendments or comparable ethical standards.
Author Contributions
All authors made a significant contribution to the work reported, whether that is in the conception, study design, execution, acquisition of data, analysis and interpretation, or in all these areas; took part in drafting, revising or critically reviewing the article; gave final approval of the version to be published; have agreed on the journal to which the article has been submitted; and agree to be accountable for all aspects of the work.
Disclosure
The authors declare no potential conflicts of interest with respect to the research, authorship, and/or publication of this article.
Acknowledgment
The abstract of this paper was presented at “7th IFSO APC Meeting 2022” as a conference talk titled “Establishment of a nomogram based on inflammation-related methylation sites in intraoperative visceral adipose tissue to predict EWL% after LSG” with interim findings. The conference talk’s abstract was published in “7th IFSO APC Meeting 2022” in “BMS”: https://doi.org/10.1007/s11695-022-06370-9.
Additional information
Funding
References
- Caballero B. Humans against obesity: who will win? Adv Nutr. 2019;10(suppl_1):S4–S9. doi:10.1093/advances/nmy055
- Koliaki C, Liatis S, Kokkinos A. Obesity and cardiovascular disease: revisiting an old relationship. Metabolism. 2019;92:98–107. doi:10.1016/j.metabol.2018.10.011
- Hardy OT, Czech MP, Corvera S. What causes the insulin resistance underlying obesity? Curr Opin Endocrinol Diabetes Obes. 2012;19(2):81–87. doi:10.1097/MED.0b013e3283514e13
- Kawai T, Autieri MV, Scalia R. Adipose tissue inflammation and metabolic dysfunction in obesity. Am J Physiol Cell Physiol. 2021;320(3):C375–C391. doi:10.1152/ajpcell.00379.2020
- Kloting N, Bluher M. Adipocyte dysfunction, inflammation and metabolic syndrome. Rev Endocr Metab Disord. 2014;15(4):277–287. doi:10.1007/s11154-014-9301-0
- Kranendonk ME, van Herwaarden JA, Stupkova T, et al. Inflammatory characteristics of distinct abdominal adipose tissue depots relate differently to metabolic risk factors for cardiovascular disease: distinct fat depots and vascular risk factors. Atherosclerosis. 2015;239(2):419–427. doi:10.1016/j.atherosclerosis.2015.01.035
- Schauer PR, Bhatt DL, Kirwan JP, et al. Bariatric surgery versus intensive medical therapy for diabetes - 5-year outcomes. N Engl J Med. 2017;376(7):641–651. doi:10.1056/NEJMoa1600869
- American College of Cardiology/American Heart Association Task Force on Practice Guidelines OEP. Executive summary: guidelines (2013) for the management of overweight and obesity in adults: a report of the American College of Cardiology/American Heart Association Task Force on Practice Guidelines and the Obesity Society published by the Obesity Society and American College of Cardiology/American Heart Association Task Force on Practice Guidelines. Based on a systematic review from the The Obesity Expert Panel, 2013. Obesity. 2014;22(Suppl 2):S5–39. doi:10.1002/oby.20821
- Schernthaner G, Morton JM. Bariatric surgery in patients with morbid obesity and type 2 diabetes. Diabetes Care. 2008;31(Suppl 2):S297–302. doi:10.2337/dc08-s270
- Ghiassi S, Morton JM. Safety and efficacy of bariatric and metabolic surgery. Curr Obes Rep. 2020;9(2):159–164. doi:10.1007/s13679-020-00377-y
- Angrisani L, Santonicola A, Iovino P, et al. Bariatric surgery and endoluminal procedures: IFSO worldwide survey 2014. Obes Surg. 2017;27(9):2279–2289. doi:10.1007/s11695-017-2666-x
- Robinson AH, Adler S, Stevens HB, Darcy AM, Morton JM, Safer DL. What variables are associated with successful weight loss outcomes for bariatric surgery after 1 year? Surg Obes Relat Dis. 2014;10(4):697–704. doi:10.1016/j.soard.2014.01.030
- Shi J, Bao G, Hong J, et al. Deciphering CT texture features of human visceral fat to evaluate metabolic disorders and surgery-induced weight loss effects. EBioMedicine. 2021;69:103471. doi:10.1016/j.ebiom.2021.103471
- Rinella ES, Still C, Shao Y, et al. Genome-wide association of single-nucleotide polymorphisms with weight loss outcomes after Roux-en-Y gastric bypass surgery. J Clin Endocrinol Metab. 2013;98(6):E1131–1136. doi:10.1210/jc.2012-3421
- Moore BS, Mirshahi UL, Yost EA, et al. Long-term weight-loss in gastric bypass patients carrying melanocortin 4 receptor variants. PLoS One. 2014;9(4):e93629. doi:10.1371/journal.pone.0093629
- Moore LD, Le T, Fan G. DNA methylation and its basic function. Neuropsychopharmacology. 2013;38(1):23–38. doi:10.1038/npp.2012.112
- Ling C, Groop L. Epigenetics: a molecular link between environmental factors and type 2 diabetes. Diabetes. 2009;58(12):2718–2725. doi:10.2337/db09-1003
- Wahl S, Drong A, Lehne B, et al. Epigenome-wide association study of body mass index, and the adverse outcomes of adiposity. Nature. 2017;541(7635):81–86. doi:10.1038/nature20784
- Paul L, van der Heiden C, van Hoeken D, et al. Cognitive behavioral therapy versus usual care before bariatric surgery: one-year follow-up results of a randomized controlled trial. Obes Surg. 2021;31(3):970–979. doi:10.1007/s11695-020-05081-3
- Puzziferri N, Roshek TB, Mayo HG, Gallagher R, Belle SH, Livingston EH. Long-term follow-up after bariatric surgery: a systematic review. JAMA. 2014;312(9):934–942. doi:10.1001/jama.2014.10706
- King WC, Hinerman AS, Belle SH, Wahed AS, Courcoulas AP. Comparison of the performance of common measures of weight regain after bariatric surgery for association with clinical outcomes. JAMA. 2018;320(15):1560–1569. doi:10.1001/jama.2018.14433
- Kermansaravi M, Parmar C, Chiappetta S, et al. Best practice approach for redo-surgeries after sleeve gastrectomy, an expert’s modified Delphi consensus. Surg Endosc. 2023;37(3):1617–1628. doi:10.1007/s00464-023-09879-x
- Samblas M, Milagro FI, Martinez A. DNA methylation markers in obesity, metabolic syndrome, and weight loss. Epigenetics. 2019;14(5):421–444. doi:10.1080/15592294.2019.1595297
- Gregor MF, Hotamisligil GS. Inflammatory mechanisms in obesity. Annu Rev Immunol. 2011;29:415–445. doi:10.1146/annurev-immunol-031210-101322
- Faenza M, Benincasa G, Docimo L, Nicoletti GF, Napoli C. Clinical epigenetics and restoring of metabolic health in severely obese patients undergoing batriatric and metabolic surgery. Updates Surg. 2022;74(2):431–438. doi:10.1007/s13304-021-01162-9
- Pepin ME, Infante T, Benincasa G, et al. Differential DNA methylation encodes proliferation and senescence programs in human adipose-derived mesenchymal stem cells. Front Genet. 2020;11:346. doi:10.3389/fgene.2020.00346
- Simpson ME, Petri WA. TLR2 as a Therapeutic Target in Bacterial Infection. Trends Mol Med. 2020;26(8):715–717. doi:10.1016/j.molmed.2020.05.006
- Siklova M, Krauzova E, Svobodova B, et al. Circulating monocyte and lymphocyte populations in healthy first-degree relatives of type 2 diabetic patients at fasting and during short-term hyperinsulinemia. Mediators Inflamm. 2019;2019:1491083. doi:10.1155/2019/1491083
- Ahmad R, Al-Mass A, Atizado V, et al. Elevated expression of the toll like receptors 2 and 4 in obese individuals: its significance for obesity-induced inflammation. J Inflamm. 2012;9(1):48. doi:10.1186/1476-9255-9-48
- Tornatore L, Thotakura AK, Bennett J, Moretti M, Franzoso G. The nuclear factor kappa B signaling pathway: integrating metabolism with inflammation. Trends Cell Biol. 2012;22(11):557–566. doi:10.1016/j.tcb.2012.08.001
- Engin A. The pathogenesis of obesity-associated adipose tissue inflammation. Adv Exp Med Biol. 2017;960:221–245. doi:10.1007/978-3-319-48382-5_9
- Kusumoto Y, Okuyama H, Shibata T, et al. Epithelial membrane protein 3 (Emp3) downregulates induction and function of cytotoxic T lymphocytes by macrophages via TNF-alpha production. Cell Immunol. 2018;324:33–41. doi:10.1016/j.cellimm.2017.12.001
- Bonnett LJ, Snell KIE, Collins GS, Riley RD. Guide to presenting clinical prediction models for use in clinical settings. BMJ. 2019;365:l737. doi:10.1136/bmj.l737
- Stromberg SE, Gonzalez-Louis R, Engel M, Mathews A, Janicke DM. Pre-surgical stress and social support predict post-surgical percent excess weight loss in a population of bariatric surgery patients. Psychol Health Med. 2020;25(10):1258–1265. doi:10.1080/13548506.2020.1734216
- Athanasiadis DI, Hernandez E, Monfared S, et al. Bariatric surgery outcomes: is age just a number? Surg Endosc. 2021;35(6):3139–3146. doi:10.1007/s00464-020-07752-9
- Cummings DE, Rubino F. Metabolic surgery for the treatment of type 2 diabetes in obese individuals. Diabetologia. 2018;61(2):257–264. doi:10.1007/s00125-017-4513-y
- Tian Z, Zhang YC, Wang Y, Chang XH, Zhu HL, Zhao Y. Effects of bariatric surgery on patients with obesity and polycystic ovary syndrome: a meta-analysis. Surg Obes Relat Dis. 2021;17(8):1399–1408. doi:10.1016/j.soard.2021.04.009