
Abstract
Purpose
Studies have shown that atherosclerotic plaques are associated with changes in the microbial composition of the intestinal flora and obesity, and that the small intestine plays an irreplaceable role in regulating intestinal flora homeostasis, but the role of the small intestine in the development of obesity-related atherosclerosis remains understudied. Therefore, this study explores the role of the small intestine in obesity-induced atherosclerosis and its molecular mechanisms.
Methods
In the GSE59054 data, small intestine tissue samples from 3 normal and 3 obese mice were analyzed using bioinformatics methods. Screening for differentially expressed genes (DEGs) using the GEO2R tool. The DEGs were next processed for bioinformatics analysis. We constructed an obese mouse model and measured aortic arch pulse wave velocity (PWV). Aortic and small intestine tissues were stained with hematoxylin-eosin (HE) to observe pathological changes. Finally, immunohistochemistry was performed to verify the expression of small intestinal proteins.
Results
We identified a total of 122 DEGs. Pathway analysis revealed that BMP4, CDH5, IL1A, NQO1, GSTM1, GSTA3, CAV1 and MGST2 were mainly enriched in the Fluid shear stress and atherosclerosis pathway. In addition, BMP4, NQO1 and GSTM1 are closely related to atherosclerosis. Ultrasound and pathological findings suggest the presence of obesity atherosclerosis. Immunohistochemistry verified high expression of BMP4 and low expression of NQO1 and GSTM1 in obese small intestine tissues.
Conclusion
The altered expression of BMP4, NQO1 and GSTM1 in small intestine tissues during obesity may be related to atherosclerosis, and Fluid shear stress and atherosclerosis pathway may be the molecular mechanism of their role.
Introduction
Obesity has become the most widespread non-communicable disease in the world and is currently the primary health issue that needs to be addressed by public health worldwide as a result of the continued expansion of human society and the rise of high sugar and high fat eating patterns.Citation1 The Global Collaboration on Obesity in Disease estimates that more than 603.7 million adults are obese, causing 4 million deaths in 2015, two-thirds of which were due to cardiovascular disease.Citation2,Citation3 Current studies have shown the presence of a low inflammatory state in the body in the presence of obesity, which, due to this inflammation, makes obese patients a risk group for cardiovascular diseases, metabolic diseases and some oncological diseases.Citation4,Citation5 In addition, the increase in adipose tissue in obesity lead to an increase in the secretion of adipokines, most of which have a pro-inflammatory effect, which may also contribute to insulin resistance, endothelial dysfunction and atherosclerosis formation in obese patients.Citation6,Citation7 Another important change in obesity is the increase in blood lipid levels, which are also closely related to atherosclerosis,Citation8 making obesity a strong risk factor for atherosclerosis. Although the idea of an obesity paradox has existed in the past, studies have debunked this idea, showing that cardiovascular disease risk increases with increasing body mass index (BMI) when BMI exceeds 22–23 kg/m2.Citation9 Therefore, weight loss is an effective means of preventing cardiovascular disease. Currently, the basic treatment for obesity is weight loss (lifestyle changes, drugs or surgery), and since drugs and surgery have a certain degree of indications and are not suitable for all obese patients, weight loss through lifestyle changes is currently the mainstream treatment for obesity. Although significant weight loss is achieved by diet restriction and increased physical activity, studies have shown that this approach does not improve the atherosclerosis that has developed in obese mice.Citation10 Therefore, there is still a need for further experiments to investigate this mechanism.
The small intestine is the main digestive organ of the body and has an important role in the process of digestion and absorption of many nutrients, so the dysfunction of the small intestine can lead to the development of various diseases.Citation11 Similarly high-fat diet can also damage the function of the small intestine and thus participate in the development of obesity. Numerous differences in intestinal morphology and function between obese patients and the normal population have been well elucidated.Citation12 Studies surface longer intestinal length, increased enterocyte mass and increased intestinal permeability in obese patients.Citation1 The small intestine of animal models of obesity behaves similarly. In laboratory rats’ obesity models lead to intestinal cell proliferation and increased villi length compared to normal rats.Citation13 Obese mouse models also show an increase in intestinal absorptive capacity and permeability. Current speculation about the adaptive changes occurring in the intestine may be due to the hyperphagia that occurs with obesity,Citation14 but the exact mechanisms need to be further explored.
With the continuous development of omics techniques in recent years, gut microbes have been found to be closely associated with a variety of diseases, such as: obesity, cardiovascular diseases and diabetes.Citation15–17 Obesity caused by altered dietary patterns inevitably leads to alterations in gut microbes, and studies have shown that changes in bacterial strains in the human gut are believed to play a pathogenic role in obesity.Citation18 It is now believed that dysbiosis can alter the function of the intestinal barrier and the function of the gut-associated lymphoid tissue (GALT), allowing structural components of bacteria to pass through the intestinal mucosal barrier, which may lead to the development of insulin resistance and inflammation.Citation19 However, there are relatively few studies on whether dysbiosis of the intestinal flora due to altered dietary composition can cause changes in the expression of certain proteins in the gut that can cause atherosclerosis.
In this study we used bioinformatics to screen the differentially expressed genes (DEGs) in the small intestinal tissues of obese mice and normal mice, and performed pathway and disease enrichment analysis to discover diseases closely related to DEGs and their associated pathways, and finally further verified the protein expression by immunohistochemical staining, thus providing new ideas to explore the mechanism of obesity and atherosclerosis.
Materials and Methods
Data Source
Gene Expression Omnibus (GEO) database (https://www.ncbi.nlm.nih.gov/geo/) was used to perform the search for relevant data. The purpose of this study was to investigate the effect of obesity on gene expression in the small intestine of mice, so GSE59054 data were downloaded from the GEO database. The data contained 3 mice on normal diet and 3 mice on high-fat diet, and small intestine samples were collected. The data are based on the GPL11533 platform [MoGene-1_1-st] Affymetrix Mouse Gene 1.1 ST Array [transcript (gene) version].
Differential Expression Analysis
The genetic matrix file and the platform file z were downloaded in the GEO database. The missing values were filled using an estimation package based on the KNN (k-nearest neighbor) algorithm. After that, the probes are converted to gene symbols based on the annotated platform file. If there are multiple probes corresponding to a gene, the average value is taken as the final value. If there are no probes with gene symbols they are removed. The data were normalized by applying the normalized inter-array function in the limma package. The expression data were then log-transformed and the differences between the two groups were compared using the limma function package in the R software to determine the DEGs. The Benjamini and Hochberg (false discovery rate) method is used to calculate the adjusted P value. |log2 FC| > 1 and adjusted P value < 0.05 were considered as the screening criteria for DEGs. Finally, the complete DEGs data is obtained for the next step of analysis.
Enrichr Analysis
Enrichr is a comprehensive web-based gene set enrichment analysis tool for curated genomic and search engines to accumulate biological knowledge for further biological discovery, which contains Gene Ontology (GO), Kyoto Encyclopedia of Genes and Genomes (KEGG) pathway and disease enrichment analysis content. In brief, open the Enrichr website (http://amp.pharm.mssm.edu/Enrichr) to submit the list of DEGs we filtered. Then, you can see that it contains the GO, KEGG analysis results. Finally, the obtained results are exported. The Benjamini and Hochberg (false discovery rate) method is used to calculate the adjusted P value. The screening criteria for all items were P < 0.05.
DisGeNET Analysis
The genetic basis of human diseases is at the heart of precision medicine and drug discovery. Data availability, fragmentation, heterogeneity, and inconsistency in concept descriptions are problems that must be overcome for disease mechanism research. DisGeNET (http://www.disgenet.org) is a database developed to help researchers overcome these obstacles by collecting a large number of variants and genes associated with human diseases. The summary steps are to install the disgenet2r package on R, then enter the DEGs to search the DisGeNET database, and finally export and visualize the resulting data.
Data Visualization
Bioinformatics (http://www.bioinformatics.com.cn/) uses online graphing and data analysis as a basic way to help researchers in life sciences and medicine to analyze data more easily, understand the data, and explore the biological meaning behind the data. The online tool is used for data visualization.
Obesity Model
A high-fat diet feeding method was utilized to construct an obese mouse model. A total of 16 6-week-old male C57/bl6 mice were purchased from Hebei Ivevo Biotechnology Co. After 1 week of adaptive feeding, the mice were randomly divided into normal diet group (NCD group) and high-fat diet group (HFD group). The NCD group was still fed with normal diet (Energy supply ratio: protein 27.38%, fat 14.5%, carbohydrate 58.12%), and the HFD group was fed with high-fat diet (Energy supply ratio: protein 20%, carbohydrate 20%, fat 60%) for 24 weeks. Both were purchased from Beijing Huafukang Biotechnology Co. Ltd. (Beijing, China). All mice were housed in a sterile environment with 12h daytime and 12h nighttime cycles and free access to food and water. The Animal Ethics Association of the Hebei General Hospital approved this experiment (no. 202065).
Ultrasonography
To assess the degree of aortic sclerosis, the pulse wave velocity (PWV) of the aortic arch was measured. The day before performing the ultrasound the mice were depilated on the chest, anesthetized using isopentane, and when the mice were fully anesthetized, they were placed on a thermostatic operating table and ultrasounded using a Visual Sonics Vevo 2100 ultrasound machine, and data were recorded. PWV is calculated by measuring the ratio of time difference to distance of the pressure pulse in the aortic arch and its descending aorta distal to 35mm.
Sample Preparation
After the mice were fully anesthetized, the mice were placed on ice, the abdominal and thoracic cavities were opened, and the small intestinal aorta was taken out respectively. A portion of the obtained small intestine and aorta was immersed in 4% paraformaldehyde for subsequent pathological analysis, and the rest of the tissues was frozen in a −80°C refrigerator.
Hematoxylin-Eosin (HE) and Masson Staining
Pathological changes in the small intestine and aorta were assessed by HE staining. Small intestine and aorta immersed in paraformaldehyde were taken out, routinely processed, embedded in wax blocks, and then cut into 4–5μm sections using a microtome. Sections were dewaxed in xylene and treated with ethanol water and then stained with hematoxylin and eosin and observed microscopically. In addition, aortic tissue was stained with Masson’s trichrome stain and the extent of fibrosis in the tissue was observed from 3 random areas to determine the area of fibrosis.
Electron Microscopy
The thoracic aorta was transected, then fixed with electron microscope fixative, subsequently embedded and cut into 50nm sections and stained with 3% uranyl acetate and lead citrate. Finally, they were observed using transmission electron microscopy.
Immunohistochemistry
BMP4, NQO1 and GSTM1 expression was assessed using immunohistochemistry. The experimental procedures were performed strictly according to the steps required by the immunohistochemistry kit. Diluted primary antibodies BMP4 (1:200), NQO1 (1:200) and GSTM1 (1:200) were added dropwise and stored overnight in a refrigerator at 4 °C. Biotin-labeled secondary anti-goat anti-rabbit IgG (1:2000) was added dropwise, incubated at 37 °C for 30 min, washed with PBS, developed with DAB chromogen, re-stained with hematoxylin, dehydrated, transparent and sealed, observed by light microscopy and images were collected. The H-SCORE values were calculated according to the formula of H-SCORE=∑(pi×i)=(percentage of weak intensity ×1)+(percentage of moderate intensity ×2)+(percentage of strong intensity ×3). The three protein assays were repeated three times and the H-SCORE values were calculated and averaged by two different experimenters.
Data Analysis
All data were statistically analyzed using GraphPad 8.0 software, with mean ± standard deviation as the data presentation. Unpaired t-test was used to perform statistical tests on the data. We defined the difference between groups as statistically significant when P < 0.05.
Results
Identification of DEGs
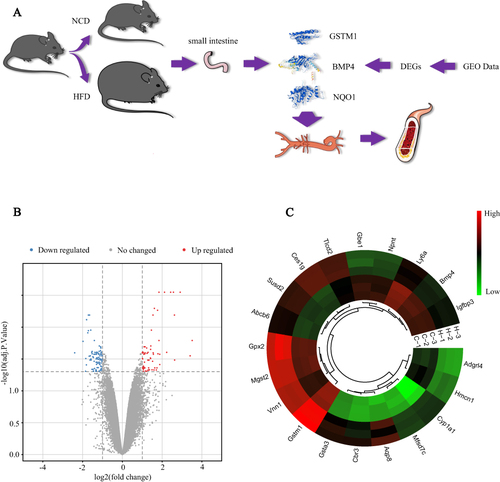
presents the overall flow of this study. After data processing, a total of 122 DEGs were identified in the high-fat and control groups, including 45 up-regulated genes and 77 down-regulated genes. The volcano map and heat map of the differential genes are shown in and .
Figure 1 Study flowchart and visualization of DEGs. (A) Experimental flowchart; (B) Volcano map of the screened DEGs; (C) Circular heatmaps of the top 20 DEGs, C-1, C-2 and C-3 represent three different samples in NCD; N-1, N-2 and N-3 represent three different samples in HFD. The screening criteria for DEGs were defined as adjusted p value < 0.05 and |log 2foldchange (FC)| ≥ 1. DEGs were screened based on small intestinal tissue from NCD and HFD mice.
Functional Enrichment Analysis
The Enrichr database contains enrichment analysis content and was used for GO enrichment analysis of differential genes. Biological processes (BP) is mainly enriched in cellular response to type I interferon, type I interferon signaling pathway and glutathione metabolic process (); molecular function (MF) is mainly enriched in glutathione transferase activity, androsterone dehydrogenase activity and oxidoreductase activity, acting on the CH-OH group of donors, NAD or NADP as acceptor (); cellular component (CC) is mainly enriched in collagen-containing extracellular matrix, cell projection membrane and endoplasmic reticulum lumen ().
Figure 2 Results of bioinformatics analysis of DEGs. GO enrichment analysis of DEGs divided DEGs into three functional groups: BP (A), CC (B), and MC (C). (D) Top 10 KEGG pathway enrichment results. The horizontal coordinate represents the ratio of DEGs enriched in an item to the total number of genes in that item. (E) Disease enrichment analysis results. The horizontal coordinate represents the number of genes associated with the disease in the DEGs.
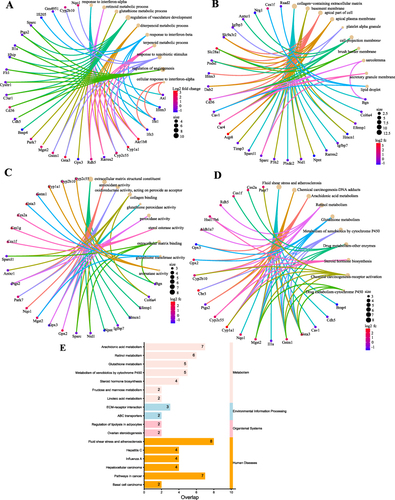
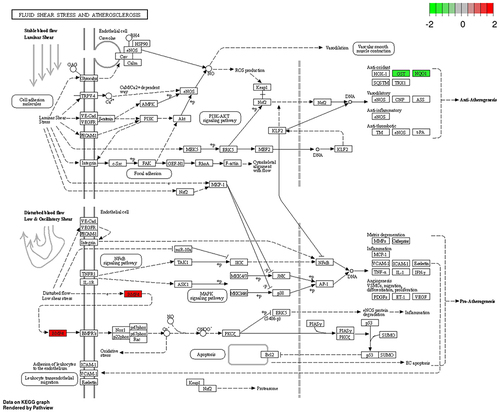
KEGG pathway enrichment was discovered using the Enrichr database, whose database contains the most up-to-date information on the pathway. KEGG pathway is mainly Arachidonic acid metabolism, Chemical carcinogenesis and Fluid shear stress and atherosclerosis. BMP4, CDH5, IL1A, NQO1, GSTM1, GSTA3, CAV1 and MGST2 were closely associated with the Fluid shear stress and atherosclerosis pathway (P<0.01), so this pathway was selected for the next study ().
DisGeNet is a database of genes and mutation loci associated with human diseases, and our disease enrichment analysis revealed that the top three diseases associated with differential genes were: Liver diseases, Atherosclerosis and Liver Cirrhosis, Experimental (). A total of 25 genes were strongly associated with Atherosclerosis (P<0.01), so we speculate that obesity is closely associated with Atherosclerosis, and combined with KEGG pathway analysis, we finally concluded that BMP4, NQO1 and GSTM1 are the key genes of obesity causing Atherosclerosis ().
Figure 3 Fluid shear stress and atherosclerotic pathways.Citation44 In the HFD/NCD group, red indicates up-regulated expression and green indicates down-regulated expression.
Obesity Model
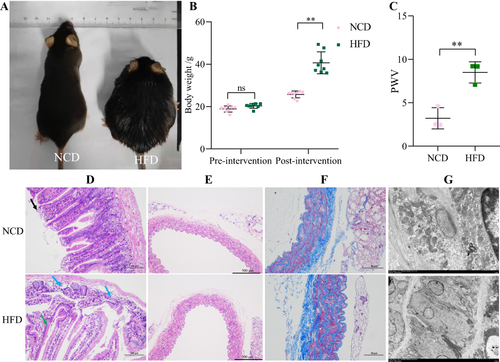
The body weight of mice in the NCD and HFD groups before high-fat chow feeding was not statistically significant (P>0.05). After 24 weeks of high-fat diet feeding, mice in the HFD group had significantly higher body weight (P<0.01) ( and ). Ultrasonography showed that PWV was significantly higher in obese mice than in controls, suggesting the presence of atherosclerosis ().
Figure 4 Body weight and pathological changes. (A) Gross morphology of representative mice in the NCD and HFD groups. (B) Body weight changes of mice in the NCD and HFD groups. (C) Aortic arch pulse wave velocity (PWV). (D) HE staining of small intestinal tissues. Black arrow: mucosal epithelial cells at the tip of the intestinal villi are shed. Blue arrow: loss of glandular structures. Green arrow: loss of intestinal villi. (E) HE staining of aortic tissue. (F) Masson staining of aortic tissue. (G) Aortic transmission electron microscopy. **P < 0.01.
Pathological Examination
The results of small intestine HE staining showed that the apical part of the small intestine in the NCD group was autolysed and lightly colored; individual mucosal epithelial cells were detached from the apical part of the intestinal villi (black arrow); the glands were closely arranged and no obvious damage or inflammatory cell infiltration was observed. In the HFD group, the apical mucosal epithelium of the small intestinal tissue was mildly separated from the lamina propria; individual glandular structures were locally lost (blue arrows) and individual intestinal villi were detached (green arrows); there was no obvious inflammatory cell infiltration (). The aortic staining results showed that obesity increased the intimal thickness of the aorta and slightly disturbed the elastic fiber arrangement (). Masson staining showed that aortic collagen content was significantly increased in the HFD group, compared to the NCD group (). Electron microscopic results showed that the aortic vascular endothelial cells in the HFD group showed a moderate to severe edema state, with a slightly thickened, intact and continuous inner elastic membrane locally. Endothelial cell membranes were intact, tight intercellular junctions were locally visible, intracellular matrix electron density was locally reduced, and organelle swelling was more severe ().
Immunohistochemistry
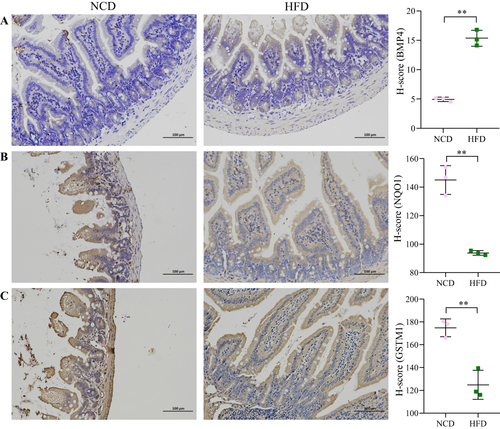
The expression of BMP4, NQO1 and GSTM1 in small intestinal tissues was detected using immunohistochemistry. Our results showed that obesity increased BMP4 expression (P<0.01) and decreased NQO1 and GSTM1 expression (P<0.01) ().
Figure 5 Expression of BMP4, NQO1 and GSTM1. (A) BMP4. (B) NQO1. (C) GSTM1. Scale bar 100µm. The vertical coordinate indicates the H-score of protein expression. **P < 0.01.
Discussion
Atherosclerosis is a prevalent chronic inflammatory disease of the arterial wall, manifested mainly by lesions and plaque formation in the inner layers of the arterial wall.Citation20 Atherosclerosis has a complex pathogenesis, the main mechanisms of which are lipid plaque formation and chronic inflammation. Atherosclerosis is a major cause of many cardiovascular lesions, such as myocardial infarction, stroke and peripheral vascular disease.Citation21,Citation22 Current research on the gut microbiota, the collection of bacteria residing in the gastrointestinal tract, suggests that the dynamic balance of the gut flora is essential for human health, and numerous studies have elucidated the role of gut flora disorders in the development of obesity and cardiovascular disease.Citation23,Citation24 While atherosclerosis is a risk factor for cardiovascular diseases, there is also a close association between intestinal flora and atherosclerosis.Citation25 Many investigators have reported that cardiovascular disease is associated with changes in the relative abundance of specific microbial taxa or in the abundance or diversity of intestinal bacteria. Recent studies have shown that bacterial genes have been detected in atherosclerotic plaques and that their characteristics are associated with changes in the microbial composition of the gut flora.Citation26 In addition, gut microbes have been associated with increased thrombosis rates and prolonged flow arrest in microbial transplantation studies.Citation27 As an important digestive organ, the small intestine plays an irreplaceable role in the regulation of the balance of intestinal flora, but the role of the small intestine in the development of atherosclerosis is still not sufficiently studied.
To explore the association between small intestine and obesity-induced atherosclerosis, we performed an in-depth analysis of GSE59054 data. We found that a total of 122 DEGs were identified in the small intestine of obese mice compared to normal mouse small intestine tissue. The screened DEGs contained 45 up-regulated genes and 77 down-regulated genes. KEGG and DisGeNET enrichment analysis of DEGs revealed that these DEGs were closely associated with atherosclerosis and that BMP4, NQO1 and GSTM1 were enriched in the Fluid shear stress and atherosclerosis pathway, so we hypothesized that BMP4, NQO1 and GSTM1 expressed in small intestinal tissues might be involved in the development of atherosclerosis in obesity through this pathway. Subsequently, we identified the presence of atherosclerosis by analysis of the aorta of obese mice, while the altered expression of BMP4, NQO1 and GSTM1 in the small intestine was determined by immunohistochemistry. All these results support our hypothesis.
Bone morphogenetic protein 4 (BMP4) was originally discovered as an osteoinducible protein, a member of the transforming growth factor-β (TGF-β) superfamily.Citation28 Transcriptomic analysis revealed that BMP4 induces inflammation in endothelial cells, mainly by activating NADPH oxidase causing an increased production of reactive oxygen molecules, thus playing a role in the early development of atherosclerosis.Citation29,Citation30 Another study found an abundant expression of BMPs at sites of atherosclerotic vascular calcification, which is considered to be an important contribution to the pathophysiology of atherosclerosis.Citation31 In addition, for BMP4 knockdown in perivascular adipose tissue of ApoE-/- mice was found to significantly increase the levels of inflammatory factors in vivo and lead to a significant increase in atherosclerotic plaque formation.Citation32 The present study also found a significant increase in the level of BMP4 expressed in the small intestine of obese mice, thus giving us reason to believe that intestine-derived BMP4 plays an important role in obesity-induced atherosclerosis.
Nicotinamide adenine dinucleotide phosphate: quinone oxidoreductase 1 (NQO1) is commonly considered as a detoxifying enzyme because of its ability to reduce reactive quinones and quinoneimines to less reactive and less toxic hydroquinones.Citation33 Studies have shown that NQO1 is highly expressed in myocardial and vascular tissues and can act as a superoxide scavenger and prevent ROS production, thus maintaining vascular homeostasis.Citation34,Citation35 The cardiovascular protective effects of NQO1 have been further confirmed in recent years, and the use of NQO1 can slow down lipoprotein oxidation and thus prevent atherosclerosis, which is reckoned as one of the possible therapeutic approaches for atherosclerosis.Citation36,Citation37 In addition NQO1 is closely related to Nuclear factor erythroid 2-related factor 2 (Nrf2), and the relationship between the latter and atherosclerosis has been widely demonstrated.Citation38,Citation39 Our assay of NQO1 expressed in the small intestine revealed that obesity significantly reduced NQO1 expression, suggesting that it may be a key protein in the link between obesity and atherosclerosis.
Glutathione S-transferases (GSTs) are a family of enzymes implicated in oxidative stress defense.Citation40 Glutathione S-transferase-μ1 (GSTM1) belongs to the glutathione S-transferase superfamily and can metabolize a variety of reactive oxygen species and their metabolites.Citation41 Numerous studies have shown that downregulation of GSTM1 or gene mutations can promote the development of atherosclerosis.Citation42,Citation43 We also found by immunohistochemistry that obesity significantly reduced the expression of GSTM1 in the small intestine.
In summary, we found that obesity significantly decreased the expression of NQO1 and GSTM1, which are cardiovascular protective substances, and increased the expression of BMP4 in the small intestine. We also found that BMP4, NQO1 and GSTM1 were enriched in the Fluid shear stress and atherosclerosis pathway, so it is speculated that BMP4, NQO1 and GSTM1 may be involved in the pathological process of atherosclerosis through the Fluid shear stress and atherosclerosis pathway. More studies are needed in the future to verify the correlation between small intestinal BMP4, NQO1 and GSTM1 expression with atherosclerosis. Whether the pathological process of atherosclerosis can be delayed or reversed by altering the expression of BMP4, NQO1 and GSTM1 in the small intestine of obese individuals. Our study also has some limitations: 1) Further studies, such as cellular experiments, are needed to verify this mechanism. 2) The sample size is small and a larger sample may be needed to verify this finding. 3) Oil red O staining as well as functional tests of the aorta may be performed to determine the presence of aortic atherosclerosis.
Conclusions
Altered expression of BMP4, NQO1 and GSTM1 in the small intestine of obesity may be involved in the pathological process of atherosclerosis through Fluid shear stress and atherosclerotic pathways. This study may provide a new target for the treatment of obesity-induced atherosclerosis and new insights into the treatment of clinical obesity and atherosclerosis.
Ethics Approval and Consent to Participate
All aspects of animal care and the experimental protocols to which they were subjected to were approved by the Animal Ethics Committee of Hebei General Hospital and conducted in accordance with the Guide for the Care and Use of Laboratory Animals, published by the US National Institutes of Health (NIH Publication No. 85-23, revised 1996). ARRIVE guidelines were followed as well. All efforts were made to minimize animal suffering.
Disclosure
The authors declare that they have no conflicts of interest in this work.
Data Sharing Statement
The data presented in this study are available on request from the corresponding author.
Additional information
Funding
References
- Ding S, Lund PK. Role of intestinal inflammation as an early event in obesity and insulin resistance. Curr Opin Clin Nutr Metab Care. 2011;14(4):328–333. doi:10.1097/MCO.0b013e3283478727
- Piché ME, Tchernof A, Després JP. Obesity phenotypes, diabetes, and cardiovascular diseases. Circ Res. 2020;126(11):1477–1500. doi:10.1161/CIRCRESAHA.120.316101
- Mozo MV, Finucane FM, Flaherty GT. Health challenges of international travel for obese patients. J Travel Med. 2017;24(6). doi:10.1093/jtm/tax065
- Pan X, Yue L, Ban J, Ren L, Chen S. Effects of semaglutide on cardiac protein expression and cardiac function of obese mice. J Inflamm Res. 2022;15:6409–6425. doi:10.2147/JIR.S391859
- Kawai T, Autieri MV, Scalia R. Adipose tissue inflammation and metabolic dysfunction in obesity. Am J Physiol Cell Physiol. 2021;320(3):C375–C391. doi:10.1152/ajpcell.00379.2020
- Lovren F, Teoh H, Verma S. Obesity and atherosclerosis: mechanistic insights. Can J Cardiol. 2015;31(2):177–183. doi:10.1016/j.cjca.2014.11.031
- Curley S, Gall J, Byrne R, Yvan-Charvet L, McGillicuddy FC. Metabolic inflammation in obesity-at the crossroads between fatty acid and cholesterol metabolism. Mol Nutr Food Res. 2021;65(1):e1900482. doi:10.1002/mnfr.201900482
- Zhang T, Chen J, Tang X, Luo Q, Xu D, Yu B. Interaction between adipocytes and high-density lipoprotein: new insights into the mechanism of obesity-induced dyslipidemia and atherosclerosis. Lipids Health Dis. 2019;18(1):223. doi:10.1186/s12944-019-1170-9
- Iliodromiti S, Celis-Morales CA, Lyall DM, et al. The impact of confounding on the associations of different adiposity measures with the incidence of cardiovascular disease: a cohort study of 296 535 adults of white European descent. Eur Heart J. 2018;39(17):1514–1520. doi:10.1093/eurheartj/ehy057
- Inoue KI, Toyoda S, Jojima T, Abe S, Sakuma M, Inoue T. Time-restricted feeding prevents high-fat and high-cholesterol diet-induced obesity but fails to ameliorate atherosclerosis in apolipoprotein E-knockout mice. Exp Anim. 2021;70(2):194–202. doi:10.1538/expanim.20-0112
- Singer-Englar T, Barlow G, Mathur R. Obesity, diabetes, and the gut microbiome: an updated review. Expert Rev Gastroenterol Hepatol. 2019;13(1):3–15. doi:10.1080/17474124.2019.1543023
- Dailey MJ. Nutrient-induced intestinal adaption and its effect in obesity. Physiol Behav. 2014;136:74–78. doi:10.1016/j.physbeh.2014.03.026
- Wan X, Yin J, Chen J. Characteristics of intestinal myoelectrical and motor activities in diet-induced obese rats: obesity and motility. Dig Dis Sci. 2019;64(6):1478–1485. doi:10.1007/s10620-019-5458-4
- Ye C, Liu L, Ma X, et al. Obesity aggravates acute pancreatitis via damaging intestinal mucosal barrier and changing microbiota composition in rats. Sci Rep. 2019;9(1):69. doi:10.1038/s41598-018-36266-7
- Tang WHW, Bäckhed F, Landmesser U, Hazen SL. Intestinal microbiota in cardiovascular health and disease: JACC state-of-the-art review. J Am Coll Cardiol. 2019;73(16):2089–2105. doi:10.1016/j.jacc.2019.03.024
- Tilg H, Adolph TE, Gerner RR, Moschen AR. The intestinal microbiota in colorectal cancer. Cancer Cell. 2018;33(6):954–964. doi:10.1016/j.ccell.2018.03.004
- Alvarez-Vieites E, López-Santamarina A, Miranda JM, et al. Influence of the intestinal microbiota on diabetes management. Curr Pharm Biotechnol. 2020;21(15):1603–1615. doi:10.2174/1389201021666200514220950
- Gomes AC, Hoffmann C, Mota JF. The human gut microbiota: metabolism and perspective in obesity. Gut Microbes. 2018;9(4):308–325. doi:10.1080/19490976.2018.1465157
- Abenavoli L, Scarpellini E, Colica C, et al. Gut microbiota and obesity: a role for probiotics. Nutrients. 2019;11(11):2690. doi:10.3390/nu11112690
- Poznyak A, Grechko AV, Poggio P, Myasoedova VA, Alfieri V, Orekhov AN. The diabetes mellitus-atherosclerosis connection: the role of lipid and glucose metabolism and chronic inflammation. Int J Mol Sci. 2020;21(5):1835. doi:10.3390/ijms21051835
- Williams JW, Winkels H, Durant CP, Zaitsev K, Ghosheh Y, Ley K. Single cell RNA sequencing in atherosclerosis research. Circ Res. 2020;126(9):1112–1126. doi:10.1161/CIRCRESAHA.119.315940
- Duttaroy AK. Role of gut microbiota and their metabolites on atherosclerosis, hypertension and human blood platelet function: a review. Nutrients. 2021;13(1):144. doi:10.3390/nu13010144
- Verhaar BJH, Prodan A, Nieuwdorp M, Muller M. Gut microbiota in hypertension and atherosclerosis: a review. Nutrients. 2020;12(10):2982. doi:10.3390/nu12102982
- Brandsma E, Kloosterhuis NJ, Koster M, et al. A proinflammatory gut microbiota increases systemic inflammation and accelerates atherosclerosis. Circ Res. 2019;124(1):94–100. doi:10.1161/CIRCRESAHA.118.313234
- Wu M, Yang S, Wang S, et al. Effect of berberine on atherosclerosis and gut microbiota modulation and their correlation in high-fat diet-fed ApoE-/- mice. Front Pharmacol. 2020;11:223. doi:10.3389/fphar.2020.00223
- Witkowski M, Weeks TL, Hazen SL. Gut microbiota and cardiovascular disease. Circ Res. 2020;127(4):553–570. doi:10.1161/CIRCRESAHA.120.316242
- Skye SM, Zhu W, Romano KA, et al. Microbial transplantation with human gut commensals containing CutC is sufficient to transmit enhanced platelet reactivity and thrombosis potential. Circ Res. 2018;123(10):1164–1176. doi:10.1161/CIRCRESAHA.118.313142
- Deng G, Chen Y, Guo C, et al. BMP4 promotes the metastasis of gastric cancer by inducing epithelial-mesenchymal transition via ID1. J Cell Sci. 2020;133(11):jcs237222. doi:10.1242/jcs.237222
- Jo H, Song H, Mowbray A. Role of NADPH oxidases in disturbed flow- and BMP4- induced inflammation and atherosclerosis. Antioxid Redox Signal. 2006;8(9–10):1609–1619. doi:10.1089/ars.2006.8.1609
- Vendrov AE, Madamanchi NR, Hakim ZS, Rojas M, Runge MS. Thrombin and NAD(P)H oxidase-mediated regulation of CD44 and BMP4-Id pathway in VSMC, restenosis, and atherosclerosis. Circ Res. 2006;98(10):1254–1263. doi:10.1161/01.RES.0000221214.37803.79
- Boström K, Watson KE, Horn S, Wortham C, Herman IM, Demer LL. Bone morphogenetic protein expression in human atherosclerotic lesions. J Clin Invest. 1993;91(4):1800–1809. doi:10.1172/JCI116391
- Mu W, Qian S, Song Y, et al. BMP4-mediated browning of perivascular adipose tissue governs an anti-inflammatory program and prevents atherosclerosis. Redox Biol. 2021;43:101979. doi:10.1016/j.redox.2021.101979
- Shyu HY, Fong CS, Fu YP, et al. Genotype polymorphisms of GGCX, NQO1, and VKORC1 genes associated with risk susceptibility in patients with large-artery atherosclerotic stroke. Clin Chim Acta. 2010;411(11–12):840–845. doi:10.1016/j.cca.2010.02.071
- Sarutipaiboon I, Settasatian N, Komanasin N, et al. Association of genetic variations in NRF2, NQO1, HMOX1, and MT with severity of coronary artery disease and related risk factors. Cardiovasc Toxicol. 2020;20(2):176–189. doi:10.1007/s12012-019-09544-7
- Lee WS, Ham W, Kim J. Roles of NAD(P)H: quinone oxidoreductase 1 in diverse diseases. Life. 2021;11(12):1301. doi:10.3390/life11121301
- Shukla H, Gaje G, Koucheki A, et al. NADPH-quinone oxidoreductase-1 mediates benzo-[a]-pyrene-1,6-quinone-induced cytotoxicity and reactive oxygen species production in human EA.hy926 endothelial cells. Toxicol Appl Pharmacol. 2020;404:115180. doi:10.1016/j.taap.2020.115180
- Gum SI, Shin HM, Cho MK. The small GTPases regulate HMC05-induced NQO-1 expression with an antioxidant effect in smooth muscle cells. Biol Pharm Bull. 2014;37(10):1626–1632. doi:10.1248/bpb.b14-00336
- Aghagolzadeh P, Radpour R, Bachtler M, et al. Hydrogen sulfide attenuates calcification of vascular smooth muscle cells via KEAP1/NRF2/NQO1 activation. Atherosclerosis. 2017;265:78–86. doi:10.1016/j.atherosclerosis.2017.08.012
- Yan R, Yan J, Chen X, Yu Y, Sun T. Xanthoangelol prevents Ox-LDL-induced endothelial cell injury by activating Nrf2/ARE signaling. J Cardiovasc Pharmacol. 2019;74(2):162–171. doi:10.1097/FJC.0000000000000699
- Zivkovic M, Bubic M, Kolakovic A, et al. The association of glutathione S-transferase T1 and M1 deletions with myocardial infarction. Free Radic Res. 2021;55(3):267–274. doi:10.1080/10715762.2021.1931166
- Yang Y, Parsons KK, Chi L, Malakauskas SM, Le TH. Glutathione S-transferase-micro1 regulates vascular smooth muscle cell proliferation, migration, and oxidative stress. Hypertension. 2009;54(6):1360–1368. doi:10.1161/HYPERTENSIONAHA.109.139428
- de Waart FG, Kok FJ, Smilde TJ, Hijmans A, Wollersheim H, Stalenhoef AF. Effect of glutathione S-transferase M1 genotype on progression of atherosclerosis in lifelong male smokers. Atherosclerosis. 2001;158(1):227–231. doi:10.1016/S0021-9150(01)00420-8
- García-González I, Pérez-Mendoza G, Solís-Cárdenas A, et al. Genetic variants of PON1, GSTM1, GSTT1, and locus 9p21.3, and the risk for premature coronary artery disease in Yucatan, Mexico. Am J Hum Biol. 2022;34(5):e23701. doi:10.1002/ajhb.23701
- Kanehisa M, Furumichi M, Sato Y, Kawashima M, Ishiguro-Watanabe M. KEGG for taxonomy-based analysis of pathways and genomes. Nucleic Acids Res. 2023;51(D1):D587–D592. doi:10.1093/nar/gkac963