Abstract
Background
Insulin resistance is known to be a common feature of type 2 diabetes mellitus and is regarded as an important mechanism in the pathogenesis of this disease. The key pathogenetic mechanisms of insulin resistance progression are free fatty acids metabolism impairment and enhanced activity of plasminogen activator inhibitor 1. Both free fatty acids and plasminogen activator inhibitor 1 are recognized as risk factors for coronary heart disease.
Methods
The patients were divided into two groups: group 1 included 65 non-diabetic myocardial infarction patients and group 2 enrolled 60 diabetic myocardial infarction patients. The control group consisted of 30 sex- and age-matched volunteers. The concentration of serum free fatty acids, glucose, C-peptide, and insulin were measured on the 1st and 12th days of the study. All the patients had their postprandial glycemia, insulin, and C-peptide concentrations measured 2 hours after a standard carbohydrate breakfast containing 360 kcal (protein 20 g, carbohydrate 57 g, and fat 9 g).
Results
Free fatty acids levels in group 1 and in group 2 exceeded the control group values by 7-fold and 11-fold, respectively. Plasminogen activator inhibitor 1 concentration was 2.5-fold higher in group 1 and 4.6-fold higher in group 2 compared to the control group on the 1st day from the myocardial infarction onset. In addition, plasminogen activator inhibitor 1 concentration was significantly reduced in both groups on the 12th day from the myocardial infarction onset; however, it did not achieve the control group values.
Conclusion
Increased postprandial glucose level, insulinemia, and elevated levels of free fatty acids and plasminogen activator inhibitor are associated with myocardial infarction-associated progression of insulin resistance. However, insulin resistance metabolic markers are of great predictive capacity in the assessment of risk of acute coronary events.
Introduction
Coronary heart disease (CHD) and myocardial infarction (MI) have a significant impact on morbidity and mortality in developed countries.Citation1,Citation2 Thrombosis induced by atherosclerotic plaques rupture and subsequent distal thromboembolism may result in MI progression.Citation1,Citation3 Thrombus formation is regulated by the fibrinolytic system, which prevents luminal occlusion. Predominance of fibrinolysis inhibitors over its activators and plasminogen deficiency may be considered as risk factors for atherosclerosis and MI. Plasminogen activator inhibitor 1 (PAI-1) plays a significant role in cardiovascular diseases. Clinical studies have shown a positive correlation between increased levels of PAI-1 and atherothrombosis.Citation3 Moreover, high plasma PAI-1 concentration is considered to be a predictor of myocardial infarction.Citation1 PAI-1 is involved in the insulin reception process as well as in fibrinolysis regulation. PAI-1 also modulates insulin signaling in fibroblasts, preventing the binding of vitronectin to avb3 receptors that, in turn, reduces insulin-induced phosphorylation of protein kinase B.Citation4,Citation5 A positive correlation between plasma PAI-1 concentration and insulin resistance (IR) markers was verified by epidemiological studies.Citation6
According to various theories, IR is considered a common feature of type 2 diabetes mellitus (T2DM) and is regarded as an important mechanism in the pathogenesis of this disease. Cardiovascular risk factors, including hyperglycemia, dyslipo-proteinemia, hypertension, obesity, thrombosis, and smoking are also associated with increased IR risk.Citation6 Nowadays, the results of several studies have already been published confirming the association of IR with atherosclerosis manifestations and cardiovascular risk in both men and women.Citation7
Impaired free fatty acid (FFA) metabolism and increased blood FFA levels together with the impaired glucose utilization are significant pathogenetic mechanisms of the IR progression. Increased FFA levels are considered to be an early IR marker, which can be revealed long before glucose intolerance and T2DM progression.Citation8 FFA is traditionally considered as a main myocardium metabolic resource.Citation9 Intensity of FFA transport to the myocardial tissues is determined by their plasma concentration. Anaerobic glycolysis is supposed to be a main metabolic pathway under ischemic conditions by providing energy to cardiomyocytes, since FFA oxidation is associated with higher oxygen consumption. This phenomenon may lead to FFA utilization and decrease of blood FFA levels.Citation10 Moreover, disruption of mitochondrial respiratory enzymes under hypoxic conditions results in oxidative modification of lipoproteins, induces endothelial inflammation, and promotes atherosclerotic plaques formation and ischemia progression.Citation9,Citation11 Reversible metabolic impairment in the early stages becomes inevitably irreversible and leads to cell death in the absence of reperfusion.Citation13,Citation14 Thus, literature analysis suggests PAI-1 and FFA involvement in IR progression, which is recognized as a CHD risk factor. The determination of MI progression-related IR markers is of great importance for the assessment of further treatment and prognosis.
Therefore, the aim of this study is to access insulin resistance marker dynamics in ST-segment elevation patients with myocardial infarction with presented and non-presented T2DM in acute and post-acute rehabilitation periods.
Material and methods
Study subjects and design
One-hundred and twenty-five MI patients (65 males and 60 females), mean age ± standard deviation 65 ± 4.5 years, and 30 sex and age-matched volunteers (the control group) with no cardiovascular or endocrine diseases were enrolled in the study. The patients were divided into two groups: group 1 included 65 non-diabetic MI patients and group 2 enrolled 60 diabetic MI patients. The mean ± standard deviation T2DM duration was, on average, 6.4 ± 1.5 years. The groups were sex and age-matched and had similar risk factors for ischemic heart disease, concurrent conditions, and MI complications rate.
Main demographic characteristics of the study patients and group control are summarized in . The patient groups were similar in age, sex main risk factors for ischemic heart disease, comorbidities, and coronary events incidence ().
Table 1 Initial clinical and anamnestic characteristics of patients, n (%)
Acute myocardial infarction was diagnosed according to the 2007 Russian National Cardiology Society guidelines based on clinical, electrocardiographic (ECG), echocardiographic (ECHO), and biochemical signs of the disease. The inclusion criteria were chest pain refractory to nitroglycerin, myocardial ischemia, and signs of necrosis (ST segment elevation and/or new pathologic Q waves on the ECG, elevated cardiac enzymes, myocardial fraction of creatine phosphokinase [CK MB], and troponin T). Peak CK MB and troponin T levels did not differ between groups (). Peak CK MB levels were 94.03 ± 17.9 U/L and 137.64 ± 41.1 U/L in the diabetic and non-diabetic patients, respectively (P = 0.916); troponin T concentrations were 1.09 ± 0.92 ng/mL and 0.71 ± 0.41 ng/mL in the diabetic and non-diabetic patients, respectively (P = 0.564). In addition, all patients had their C-reactive protein (CRP) levels measured; concentrations were 20.47 (9.59; 45.85) mg/L and 29.86 (27.3; 31.9) mg/L (presented as median and quartiles [Me {Q1;Q3}]) in the diabetic and non-diabetic patients, respectively (P = 0.001). The exclusion criteria were age >75 years, clinically significant comorbidities (autoimmune diseases, thyroid, or adrenal gland diseases), acute coronary syndrome as a complication of percutaneous coronary intervention, or coronary artery bypass surgery. Exclusion criteria for patients with MI without diabetes, was as well, the presence of glucose on an empty stomach of more than 7 mmol/L.
Q-wave MI was diagnosed in 18 diabetic and 20 non-diabetic patients (P = 0.866). The patient groups had a similar incidence of major hospital coronary events (). In both groups, 80% of patients did not have any signs of acute heart failure, according to the 1967 Killip classification upon admission and during the hospital stay (); however, more than 50% of patients had arrhythmias and impaired conduction diagnosed according to established criteria.Citation12 The structure and function of the left ventricle did not differ in the groups. Mean left ventricular ejection fraction was 51.25% ± 1.85% in the diabetic patients and 50.42% ± 1.62% in those without T2DM (P = 0.598); mean left ventricular end-diastolic volume was 164.35 ± 10.47 mL in the diabetic patients and 156.43 ± 7.18 mL in the non-diabetic patients (P = 0.649); mean left ventricular end-systolic volume was 79.71 ± 8.32 mL in the diabetic patients and 75.22 ± 5.56 in the non-diabetic patients (P = 0.702).
The groups were similar in the presence/type of coronary artery disease: coronary angiography showed multivessel (>3 vessels) hemodynamically significant coronary artery lesions in both groups (76.5% in the diabetic patients and 62.5% in the non-diabetic patients; P = 0.857).
Primary percutaneous coronary intervention (PCI) of the infarct-related artery was used as reperfusion therapy and, if contraindicated (PCI technically unfeasible), systemic thrombolysis with streptokinase (1.5 million units) or pharmacological treatment was administered. PCI frequency was similar in both groups: it was done for 16 diabetic patients and 24 non-diabetic patients (P = 0.512). All patients received medication therapy, if not contraindicated, including acidum acetylsalicylicum (ASA), clopidogrel angiotensin converting enzyme (ACE), inhibitors and antianginal drugs; all medications were administered according to the standard of care. Fourteen diabetic patients took antihyperglycemic medications before MI: six patients took sulfonylurea drugs, four patients biguanides, three patients took a combination of sulfonylurea drugs and biguanides, and one patient took dipeptidyl peptidase-4 (DPP-4) inhibitors in combination with biguanides. Six patients were treated with the diet only. No patients showed any bleeding as a consequence of the therapy.
T2DM compensation was evaluated based on glycated hemoglobin HbA1c levels (T2DM was considered to be compensated in HbA1c > 7.5%, according to the 2000 European Diabetes Policy Group criteria). Decompensated T2DM was diagnosed in eight patients.
The study design was approved by the Institutional Review Board of the Research Institute for Complex Issues of Cardiovascular Diseases; all individuals signed informed consent before being enrolled in the study. Therapeutic interventions during the follow-up period are listed in .
Table 2 Revascularization and drug therapy during follow-up
Assay
Blood serum and plasma were tested. The serum was separated from venous blood by centrifugation at 3000 g for 20 minutes and stored at −70°C. The tests were done on the 1st day from MI and acute heart failure onset and then on the 12th day, after the condition had been stabilized. FFA and glucose concentrations as biochemical markers of IR were measured at the same study time points using standard Thermo Fisher Scientific test systems (Thermo Fisher Scientific Oy, Vantaa, Finland) on a Konelab 30i biochemistry analyzer (Thermo Fisher Scientific Oy). C-peptide and insulin concentrations were measured by enzyme-linked immunosorbent assay (ELISA) with BioMedica (Waterloo, NSW, Australia) and Diagnostic Systems Laboratories (Webster, TX, USA) lab kits, respectively. The intra-assay coefficients of variation (CVs) for insulin Diagnostic Systems Laboratories and C-peptide ELISA were 3.8% and 4.2%, respectively, and the inter-assay CVs were 6.9% and 7.9%, respectively. Additionally, all patients had their postprandial glycemia, insulin, and C-peptide concentrations measured 2 hours after being fed a standard solid meal containing 360 kcal (protein 20 g, carbohydrate 57 g, and fat 9 g).
IR levels were estimated using a structural mathematical model incorporating fasting serum insulin and glucose measurement with the Quantitative Insulin Sensitivity Check Index (QUICKI) calculation:
where I0 is basal insulinemia (mg/dL) and G0 is basal glycemia (mME/mL).Citation15 The average QUICKI value of 0.382 + 0.007 corresponds to normal tissue sensitivity to insulin; the QUICKI value of 0.331 + 0.010 and 0.304 + 0.007 corresponds to moderate and severe tissue IR, respectively.
Statistical analysis
Statistical analysis was done using non-parametric Mann-Whitney test for unpaired samples and Wilcoxon test for paired samples. The results were presented as median and quartiles (Me [Q1;Q3]). P values <0.05 were considered statistically significant. Spearman’s correlation coefficient was calculated to analyze correlations between the variables. Statistical analysis was performed using Statistica 6.0 (StatSoft, Tulsa, OK, USA).
Results
Blood glucose levels increased 1.2-fold in group 1 and 1.9-fold in group 2 compared to the control group on the 1st day after MI onset (). An elevation in glucose level was noticed in group 2 during the entire follow-up period, whereas in group 1, blood glucose levels decreased on the 12th day from MI onset but did not achieve the values in the control group. In addition, postprandial glucose levels increased 2.6-fold in group 2 in comparison to the control values on the 12th day from the MI onset ().
Table 3 Basal and postprandial glucose, insulin and C-peptide levels on the 1st and 12th days from the Ml
In contrast, fasting serum insulin and C-peptide levels tended to increase in both groups on the 1st and 12th days from MI onset, but did not differ significantly from the control values (). The changes in postprandial values were more significant on the 12th day of MI progression (). Postprandial insulin level raised equally in both groups compared to the control group. The change in C-peptide dynamics was comparable with the change in glucose level (C-peptide concentration increased 2.3-fold in group 2 and 1.5-fold in group 1).
The IR QUICKI integral index significantly differed from the control values in both groups despite the fact that carbohydrate metabolism changes were less pronounced in group 1 than in group 2. The QUICKI index in the control group was 0.38 ± 0.01 and corresponded to normal tissue sensitivity to insulin. In group 1, the QUICKI indices were 0.316 ± 0.005 and 0.319 ± 0.005 on the 1st and 12th days after the MI onset, respectively, and they were interpreted as breakpoint values between severe and moderate IR. In group 2, the QUICKI indices were 0.296 ± 0.009 and 0.300 ± 0.005 that, in accordance with Katz et al, verified pronounced tissue IR.Citation15
Significant differences in FFA concentration were detected in patients with MI on the 1st and 12th days from the MI onset compared to healthy subjects (). FFA levels in group 1 and in group 2 exceeded the control group values by 7-fold and 11-fold, respectively. On the 12th day of follow-up they decreased, but still differed by 3.0–4.7-fold from the normal values. The changes were more remarkable in group 2.
Table 4 Basal level of FFA and PAI-1, on the 1st and 12th days from the MI, respectively
PAI-1 concentration was 2.5-fold higher in group 1 and 4.6-fold higher in group 2 compared to the control group on the 1st day from MI onset. In addition, PAI-1 concentration significantly reduced in both groups on the 12th day from MI onset; however, it did not achieve control group values ().
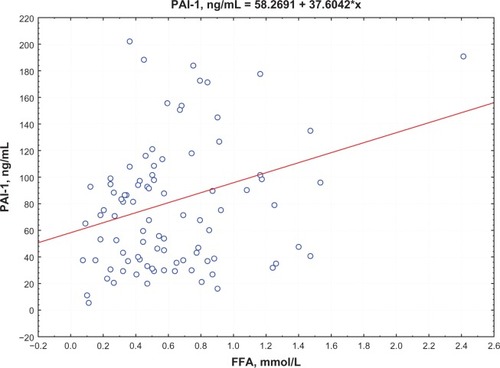
Postprandial insulin positively correlated with FFA levels (R = 0.395, P = 0.0002) () and QUICKI index negatively correlated with FFA levels (R = −0.74, P = 0.0002; ) in group 1. Moreover, a negative correlation between PAI-1 concentration and QUICKI index was reported in group 2 and in group 1 (R = −0.77, P = 0.005; R = −0.47, P = 0.005, respectively; ); PAI-1 and FFA levels were positively correlated (R = 0.235, P = 0.0088; ).
Figure 1 Correlation between postprandial insulin and FFA levels.
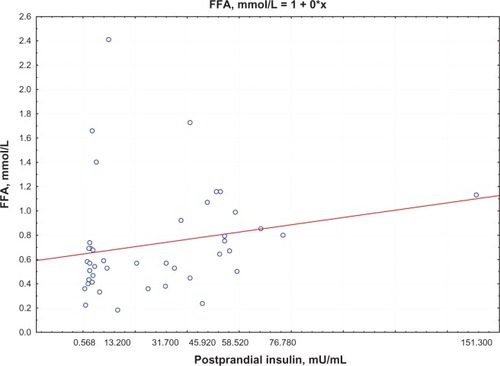
Figure 2 Correlation between QUICKI index and FFA levels.
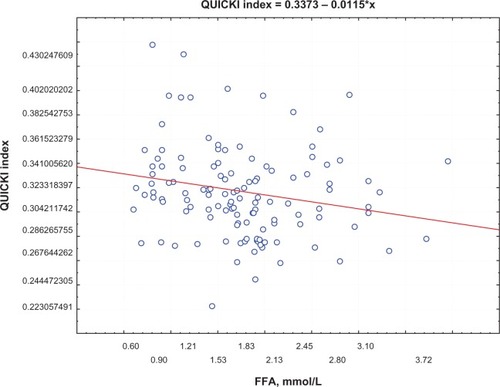
Figure 3 Correlation between QUICKI index and PAI levels.
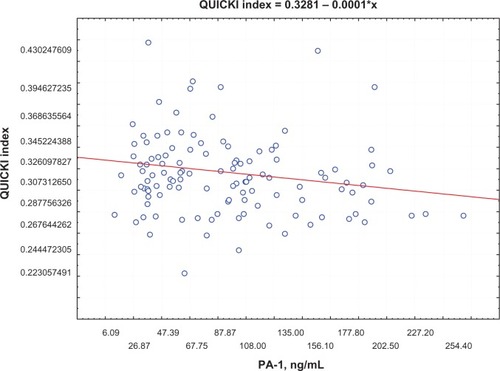
Figure 4 Correlation between FFA and PAI levels.
Discussion
According to the modern point of view, IR is considered a key pathogenetic mechanism of T2DM, and it is also regarded as an atherosclerosis risk factor together with the metabolic markers, including serum glucose and insulin levels.Citation9 The results of our study indicate the presence of basal and postprandial hyperglycemia in patients with MI in acute and post-acute rehabilitation periods; it was also found that blood glucose levels are higher in MI patients with associated T2DM during the follow-up period. The presence of basal and postprandial hyperglycemia in MI patients was considered to be an independent risk factor for adverse events according to the results of clinical studies.Citation2 The authors noted a high number of in-hospital complications and high case fatality rate in patients with MI and associated hyperglycemia during a long-term period. According to several studies, postprandial insulin and C-peptide levels are more informative than basal levels, particularly in cases without obvious IR manifestations, and the detected analyte can be used for IR identification.Citation6 However, postprandial insulin and C-peptide levels were significantly higher in both case groups compared to healthy subjects, but only slightly differed within the case groups. The presence of IR in patients included in the study was confirmed by the low QUICKI index. The severe IR was reported in the case of combined pathology, and moderate IR degree was reported in cases with diabetes absence.
Reduced sensitivity to insulin also affects lipid metabolism; initially FFA metabolism. Although we found a statistically significant increase in FFA levels in both groups of patients who suffered from acute MI, the results were more evident in patients with a history of diabetes. FFA concentration remained high in the early recovery period after MI. Resistance to the antilipolytic effect of insulin in adipocytes may be one of the causes for the elevation of FFA concentration in MI patients.Citation9 First, FFA becomes a substrate for triglyceride and atherogenic lipoprotein formation. Second, it prevents insulin binding to hepatocytes, increasing susceptibility to IR. Excessive FFA buildup in the liver leads to their abnormal metabolism. As a result, lipid metabolites (ceramides, diacylglycerides, and triacylglycerides) accumulate in hepatocytes causing the impairment of the insulin signaling pathway and, thus, the glucose transport to the cells and, as a consequence, its increase in blood.Citation9 Altering hepatocytes by IR leads to a decrease in glycogen synthesis, activation of glycogenolysis, and gluconeogenesis enhancing hyperglycemia.
Metabolic abnormalities in myocardium cells under ischemic conditions are hypothesized to be an alternative mechanism resulting in blood FFA elevation during MI progression. FFAs are traditionally recognized as a main metabolic resource for myocardium. FFA oxidation provides two-thirds of the adenosine triphosphate (ATP) for the heart. The intensity of FFA transport to the heart cells is determined by their plasma concentration. Under myocardial ischemia conditions, FFA accumulates in blood due to the shift in biological oxidation to anaerobic glycolysis.Citation9 The inhibition of insulin reception, accompanied by a decrease in the utilization of myocardium energy substrate and by accumulation of FFA in the blood, enhances the IR development, and is considered to be a negative lactacidosis effect. Moreover, the transport of fatty acids or ketone bodies into the heart and diaphragm determines the sharp drop in insulin sensitivity, according to obtained experimental data.Citation9 Apparently, elevation of blood FFA levels in cases of acute myocardial infarction is associated not with myocardial ischemia alone, but also with the impaired insulin sensitivity in peripheral tissues, which is a result of an abundance of FFA in circulation. A direct positive correlation between postprandial insulin level and FFA concentration and a negative correlation between the QUICKI index and FFA level verified this hypothesis.
Regarding classical ideas, coronary artery thrombosis and plaque formation are the causes of MI occurrence. Thrombus formation is regulated by the fibrinolytic system, which prevents luminal occlusion. According to the results of recent studies, the enhanced activity of a key component of the fibrinolysis system, PAI-1, is considered not as a risk factor of atherosclerosis and MI only, but also as an IR marker.Citation1,Citation3 Moreover, previous experimental studies demonstrated that proinflammatory factors (interleukin-6 and CRP) could induce PAI-1 production. PAI-1 activity increase is regarded both as a risk factor for coronary atherothrombosis and MI and as a trigger for IR development. Alessi et al investigated hyperinsulinemic obese patients with the genotype associated with increased PAI-1 transcription, confirming a high risk of MI development.Citation3 T2DM obese patients had elevated PAI-1 levels; however, PAI-1 level reduction was detected in this group after the administration of drugs improving insulin sensitivity in tissues.Citation10 One of the explanations for this phenomenon was obtained in an observational study that suggested the PAI-1 role in the regulation of insulin reception. PAI-1 is able to block insulin signaling in adipocytes; exposure of adipocytes to high insulin concentrations was accompanied by increased PAI-1 expression in these cells.Citation4 PAI-1 gene-knockout mice demonstrated the increased ability of insulin-stimulated glucose uptake compared to conventional mice.Citation13 Our study reported increased PAI-1 concentration in both groups of patients; moreover, T2DM resulted in an increase of PAI-1 in the in-patient period. At the same time, there was a decrease in PAI-1 level in the early rehabilitation period after MI that led to a reduction of PAI-1 inhibiting influence and to normalization of fibrinolytic activity in both groups of patients. However, steadily high PAI-1 levels may indicate the risk of recurrent coronary events in patients with prior MI. Certain case-control studies found that high PAI-1 levels can be used to identify groups at high risk of CHD and T2DM.Citation3 Therefore, first, an increase in PAI-1 level is associated with thrombophilia in MI patients. Second, PAI-1 level may help diagnose IR since there is negative correlation between PAI-1 level and IR occurrence that was verified by a low QUICKI index.
Conclusion
Thus, the results of this study show that MI progression is accompanied by insulin resistance development. The increase in FFA and PAI-1 concentrations is more informative regarding impaired sensitivity to insulin in MI as compared to postprandial glucose and insulin levels. High concentrations of FFA in MI patients seem to not only reflect the degree of myocardial ischemia but also to take part in hyperglycemia and IR development involving the sympathoadrenal system. The hyperactivation of the latter due to pain results in a more intensive lipolysis and excess FFA release. PAI-1 being the main regulator of the fibrinolytic system is also involved in the process of impaired insulin-receptor interaction and IR development in MI patients. Measuring metabolic markers of IR can be of high prognostic value for the risk stratification of acute coronary events and the choice of further treatment strategy. High levels of FFA and PAI-1 in MI still present in a stable patient’s condition can be a theoretic rationale for the use of IR markers as one of the risk criteria for T2DM and as a solution to the issue of more effective secondary prevention.
Disclosure
The authors report no conflicts of interest in this work.
References
- Collet JP Montalescot G Vicaut E Acute release of plasminogen activator inhibitor-1 in ST-segment elevation myocardial infarction predicts mortality Circulation 2003 108 4 391 394 12860898
- Ishihara M Kojima S Sakamoto T Japanese Acute Coronary Syndrome Study Investigators Acute hyperglycemia is associated with adverse outcome after acute myocardial infarction in the coronary intervention era Am Heart J 2005 150 4 814 820 16209987
- Alessi MC Juhan-Vague I PAI-1 and the metabolic syndrome: links, causes, and consequences Arterioscler Thromb Vasc Biol 2006 26 10 2200 2207 16931789
- López-Alemany R Redondo JM Nagamine Y Muñoz-Cánoves P Plasminogen activator inhibitor type-1 inhibits insulin signaling by competing with alphavbeta3 integrin for vitronectin binding Eur J Biochem 2003 270 5 814 821 12603314
- Juhan-Vague I Morange PE Frere C HIFMECH Study Group The plasminogen activator inhibitor-1 -675 4G/5G genotype influences the risk of myocardial infarction associated with elevated plasma proinsulin and insulin concentrations in men from Europe: the HIFMECH study J Thromb Haemost 2003 1 11 2322 2329 14629464
- Cefalu WT Insulin resistance: cellular and clinical concepts Exp Biol Med (Maywood) 2001 226 1 13 26 11368233
- Huxley R Barzi F Woodward M Excess risk of fatal coronary heart disease associated with diabetes in men and women: meta-analysis of 37 prospective cohort studies BMJ 2006 332 7533 73 78 16371403
- Leclercq IA Da Silva Morais A Schroyen B Van Hul N Geerts A Insulin resistance in hepatocytes and sinusoidal liver cells: mechanisms and consequences J Hepatol 2007 47 1 142 156 17512085
- Lopaschuk GD Ussher JR Folmes CD Jaswal JS Stanley WC Myocardial fatty acid metabolism in health and disease Physiol Rev 2010 90 1 207 258 20086077
- Oliver MF Sudden cardiac death: the lost fatty acid hypothesis QJM 2006 99 10 701 709 16935924
- Stanley WC Recchia FA Lopaschuk GD Myocardial substrate metabolism in the normal and failing heart Physiol Rev 2005 85 3 1093 1129 15987803
- Kryzhanovsky VA Diagnosis and treatment of myocardial infarction K Phoenix 2001
- Campbell IW Antidiabetic drugs present and future: will improving insulin resistance benefit cardiovascular risk in type 2 diabetes mellitus? Drugs 2000 60 5 1017 1028 11129120
- Liang X Kanjanabuch T Mao SL Plasminogen activator inhibitor-1 modulates adipocyte differentiation Am J Physiol Endocrinol Metab 2006 290 1 E103 E113 16144810
- Katz A Nambi SS Mather K Quantitative insulin sensitivity check index: a simple, accurate method for assessing insulin sensitivity in humans J Clin Endocrinol Metab 2000 85 7 2402 2410 10902785