Abstract
Background
Diet and exercise are often prescribed as primary intervention regarding obesity-related disorders. Additionally, recent studies have shown beneficial effects of weight loss through diet and exercise in ghrelin concentrations in obese subjects. The aim of this study was to evaluate the effects of a 5% weight loss on lipid profile, resting metabolic rate (RMR), and acylated ghrelin (AG) using two different methods of intervention (diet or diet plus exercise).
Materials and methods
Eighteen subjects (twelve women and six men) aged 20–40 years with a body mass index of 30–34.9 kg/m2 (grade 1 obesity) were randomized into two intervention groups: diet (n=9) or diet plus exercise (n=9). Both groups underwent treatment until 5% of the initial body weight was lost. At baseline and upon completion, RMR and AG were analyzed.
Results
Both groups showed a significant decrease in body fat percentage and fat mass. The diet-plus-exercise group showed a decrease in AG (pre: 54.4±25.3 pg/mL and post: 33.2±19.1 pg/mL) and an increase in RMR (pre: 1,363±379 kcal/day, post: 1,633±223 kcal/day).
Conclusion
These data suggest that diet plus exercise induced weight loss and had beneficial effects on AG concentration and RMR, essential factors to ensure the benefits of a weight-loss program.
Introduction
Obesity is a major risk factor for premature death, with lifestyle playing an important role in the development of comorbidities, such as type 2 diabetes, hypertension, cardiovascular disease, and cancer.Citation1 The 2005 estimate from the World Health Organization indicated that more than 1.6 billion adults worldwide were overweight and at least 400 million were obese.Citation2 Obesity is a multifactorial disease consisting of genetic, metabolic, and environmental factors. The control of appetite and satiety, as well as energy expenditure and metabolic rate, play a critical role in obesity, and therefore should be considered in the management of overweight and obese individuals.
Ghrelin is an orexigenic peptide produced mainly in the stomach, and in small amounts in the duodenum, jejunum, ileum, colon, placenta, heart, hypothalamic arcuate nucleus, and kidneys.Citation3 Both acylated and desacylated ghrelin are found in the bloodstream, with desacylated ghrelin being the most abundant form.Citation4 The two forms of ghrelin have different physiological roles and effects, and measurement of total ghrelin concentration may not elucidate the changes in metabolism and body weight regulation caused by these two forms individually.Citation5 Acylated ghrelinCitation6 (AG) is associated with energy homeostasis and basal metabolic rate, which are contributing factors to the maintenance and/or reduction of weight.Citation7 Nonacylated ghrelin is found predominantly (80%–90% of total ghrelin) in the blood and binds to high-density lipoproteins containing different esterases.Citation8 Although nonacylated ghrelin is a product of a modification of AG, it does not replace AG in the binding regions in the hypothalamus and pituitary, and shows no activity either on appetite in rats or in humans.Citation9
Research on the association of exercise with food intake suggests that exercise has an impact not only on energy expenditure but also on the regulation of appetite and postexercise energy balance.Citation10 Hansen et alCitation11 investigated the effects of a weight-loss intervention on obese women, and found increased total ghrelin concentrations following weight loss. Foster-Schubert et alCitation12 showed increased total ghrelin concentrations in response to weight loss in postmenopausal women after a 12-month aerobic exercise intervention. Therefore, changes in AG may be associated with the outcomes and success of obesity treatments, since cycling of weight gain and loss could depend on hormonal energy regulation.
Behavioral changes based on dietary therapy and physical exercise have been widely recommended in the management of overweight and obese individuals.Citation1,Citation2 Studies have suggested that a 5%–10% loss of total body mass should be sufficient to produce beneficial effects in obese subjects. Recent studies have shown time-dependent beneficial effects of diet and physical training associated with changes in ghrelin concentrations in obese subjects.Citation1 Therefore, the aim of this study was to investigate the effects of a 5% reduction in total body mass on biochemical parameters, resting metabolic rate (RMR), and AG concentration in grade 1 obese subjects undergoing a diet- or diet plus exercise-induced weight-loss program.
Materials and methods
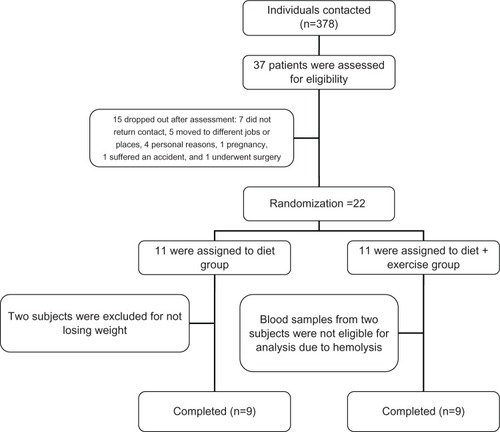
The program was a group-based intervention designed to produce a 5% reduction in body weight, nested in a previous studyCitation13 For sample size, we used previous studies regarding AG,Citation10 and the calculation was made using Altman’s nomogram, with the following settings: power was set at 80%, α was set at 0.5, and the standardized difference was 0.89, resulting in a sample size of 18 subjects, including 20% for future losses.Citation14 The sample consisted of 22 adult subjects (16 women and six men) who were selected from the outpatient clinic of Hospital de Clínicas de Porto Alegre, Brazil. Subjects were randomized into two intervention groups: diet group (DG; n=11, three men) and diet-plus-exercise group (D+EG; n=11, three men). However, at the end of the program, nine subjects from each group were analyzed for reasons that are explained in . All participants had a sedentary lifestyle, were nonsmokers, aged 20–40 years, and classified as grade 1 obese (body mass index [BMI] 30–34.9 kg/m2), nondiabetic, and without any major comorbidities. Treatment duration was recorded individually as the time between the initiation of treatment and achievement of a 5% body mass reduction. The study was approved by the local ethics committee (institutional review board equivalent), and was conducted in accordance with the provisions of the Declaration of Helsinki. Written informed consent was obtained from all participants.
Figure 1 Flow diagram of patient recruitment and randomization.
Diet
A balanced diet (60% carbohydrate, 15% protein, and 25% fat of the total energy value) was prescribed to all participants. The diet followed the guidelines established by the Brazilian Society of CardiologyCitation15 Total energy value was calculated based on RMR and physical activity), as follows: RMR × physical activity – 500–1,000 kcal/day The subjects were assessed every 14 days to monitor body weight and adherence to diet, until a 5% body mass reduction was achieved.
Exercise
The training program consisted of 40-minute exercise sessions on a stationary bicycle, three times a week (on alternate days), at 70% of heart rate (HR) reserve, which was calculated according to Karvonen et alCitation16: HRtraining = (HRmax-HRrest) × 0.70+HRrest. HR during training was monitored using HR monitors (S100; Polar, Kempele, Finland). Participants failing to attend at least 75% of the training program or three consecutive intervention sessions were considered dropouts.
Protocol application
The subjects were randomly divided into two groups of different interventions: the DG group and the D+EG group. A qualified exercise scientist and qualified nutritionist respectively prescribed the training and diet. Every 15 days, all subjects returned to the laboratory to carry out control measures of body weight, height, and waist and to adjust the menu if necessary. The subjects randomized to the D+EG group came to the laboratory three times a week to conduct supervised physical training with the coaches.
Resting metabolic rate
Subjects were asked to refrain from moderate- or high-intensity physical activities for 24 hours prior to testing, and were also asked to fast for 12 hours and sleep for at least 8 hours the night before testing. In addition, all participants were instructed not to drink alcohol or caffeine or take any kind of medication without consulting the researchers. All tests were performed between 7:30 and 9:30 am in a quiet, temperature-controlled room (20°C–25°C) under artificial illumination. The protocol consisted of 10 minutes’ bed rest in the supine position followed by assessment of expired gas samples for 30 minutes. A computerized gas analyzer (CPX/D; MGC Diagnostics, Saint Paul, MN, USA) was used to determine oxygen uptake (VO2) and carbon dioxide output (VCO2). To calculate RMR, the first 10 minutes of gas uptake were discarded and data from the final 20 minutes of collection were used to calculate mean values over the test period.Citation17 The following formula was used to obtain the values of kcal/day: ([3.9 × VO2]+[1.1 × VCO2]) × 1,440.Citation17
Maximal oxygen consumption
The maximal oxygen consumption (VO2max) protocol consisted of incremental exercise on a stationary bicycle. An initial 3-minute warm-up at 25 W and 70–80 rpm was followed by incremental increases of 25 W every 60 seconds through the end of the test. The following criteria were used to determine maximal capacity for oxygen consumption at the test: the subject reached volitional fatigue, respiratory exchange ratio (RER) ≥1.15, HRtest ≥95% of age-predicted maximum HR (220 – age), and/or a plateau in oxygen consumption with increasing load.Citation18 Oxygen consumption was determined using the CPX/D computerized gas analyzer, which was calibrated before each test.
Acylated ghrelin
A 5 mL blood sample was collected from the antecubital area and immediately transferred to tubes containing ethylenediaminetetraacetic acid and 10 μL of 4-(hydroxymercury) benzoic acid sodium salt to avoid deacylation of ghrelin by proteolysis. The sample was centrifuged at 3,500 rpm for 10 minutes at 4°C.Citation10 Plasma was separated, and 100 mL of hydrochloric acid was added for every 1 mL of plasma. The samples were centrifuged again at 3,500 rpm for 5 minutes at 4°C, and the supernatant was aliquoted into two vials and frozen at −80°C for later analysis. Plasma AG concentrations were determined by enzyme-linked immunosorbent assay (SPI BIO, Montigny le Bretonneux, France). To eliminate interassay variation, all samples from each participant were analyzed in the same assay. The within-batch coefficient of variation was 2.1%.
Blood analyses
Glucose was measured using a hexokinase assay with an enzymatic ultraviolet method. Glucose were assessed in an Advia (Bayer, Leverkusen, Germany) automated analyzer. Insulin was measured by electrochemiluminescence (Elecsys®; Roche, Basel, Switzerland).
Body composition
Anthropometric assessments were performed according to the recommendations of the International Society for the Advancement of Kinanthropometry.Citation19 The Durnin and WomersleyCitation20 protocol was chosen, which takes into account a subject’s body mass, triceps, biceps, and subscapular and iliac crest skin folds. Subjects were measured and weighed while wearing light indoor clothing, using a calibrated anthropometer and a digital scale. BMI was calculated as body mass (kg) divided by height squared (m2).
Statistical analysis
The Shapiro–Wilk test was used to verify the normal distribution of data, and the Levene test to assess the homogeneity of variances. The intervention groups were compared for anthropometric, metabolic, and biochemical characteristics using Student’s t-test for independent samples. Student’s t-test for paired samples was used to identify significant intragroup differences between points in time. For intergroup analyses, variable deltas were calculated and verified using Student’s t-test for independent samples. We applied a covariance test to check for possible interferences of sex and time on the variables. All results were expressed as means ± standard deviation, unless otherwise stated. All statistical tests were two-sided, and the significance level was set at P<0.05. Data were analyzed using SPSS version 17.0 for Windows (IBM, Armonk, NY, USA).
Results
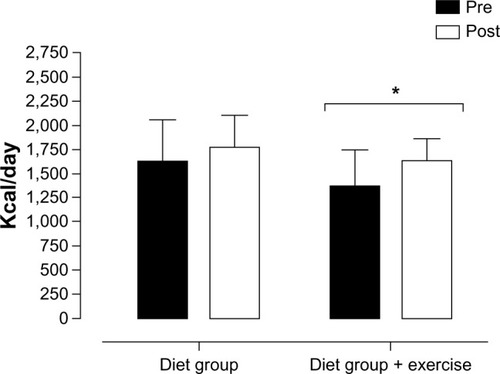
A total of 22 subjects participated in our weight-loss program and were equally divided into two intervention groups: DG or D+EG. Both groups were considered homogeneous at baseline. However, for data analysis, 18 individuals were considered, nine in each group, as explained in . The pre- and postintervention anthropometric and metabolic data of all participants are described in . Both groups achieved the targeted 5% body mass reduction, but treatment duration was longer in the DG (85.1±26.5 days vs 74.1±26.0 days in the D+EG). There were significant differences in pre- and postintervention body mass (kg) between groups. The reduction in total body mass induced a significant decrease in body fat percentage (38.9%±5.26% vs 36.9%±5.21%, P≤0.001; and 37.6%±5.1% vs 35.0%±5.5%, P≤0.01) and fat mass (38.1±4.1 vs 33.9±3.4 kg, P≤0.001; and 34.4±3.54 vs 30.4±3.33 kg, P≤0.01) in the DG and D+EG, respectively (). RMR (kcal/day) did not increase after treatment in the DG; however, RMR increased after treatment in the D+EG (1,363.6±379.9 vs 1,585.3±171.4 kcal/day, P≤0.008) (). There were a positive correlation between RMR and AG for DG pretreatment (0.82, P≤0.04). After treatment, we found an increased ghrelin concentration, and this correlation was lower (0.67, P≤0.04).
Table 1 Pre- and postintervention anthropometric, metabolic, and biochemical parameters of subjects participating in a diet- or diet plus exercise-induced weight-loss program
Figure 2 Pre- and postintervention basal metabolic rate values.
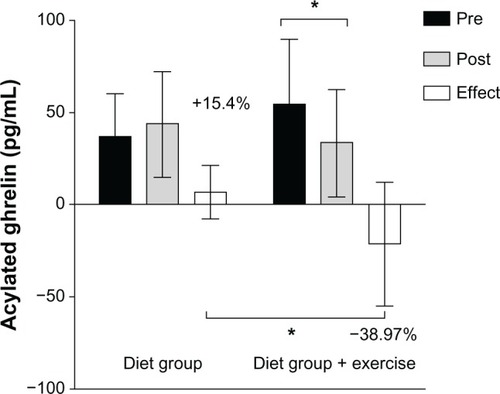
In the D+EG, a significant difference was found only in AG concentration (54.4±25.3 vs 33.2±19.1 pg/mL, P≤0.01) (). Change values were determined for both groups to demonstrate the effects of treatment. This analysis revealed differences in treatment effects on AG concentrations between groups (43.5±28 vs 19.2±10 pg/mL, P≤0.05), with a 15.4% increase in the DG and a 39% decrease in the D+EG. Between-group differences in AG values and the effects of treatment in both groups are shown in .
Figure 3 Comparison of acylated ghrelin (AG) values (pg/mL) between the diet group (DG) and diet-plus-exercise group (D+EG) following a 5% body mass reduction (absolute values and deltas).
Discussion
The interventions with diet or diet plus exercise in this study produced different effects on energy metabolism and AG, improving health parameters like BMI evaluated in obese subjects. In the present study, diet- and diet plus exercise-induced weight loss had no significant effects on glucose or insulin levels after treatment. Although these results were not statistically significant, reductions in glucose and insulin levels may be clinically relevant in the management of insulin resistance. A possible explanation lies in the duration of treatment to achieve the targeted 5% body mass reduction, which was different between groups (DG 85 days vs D+EG 74 days).Citation21
In the present study, diet- and diet plus exercise-induced weight loss had no significant effects on glucose or insulin levels after treatment. A possible explanation lies in the duration of treatment to achieve the targeted 5% body mass reduction, which was different between groups (DG 85 days vs D+EG 74 days).
Fat mass decreased significantly in both groups after treatment. In addition, diet-induced weight loss produced a significant reduction in fat-free mass. These results suggest that exercise may help maintain muscle mass by inducing physiological changes that increase muscle mass or decrease the potential of diet to have an influence on muscle tissue. Diet plus exercise-induced weight loss also significantly increased RMR, which may be related to the maintenance of muscle mass observed in this group. Because fat-free mass did not decrease significantly in this group, these results may indicate that physical exercise has an effect on RMR values in obese subjects when in combination with a weight-reduction diet. In turn, participants assigned to diet alone showed no differences in RMR after treatment, although previous studies have suggested that a reduced-calorie diet may lead to a decrease in muscle mass, promoting RMR reduction.Citation22 Nevertheless, RMR does not only depend on muscle mass and may be influenced by several factors, including fat-free mass, body surface area, fat mass, age, and sex.Citation23 We found a positive correlation between RMR and AG for DG pretreatment (0.82). After treatment, we found an increased ghrelin concentration, and this correlation was lower (0.67). This positive relationship of AG and basal metabolic rate is supported by Marzullo et al,Citation6 who found a positive relationship between AG and resting energy expenditure in obese subjects, suggesting that ghrelin secretion is only decreased with the impairment of energy expenditure. Since RMR was not statistically different for the DG after treatment, we could speculate that increased ghrelin could be related to a lower RMR when comparing this result with the D+EG, where this correlation was not found, which could be justified for other metabolic or body-composition changes that influenced the increase in RMR regardless of ghrelin concentrations, such as fat-free mass or total surface area.
Recent studies have suggested that increased AG concentrations observed in obese subjects after diet-induced weight reduction are related to lower energy reserves, mainly adipose tissue.Citation11 Increased AG concentrations may also be associated with reports of increased hunger during treatment and difficulty in reducing food intake and losing weight. In a recent study by our group, a single session of aerobic exercise was able to reduce acutely AG concentrations and hunger in eutrophic subjects compared to resting controls.Citation10 Similarly, Broom et alCitation24 found reduced AG concentrations in normal-weight individuals undergoing an acute session of moderate-intensity aerobic exercise (60% VO2max) compared with resting controls. A few studies have evaluated the effects of chronic exercise on obese subjects. King et alCitation25 showed that caloric restriction induced a significant increase in AG concentrations compared with baseline values, whereas exercise promoted opposite effects. Our results demonstrated that a 5% diet plus exercise-induced weight loss was able to significantly reduce AG concentrations in obese individuals. Our analysis of delta values revealed a 15.4% increase in AG concentrations in subjects assigned to diet alone and a 39% decrease in AG concentrations in those assigned to the D+EG. Likewise, Scheid et alCitation26 found similar results after a 3-month aerobic training in eutrophic subjects who lost weight. Ravussin et al,Citation27 however, found no significant differences in plasma ghrelin concentration in monozygotic twins under different diet and physical exercise treatments. Similar to our results, Hansen et alCitation11 found increased total ghrelin concentrations following weight reduction in obese women attending a diet-induced weight-loss program. However, our findings contrast with those reported by Foster-Schubert et al,Citation12 who found increased total ghrelin concentrations after an exercise program. We can speculate that exercise training combined with dietary intervention, rather than diet therapy alone, promotes different effects on AG concentrations when associated with weight loss, reducing AG concentrations. Also, AG concentrations may respond differently than total ghrelin, thus affecting the AG and desacylated ghrelin ratio. The reduction in AG observed in our group attending the diet-plus-exercise intervention may be related to the effects of aerobic exercise promoted by muscle response, ie, growth-hormone release.Citation28 According to St-Pierre et al,Citation29 obese individuals with some degree of insulin resistance have lower AG values when compared with normal-weight subjects. Krekoukia et alCitation30 showed that aerobic exercise was able to reduce insulin resistance and reduce or even prevent the deleterious effects of diabetes mellitus. Insulin and acylated ghrelin showed a positive correlation only after treatment for D+EG (r=0.80). To our knowledge, this is the first time that a positive correlation was found after a diet-with-exercise intervention. We could only speculate that the change in BMI after the intervention affected the modulation on insulin and ghrelin in obese subjects, and future studies should investigate this relationship further. The effect of AG on food intake suggests a potential role of AG in the body’s return to homeostasis following a reduction in body mass. Thus, the combination of dietary treatment and exercise training may promote homeostasis and restore AG values to normal physiological levels. Therefore, it could maintain RMR in healthier levels.
The present study has some limitations. Although our sample size matches the statistical power for our main variable (AG) we could argue that it was small to present intergroup differences for such variables as insulin and glucose. Regarding our anthropometric data, we used a two-component measurement protocol, which is better suited for diagnosis but it is not the ideal for clinical approaches, since the changes in some tissues cannot be measured by this method, mainly differences in body water. Also, we could not measure hormones such as adiponectin, leptin, or growth hormone, which might be able to provide a better understanding of the ghrelin metabolism and mechanisms related to physical training and RMR regulation.
Conclusion
Our findings showed that a dietary intervention associated with exercise training was able to reduce AG concentrations and increase RMR in grade 1 obese subjects, factors considered essential to ensure the benefits of a weight-loss program. Therefore, we believe that successful treatment of obesity should consist of a comprehensive approach involving diet and exercise intervention. In addition, future research is encouraged to further investigate treatment options that can effectively combat obesity.
Author contributions
André L Lopes worked on experimental design, patient selection, assessment and prescription of exercise, data analysis, and writing. Ana Paula T Fayh worked on the development of the experimental design, patient selection, assessment and prescription diet, collection and data analysis, and writing. Luisa G de Souza Campos participated in the data collection, monitoring of patients during the dietary intervention and exercise, data analysis, and writing. Bruno C Teixeira worked on monitoring group exercise, statistical data analysis, and writing. Randhall B Kreismann Carteri worked on monitoring group exercise, review of English-language use, and writing. Jerri L Ribeiro worked on academic orientation, development of the experimental design, collection and analysis of clinical data, literature review, and writing. Rogério Friedman worked on academic orientation, development of the experimental design, collection and analysis of clinical data, literature review, and writing. Álvaro Reischak-Oliveira was responsible for directing the project and participated in the development of the experimental design, data collection on exercise and nutrition, writing, and reviewing.
Disclosure
Financial support for this study was provided by the FAPERGS - PqG - 2012, number 12/2432; Conselho Nacional de Desenvolvimento Científico e Tecnológico (CNPq) and Fundo de Incentivo à Pesquisa e Eventos (FIPE) from Hospital de Clínicas de Porto Alegre. ALL received research-grant support from the Coordenação de Aperfeiçoamento de Pessoal do Ensino Superior (CAPES). ARO is a fellow researcher of CNPq.
References
- Chaston TB Dixon JB Factors associated with percent change in visceral versus subcutaneous abdominal fat during weight loss: findings from a systematic review Int J Obes (Lond) 2008 32 619 628 18180786
- World Health Organization Obesity Available from: http://www.who.int/topics/obesity/en Accessed October 19, 2013
- Franz MJ VanWormer JJ Crain AL Weight-loss outcomes: a systematic review and meta-analysis of weight-loss clinical trials with a minimum 1-year follow-up J Am Diet Assoc 2007 107 1755 1767 17904936
- Liu J Prudom CE Nass R Novel ghrelin assays provide evidence for independent regulation of ghrelin acylation and secretion in healthy young men J Clin Endocrinol Metab 2008 93 1980 1987 18349056
- Ukkola O Ghrelin and metabolic disorders Curr Protein Pept Sci 2009 10 2 7 19275667
- Marzullo P Verti B Savia G The relationship between active ghrelin levels and human obesity involves alterations in resting energy expenditure J Clin Endocrinol Metab 2004 89 936 949 14764817
- Leidy HJ Gardner JK Frye BR Circulating ghrelin is sensitive to changes in body weight during a diet and exercise program in normal-weight young women J Clin Endocrinol Metab 2004 89 2659 2664 15181038
- Beaumont NJ Skinner VO Tan TM Ghrelin can bind to a species of high density lipoprotein associated with paraoxonase J Biol Chem 2003 278 8877 8880 12531885
- Kojima M Kangawa K Ghrelin: structure and function Physiol Rev 2005 85 495 522 15788704
- Becker GF Macedo RC Cunha Gdos S Martins JB Laitano O Reischak-Oliveira A Combined effects of aerobic exercise and high-carbohydrate meal on plasma acylated ghrelin and levels of hunger Appl Physiol Nutr Metab 2012 37 184 192 22300359
- Hansen TK Dall R Hosoda H Weight loss increases circulating levels of ghrelin in human obesity Clin Endocrinol (Oxf) 2002 56 203 216 11874411
- Foster-Schubert KE McTiernan A Frayo RS Human plasma ghrelin levels increase during a one-year exercise program J Clin Endocrinol Metab 2005 90 820 835 15585547
- Fayh AP Lopes AL da Silva AM Reischak-Oliveira A Friedman R Effects of 5% weight loss through diet or diet plus exercise on cardiovascular parameters of obese: a randomized clinical trial Eur J Nutr 2012 52 1443 1450 23052625
- Altman DG Statistics in medical journals Stat Med 1982 1 59 71 7187083
- SBC SBdC I diretriz Brasileira de diagnóstico e tratamento da síndrome metabólica [I Brazilian guideline for diagnosis and treatment of metabolic syndrome] Arq Bras Cardiol 2005 84 3 28 15841837
- Karvonen MJ Kental E Mustala O The effects of training on heart rate; a longitudinal study Ann Med Exp Biol Fenn 1957 35 307 315 13470504
- Weir JB New methods for calculating metabolic rate with special reference to protein metabolism J Physiol 1949 109 1 9 15394301
- Cunha G Lorenzi T Sapata K Lopes AL Gaya AC Oliveira A Effect of biological maturation on maximal oxygen uptake and ventilatory thresholds in soccer players: an allometric approach J Sports Sci 2011 29 1029 1039 21590578
- Marfell-Jones M Olds T Stewart A Carter L A Manual for Teaching Materials for Accreditation Potchefstroom, South Africa International Society for the Advancement of Kinanthropometry 2006
- Durnin JV Womersley J Body fat assessed from total body density and its estimation from skinfold thickness: measurements on 481 men and women aged from 16 to 72 years Br J Nutr 1974 32 77 97 4843734
- Hartung GH Lawrence SJ Reeves RS Foreyt JP Effect of alcohol and exercise on postprandial lipemia and triglyceride clearance in men Atherosclerosis 1993 100 33 40 8318061
- Walberg JL Aerobic exercise and resistance weight training during weight reduction. Implications for obese persons and athletes Sports Med 1989 7 343 356 2662322
- Porter C Cohen NH Indirect calorimetry in critically ill patients: role of the clinical dietitian in interpreting results J Am Diet Assoc 1996 96 49 57 8537570
- Broom DR Stensel DJ Bishop NC Burns SF Miyashita M Exercise-induced suppression of acylated ghrelin in humans J Appl Physiol 2007 102 2165 2171 17347386
- King JA Wasse LK Ewens J Differential acylated ghrelin, peptide YY3-36, appetite, and food intake responses to equivalent energy deficits created by exercise and food restriction J Clin Endocrinol Metab 2011 96 1114 1121 21270331
- Scheid JL De Souza MJ Leidy HJ Williams NI Ghrelin but not peptide YY is related to change in body weight and energy availability Med Sci Sports Exerc 2011 43 2063 2071 21502892
- Ravussin E Tschop M Morales S Bouchard C Heiman ML Plasma ghrelin concentration and energy balance: overfeeding and negative energy balance studies in twins J Clin Endocrinol Metab 2001 86 4547 4551 11549706
- Wideman L Weltman JY Hartman ML Veldhuis JD Weltman A Growth hormone release during acute and chronic aerobic and resistance exercise: recent findings Sports Med 2002 32 987 1004 12457419
- St-Pierre DH Karelis AD Coderre L Association of acylated and nonacylated ghrelin with insulin sensitivity in overweight and obese postmenopausal women J Clin Endocrinol Metab 2007 92 264 279 17062757
- Krekoukia M Nassis GP Psarra G Skenderi K Chrousos GP Sidossis LS Elevated total and central adiposity and low physical activity are associated with insulin resistance in children Metabolism 2007 56 206 213 17224334