
Abstract
Background
Well-known risk factors for cognitive impairment are also associated with obesity. Research has highlighted genetic risk factors for obesity, yet the relationship of those risk factors with cognitive impairment is unknown. The objective of this study was to determine the associations between cognition, hypertension, diabetes, sleep-disordered breathing, and obesity. Genetic risk factors of obesity were also examined.
Methods
The sample consisted of 369 nondemented individuals aged 50 years or older from four community cohorts. Primary outcome measures included auditory verbal memory, as measured by the Rey Auditory Verbal Learning Test, and executive functioning, as measured by the Color–Word Interference Test of the Delis–Kaplan Executive Function System battery. Apnea–hypopnea index indicators were determined during standard overnight polysomnography. Statistical analyses included Pearson correlations and linear regressions.
Results
Poor executive function and auditory verbal memory were linked to cardiovascular risk factors, but not directly to obesity. Genetic factors appeared to have a small but measureable association to obesity.
Conclusion
A direct linkage between obesity and poor executive function and auditory verbal memory is difficult to discern, possibly because nonobese individuals may show cognitive impairment due to insulin resistance and the “metabolic syndrome”.
Introduction
The purpose of this work is to clarify how obesity may be related to cognitive changes in older adults, with a focus on assessing the role of potential genetic markers. According to the Centers for Disease Control and Prevention, over one-third of the population is considered obese. Older adults are more likely to experience obesity than younger adults, with almost 40% of those aged over 60 years meeting criteria for obesity.Citation1 Obesity is associated with numerous negative outcomes, including diminished life expectancy,Citation2 functional disability,Citation3 and impaired quality of life.Citation4 Additionally, there is mounting evidence that suggests that obesity is linked to decreased cognitive performanceCitation5 and increased risk for dementia in later life.Citation6
Although epidemiological research has implicated the role of obesity in cognitive aging,Citation7 the mechanisms (eg, direct versus [vs] indirect) through which obesity exerts its effects are not known. Several large-scale metabolic studies have identified single nucleotide polymorphisms (SNPs) associated with the development of obesity, as measured by body mass index (BMI). In a recent meta-analysis of relevant studies involving 249,796 individuals, two genes (FTO and TMEM18) and associated SNPs (rs9930333 and rs2867125, respectively) were highly significantly (P=4.8 × 10−120 and P=2.8 × 10−49) and most closely associated with BMI.Citation8 Interestingly, the FTO SNP has since been implicated in cognitive decline in middle-aged adults.Citation9 The results of the Bressler et alCitation9 study, in over 15,000 individuals, were of particular interest, as the effects of FTO polymorphisms on cognition were found to be independent of diabetes, hypertension, and BMI.
In contrast to the perspective provided by the Bressler et alCitation9 study, some evidence suggests that medical comorbidities associated with obesity increase the risk of cognitive impairment. For instance, obesity increases the risk of conditions such as hypertension,Citation10 diabetes,Citation11 and sleep-disordered breathing (SDB).Citation12 Hypertension, diabetes, and SDB have been linked to cognitive impairment.Citation13–Citation16
The purpose of this work is to determine whether obesity is related to auditory verbal memory and executive function. We will then explore the nature of that relationship and possible direct pathways (genetic factors FTO and TMEM18), as well as indirect pathways (BMI-related disorders, hypertension, SDB, and diabetes) through which obesity may exert its effects on these two facets of cognition.
Methods
Subjects
The subjects consisted of four cohorts recruited for different studies, all of whom were aged 50 years or older and had genetic information, BMI, and cognitive performance data on the Rey Auditory Verbal Learning Task (RAVLT). Informed consents, approved by Stanford University, CA, USA, and VA Palo Alto Health Care System, CA, USA, Institutional Review Boards, were obtained from all subjects. All subjects were community dwelling and nondemented according to clinical records and neuropsychological evaluations. The cohorts are described as follows and their demographics are presented in .
Table 1 Demographics and comorbidities
Cohort 1
This cohort consisted of 121 community-dwelling male veterans aged 55 years or olderCitation17,Citation18 who were recruited into a study of the effects of post-traumatic stress disorder, sleep apnea, and cognition, through media advertisement, contact with local veteran agencies, and clinician referral from the outpatient clinics of the VA Palo Alto Health Care System. These participants had previously been genotyped, completed the RAVLT, and had extensive medical and sleep evaluations performed.
Cohort 2
Participants were 58 volunteers who completed a neuroimaging (magnetic resonance imaging) study as part of the ongoing Stanford/VA Aviation Study, a longitudinal study of recreational and commercial pilots.Citation19 The magnetic resonance imaging study recruited Aviation Study participants who were aged at least 50 years and still actively flying. These participants had previously been genotyped and also had completed the RAVLT.
Cohort 3
Participants were 67 community-dwelling older adults recruited through advertisements and local senior centers for the investigation of sleep and behavioral outcomes.Citation20 These participants had also previously been genotyped and also had completed the RAVLT.
Cohort 4
Subjects were 123 community-dwelling older adults participating in an investigation of cognitive decline.Citation21 They were recruited through advertisements and local senior centers. Recruitment advertisements were general in nature, asking for individuals who were interested in participating in “a study of stress and cognitive functioning in older adults”. As in the other cohorts, these participants also had previously been genotyped and had completed the RAVLT.
Measures
Cognitive assessments, self-reported health measures, and overnight polysomnography were performed at study entry by trained clinicians or technicians.
Cognitive assessments
Auditory verbal memory was assessed with the RAVLT,Citation22 a reliable and valid measure of verbal learning and memory.Citation23,Citation24 Note that a higher RAVLT score indicates higher levels of cognitive functioning. For the purposes of these analyses, we used the sum of trials I through V of the RAVLT.
In Cohort 1, executive function was assessed with the Color–Word Interference Test (CWIT) from the Delis–Kaplan Executive Function System battery.Citation25 For this study we used a CWIT time score, which was calculated by subtracting the average time it took each subject to complete the color and word naming tasks from the time it took each subject to complete the color–word interference task (interference time − [{color naming time + word naming time}/2]). A higher CWIT score indicates lower levels of cognitive functioning.
Demographics, BMI-related disorders, and BMI
BMI was determined for all cohorts using standard procedures ([weight in pounds × height in inchesCitation2] × 703). Subjects in Cohort 1 also completed detailed health questionnaires, including self-reported BMI-related disorders of interest (ie, hypertension and diabetes).
Genetic analysis
The allelic status of FTO and TMEM18 was determined in all subjects. Genomic DNA was extracted from frozen whole blood samples using the method of Lahiri and Nurnberger.Citation26 DNA isolation from plasma was performed using the protocol of Fowke et al.Citation27 In our laboratory for genetic analyses we use an Illumina BeadArray platform (Illumina, Inc., San Diego, CA, US) for high-throughput multiplexed SNP genotyping using Human 610 Quad gene chip. The system uses high-density BeadArray technology in combination with an allele-specific extension, adapter ligation, and amplification assay protocol. FTO and TMEM18 allelic status were obtained through this system.
Polysomnography
SDB was assessed for Cohort 1 using unattended, overnight polysomnography (Safiro Ambulatory PSG System, Compumedics, Charlotte, NC, US). All data were scoredCitation28 for sleep staging and respiratory events by a registered polysomnographic technologist and were reviewed by a diplomat of the American Board of Sleep Medicine (Dr Cheng). The main outcome measure was the Apnea–Hypopnea Index (AHI), a descriptor of the severity of SDB. Apnea was defined as a “cessation or near complete cessation (greater than 70% reduction) of airflow for a minimum of 10 seconds”, and a hypopnea was “a greater than 30% reduction of amplitude in thoracoabdominal movement or airflow as compared to baseline with a greater than 4% oxygen desaturation”. The AHI represents “the number of apneas and hypopneas divided by the number of hours of sleep”.Citation29 All subjects with clinically significant SDB (defined as AHI ≥10) agreed to have their primary medical doctors notified of this finding.
Statistical analyses
Pearson correlations and their 95% confidence intervals, as well as linear regressions, were performed using the PROC CORR and GLM procedures in SAS software, version 9.1.3 (SAS Institute Inc., Cary, NC, US). Dependent variables were RAVLT and CWIT performance. Predictors were BMI, hypertension, diabetes, SDB, and the FTO and TMEM18 SNPs. FTO and TMEM18 allele statuses were coded as the number of “G” alleles (0, 1, or 2). Self-reported hypertension and diabetes were coded as 0= no and 1= yes, and SDB was coded as 0= no, where AHI score was <10, and 1= yes, where AHI score was ≥10.
Results
Results were computed in two phases. In Phase I the general relationship between the genetic markers, the RAVLT, and BMI was examined using consistently collected data from the 336 subjects with complete data in all four cohorts. Then, in Phase II, using Cohort 1 data, we examined in detail the relationships between the genetic markers, RAVLT, and BMI, as well as measures of executive function, hypertension, diabetes, and SDB. For each phase, complete case analyses were used.
In Phase I, we found no statistically significant Pearson correlations between the genetic markers and BMI, and between BMI and RAVLT (). In Phase II, we computed Pearson correlations between the factors of interest in our model listed previously (: RAVLT; : CWIT). Statistically significant correlations are asterisked.
Figure 1 All cohorts: Pearson correlations between model factors (N=336 for all associations).
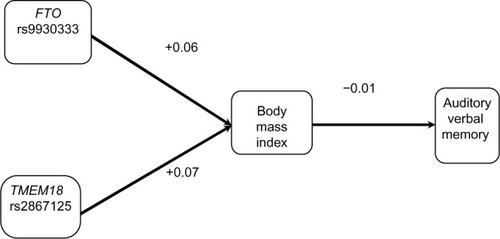
Figure 2 Cohort 1: Pearson correlations between model factors (N=88 for body mass index vs N=89 for obesity single nucleotide polymorphism associations. N=115–121 for other associations).
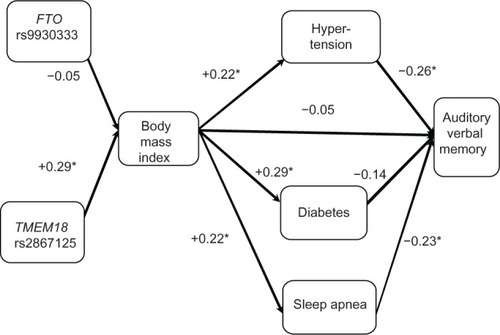
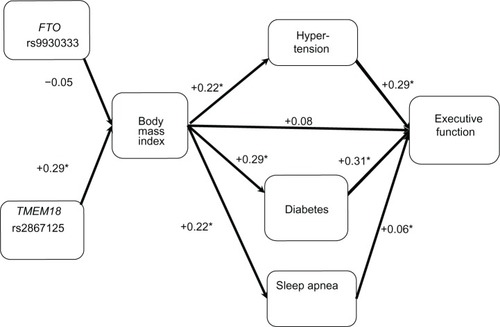
Figure 3 Cohort 1: Pearson correlations between model factors. Executive function (Color–Word Interference Test) is dependent variable (N=88 for body mass index vs N=89 for obesity single nucleotide polymorphism associations. N=115–121 for other associations).
As seen in , BMI was not correlated with the RAVLT (r=−0.05); however, BMI was associated with medical comorbidities that are themselves associated with cognition. Specifically, BMI was associated with hypertension (r=0.22), diabetes (r=0.29), and SDB (r=0.22). In turn, hypertension (r=−0.26) and SDB (r=−0.23) were both associated with RAVLT, whereas diabetes was not (r=−0.14). Lastly, we examined two known genetic risk factors for high BMI (ie, FTO and TMEM18). The TMEM18 SNP was significantly associated with BMI (r=0.29), whereas the FTO SNP was not found to be significantly associated with BMI (r=−0.05).
In , we found that BMI was not correlated with CWIT (r=0.08), whereas BMI-related disorders were associated with CWIT. Specifically, hypertension (r=0.29) and diabetes (r=0.31) were associated with BMI; however, SDB (r=0.06) was not. As in the case of the RAVLT, we also found that the TMEM18 SNP (r=0.29), but not FTO SNP (r=−0.05), was associated with high BMI. The 95% confidence intervals for these results are presented in .
Table 2 Ninety-five percent confidence intervals for Pearson correlations presented in –
To better understand the nature of these correlations with the risk factors for cognitive impairment, we partitioned and calculated the probability (under the additive model) of a condition (hypertension, diabetes, SDB) in relation to BMI, and tested the predicted value and residual value of the condition simultaneously to see how much each portion contributed to cognition. For example, in , we first examined the triplet of RAVLT, hypertension, and BMI. Here we use the term “triplet” to define a grouping of three relevant variables. First, we performed a linear regression with hypertension as the dependent variable and BMI as the predictor. BMI was found to be a significant predictor of hypertension, consistent with the reported Pearson correlation of 0.22. We obtained the predicted hypertension for each individual and the residual hypertension (observed hypertension – predicted [fitted value]). Next, we ran a multivariate linear regression with RAVLT as the dependent variable and with the predicted hypertension and residual hypertension as predictors. The residual hypertension was a statistically significant predictor of RAVLT, consistent with the reported Pearson correlation of –0.26, whereas the predicted hypertension was not. We can say that the portion of hypertension independent of higher BMI was associated with lower RAVLT, but the portion of hypertension associated with higher BMI was not associated with lower RAVLT. In other words, lower RAVLT scores were significantly associated with the portion of hypertension that was independent of BMI.
We found a similar association between the triplet of RAVLT, SDB, and BMI (see ). BMI was a significant predictor of SDB. When the residual SDB and predicted SDB were included as predictors of RAVLT, the residual SDB was found to be a statistically significant predictor, whereas the predicted value was not. Thus, whereas BMI was associated with SDB, the portion of SDB that was associated with BMI was not associated with the RAVLT. We also analyzed the triplet of RAVLT, diabetes, and BMI and found that the association between RAVLT and diabetes was not significant.
These analyses were repeated in order to examine the associations between the risk factors, BMI, and executive function. As seen in , BMI was again found to be a significant predictor of hypertension, but the portion of hypertension associated with BMI was not a significant predictor of CWIT. The portion of hypertension independent of BMI was found to be a significant predictor of CWIT. Analyses of the diabetes, CWIT, and BMI triplet revealed that BMI was a significant predictor of diabetes. The residual value of diabetes was a significant predictor of CWIT, whereas the predictive value was not. Thus, the portion of diabetes that was not associated with BMI was found to predict CWIT. Finally, we examined the triplet of CWIT, SDB, and BMI. SDB was not a significant predictor of CWIT.
Finally, we examined the obesity gene (FTO or TMEM18), BMI, and condition (hypertension, diabetes, or sleep apnea) triplets in the same fashion (six total triplets), which are reported in both . In the three TMEM18 triplets, TMEM18 was significantly associated with the portion of BMI that was independent of condition (hypertension, diabetes, or sleep apnea).
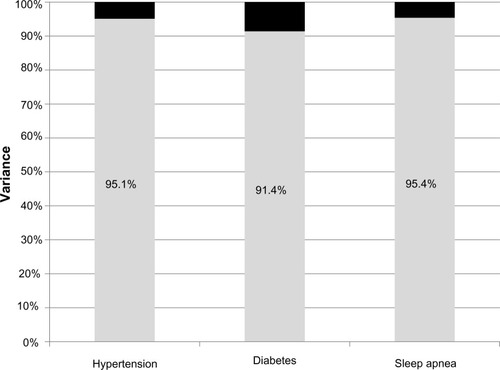
displays the portion of variance explained by predicted and residual values for condition. The portion of variance explained by the residual value ranges from 91.4% for diabetes to 95.4% for sleep apnea.
Figure 4 Portion of variance explained by predicted and residual values. Black bar indicates portion of variance explained by predicted value. Grey bar indicates portion of variance explained by residual value.
Discussion
This study investigated the relationship between cognition and obesity in nondemented community-dwelling individuals aged 50 years or older. In this sample, lower cognitive performance was associated with obesity-related disorders, including hypertension, diabetes, and SDB. Further analyses revealed that although obesity is associated with each of these risk factors, it has a relatively small impact on poor cognitive performance. Genetic risk factors were also found to have a small association to obesity.
It is interesting that the portion of obesity-related disorders that is associated with cognitive impairment is the portion that is unrelated to obesity. A key factor independently associated with SDB, hypertension, and diabetes is insulin resistance.Citation30 Those with metabolic syndrome have been shown to develop cognitive impairment more rapidly than those with normal metabolic profiles.Citation31 Thus, it may be that insulin resistance-related disorders or complex behaviors affecting weight, like binge eating, are associated with poor cognition,Citation32,Citation33 but the current study cannot provide information on these issues. Measures relevant to insulin resistance should be collected in future studies.
Regarding strengths and limitations of this study, the use of polysomnography for diagnosis of SDB is a strength; however, the reliance on self-report data for the classification of diabetes and hypertension is a limitation. These comorbidities could be undiagnosed or misdiagnosed. Thus, although informative, this work is exploratory in nature and no assumptions can be made regarding causality in these relationships. The generalizability of this study is also limited, as a large proportion of the subjects were veterans. In addition, the overall number of subjects remains small, such that the genetics findings may not be consistent across cohorts. For example, there are relatively higher correlations of the TMEM18 SNP in one cohort but not others. Finally, analysis of cognition was limited to auditory verbal memory and executive function.
Conclusion
The results suggest that in nondemented community- dwelling older individuals, cognitive decline is associated with obesity-related disorders (ie, diabetes, hypertension, and SDB). However, a direct linkage between obesity and poor executive function and auditory verbal memory is difficult to discern. This may be due, in part, to the fact that nonobese individuals may show cognitive impairment due to insulin resistance and the “metabolic syndrome” rather than weight. Future research should assess markers of insulin resistance to better elucidate these relationships.
Author contributions
Yesavage, Kinoshita, Fairchild, Taylor, Kulick, Friedman, Cheng, Zeitzer, and O’Hara made substantial contributions to the conception and design of the article; Noda and Lazzeroni performed the analysis and interpretation of data. Yesavage and Fairchild drafted the article and Kinoshita, Lazzeroni, Taylor, Kulick, Friedman, Cheng, Zeitzer, O’Hara and Noda revised the article critically for important intellectual content. All authors gave final approval of the version to be published and agree to be accountable for all aspects of the work, ensuring that questions related to the accuracy and integrity of any part of the work are appropriately investigated and resolved.
Acknowledgments
This research was supported by the Sierra-Pacific Mental Illness Research, Education, and Clinical Center (MIRECC) and the Medical Research Service of the Department of Veterans Affairs. An earlier version was presented at the XVII International DALM Symposium on Diabetes, Obesity, and the Metabolic Syndrome held in Doha, Qatar, on March 14–16, 2011.
Disclosure
The authors report no conflicts of interest in this work.
References
- Ogden CL Carroll MD Kit BK Flegal KM Prevalence of obesity in the United States, 2009–2010 NCHS Data Brief 2012 82 1 8 22617494
- Whitlock G Lewington S Sherliker P Body mass index and cause-specific mortality in 900,000 adults: collaborative analyses of 57 prospective studies Lancet 2009 373 9669 1083 1096 19299006
- Chen H Guo X Obesity and functional disability in elderly Americans J Am Geriatr Soc 2008 56 4 689 694 18266843
- Kolotkin R Meter K Williams G Quality of life and obesity Obes Rev 2001 4 219 229 12119993
- Cournot M Marquie J Ansiau D Relation between body mass index and cognitive function in middle aged men and women Neurology 2006 67 1208 1214 17030754
- Whitmer RA Gunderson EP Barrett-Connor E Quesenberry CPJr Yaffe K Obesity in middle age and future risk of dementia: a 27 year longitudinal population based study BMJ 2005 330 7504 1360 15863436
- Singh-Manoux A Czernichow S Elbaz A Obesity phenotypes in midlife and cognition in early old age: the Whitehall II cohort study Neurology 2012 79 8 755 762 22915175
- Speliotes EK Willer CJ Berndt SI Association analyses of 249,796 individuals reveal 18 new loci associated with body mass index Nat Genet 2010 42 11 937 948 20935630
- Bressler J Fornage M Demerath EW Fat mass and obesity gene and cognitive decline: the Atherosclerosis Risk in Communities Study Neurology 2013 80 1 92 99 23136261
- Yu JC Berger P3rd Sleep apnea and obesity S D Med 2011 Spec No 28 34 21717814
- Tang J Pei Y Zhou G When aging-onset diabetes is coming across with Alzheimer disease: comparable pathogenesis and therapy Exp Gerontol 2013 48 8 744 750 23648584
- Yaffe K Laffan AM Harrison SL Sleep-disordered breathing, hypoxia, and risk of mild cognitive impairment and dementia in older women JAMA 2011 306 6 613 619 21828324
- Biessels GJ Staekenborg S Brunner E Brayne C Scheltens P Risk of dementia in diabetes mellitus: a systematic review Lancet Neurol 2006 5 1 64 74 16361024
- Cherbuin N Reglade-Meslin C Kumar R Risk factors of transition from normal cognition to mild cognitive disorder: the PATH through Life Study Dement Geriatr Cogn Disord 2009 28 47 55 19628940
- Gasquoine PG Cognitive impairment in common, noncentral nervous system medical conditions of adults and the elderly J Clin Exp Neuropsychol 2011 33 4 486 496 21218318
- van den Berg E Kloppenborg R Kessel SR Kappelle L Biessels G Type 2 diabetes mellitus, hypertension, dyslipidemia and obesity: a systematic comparison of their impact on cognition Biochim Biophys Acta 2009 1792 5 470 481 18848880
- Yesavage JA Kinoshita LM Kimball T Sleep-disordered breathing in Vietnam veterans with posttraumatic stress disorder Am J Geriatr Psychiatry 2012 20 3 199 204 20808112
- Kinoshita LM Yesavage JA Noda A Modeling the effects of obstructive sleep apnea and hypertension in Vietnam veterans with PTSD Sleep Breath 2012 16 4 1201 1209 22193972
- Adamson MM Bayley PJ Scanlon BK Pilot expertise and hippocampal size: associations with longitudinal flight simulator performance Aviat Space Environ Med 2012 83 9 850 857 22946348
- Schroder CM Primeau MM Hallmayer JF Lazzeroni LC Hubbard JT O’Hara R Serotonin transporter polymorphism is associated with increased apnea-hypopnea index in older adults Int J Geriatr Psychiatry 2014 29 3 227 235 23754303
- O’Hara R Schroder CM Mahadevan R Serotonin transporter polymorphism, memory and hippocampal volume in the elderly: association and interaction with cortisol Mol Psychiatry 2007 12 6 544 555 17353910
- Rey A L’Examen Clinique en Psychologie Paris, France Presses Universitaires de France 1st edition 1958
- Rey A L’Examen Clinique en Psychologie Paris, France Presses Universitaires de France 2nd edition 1964
- Lezak MD Howieson DB Loring DW Neuropsychological Assessment New York Oxford University Press 2004
- Delis DC Kaplan E Kramer JH Delisle MB Kaplan Executive Function System San Antonio, TX The Psychological Corporation 2001
- Lahiri DK Nurnberger JIJr A rapid non-enzymatic method for the preparation of HMW DNA from blood for RFLP studies Nucleic Acids Res 1991 19 19 5444 1681511
- Fowke KR Plummer FA Simonsen JN Genetic analysis of human DNA recovered from minute amounts of serum or plasma J Immunol Methods 1995 180 1 45 51 7897247
- Rechtschaffen A Kales A A Manual of Standardized Terminology, Techniques and Scoring System for Sleep Stages of Human Subjects Washington, DC US Government Printing Office 1968
- American Academy of Sleep Medicine International Classification of Sleep Disorders. 2nd ed: Diagnostic and Coding Manual Westchester, IL American Academy of Sleep Medicine 2005
- Reaven GM Insulin resistance: the link between obesity and cardiovascular disease Med Clin North Am 2011 95 5 875 892 21855697
- McIntryre RS Cha DS Jerrell JM Obesity and mental Illness: implications for cognitive functioning Adv Ther 2013 30 577 588 23839214
- Cholerton B Baker LD Craft S Insulin, cognition, and dementia Eur J Pharmacol 2013 719 1–3 170 179 24070815
- Compare A Callus E Grossi E Mindfulness trait, eating behaviours and body uneasiness: a case-control study of binge eating disorder Eat Weight Disord 2012 17 4 e244 e251 23047298