
Abstract
Background
In recent years, the number of people with impaired glucose tolerance (IGT) has increased steadily worldwide. It is clear that the prevention of diabetes is important from the perspective of public health, medical care, and economics. It was recently reported that a low-carbohydrate diet (LCD) is useful for achieving weight loss and glycemic control, but there is no information about the effects of the LCD on IGT. We designed a 7-day in-hospital educational program focused on the LCD for IGT.
Methods
The subjects were 72 patients with IGT (36 in the LCD group and 36 in the control group) who were enrolled from April 2007–March 2012 and followed for 12 months. We retrospectively compared the LCD group with the control group.
Results
In 69.4% of the LCD group, blood glucose was normalized at 12 months and the 2-hour plasma glucose level in the oral glucose tolerance test (OGTT) was reduced by 33 mg/dL. In addition, the incidence of diabetes was significantly lower in the LCD group than in the control group at 12 months (0% versus 13.9%, P=0.02). The LCD group showed a significant decrease in fasting plasma glucose, hemoglobin A1c, the homeostasis model of assessment of insulin resistance value, body weight and serum triglycerides (TGs) at 12 months, while there was a significant increase of the serum high-density lipoprotein (HDL) cholesterol level.
Conclusion
The LCD is effective for normalizing blood glucose and preventing progression to type 2 diabetes in patients with IGT.
Introduction
Impaired glucose tolerance (IGT) is a less severe form of hyperglycemia that represents an intermediate stage in the development of type 2 diabetes.Citation1–Citation3 Twenty-five percent to 75% of individuals with IGT progress to diabetes within a decade of diagnosis.Citation4 In recent years, the numbers of new patients with type 2 diabetes and IGT have steadily increased around the world, and it is estimated that over 300 million people will have type 2 diabetes by the year 2025.Citation5 A number of large-scale clinical studies have made it clear that IGT is a major risk factor for cardiovascular disease.Citation6–Citation8 It is also clear that prevention of diabetes before its onset and aggressive treatment of this disease at an early stage is important from the perspective of public health, medical care, and economics.Citation9 In this context, several intervention studies have demonstrated the positive effects of lifestyle modification.Citation9–Citation14
It was recently reported that a low-carbohydrate diet (LCD) is useful for promoting weight loss and improving glycemic control,Citation15–Citation24 but it remains unclear whether the LCD can normalize blood glucose in IGT patients and prevent progression to type 2 diabetes. Against this background, we designed a 7-day in-hospital educational program focused on the LCD for IGT. The aim of the present study was to assess the efficacy of this program combined with diabetes education and support at 3-month intervals for normalizing blood glucose in IGT patients and preventing progression from IGT to type 2 diabetes.
Methods
The participants in the present study were 72 Japanese patients with IGT who were enrolled from April 2007–March 2013 at Japan Labour Health and Welfare Organization Niigata Rosai Hospital (Joetsu, Japan). We screened patients aged 20–75 years with a body mass index (BMI) <35 kg/m2, fasting glucose <126 mg/dL, and hemoglobin A1c (HbA1c) <7.0%. Patients were eligible for this study if they had IGT, which was defined as a glucose level of 140–199 mg/dL at 2 hours after a 75 g oral glucose load according to the 2003 American Diabetes Association criteria. In addition, all of the subjects were confirmed to have a serum triglyceride (TG) level <300 mg/dL and a serum low-density lipoprotein (LDL) cholesterol level <200 mg/dL. None of the patients were taking any medications that could influence glycemic control. Patients were excluded if they were pregnant or breastfeeding, had a serum creatinine level ≥2 mg/dL, had liver dysfunction, had gastrointestinal problems that would prevent them from following the prescribed diet, had active cancer, or were participating in another trial. This study was performed in conformity with the Declaration of Helsinki. Written informed consent was obtained from all patients and the Ethics Committee of the Japan Labor Health and Welfare Organization Niigata Rosai Hospital approved this study. We obtained consent for publication of all the materials in this article, including the individual information contained in the tables.
Interventions
Eligible participants were assigned to one of two groups, either a group that was hospitalized for 7 days of LCD education (LCD group) or a group that was not hospitalized and had no education (control group). The low-carbohydrate, unrestricted calorie diet aimed at a maximum daily intake of 120 g of carbohydrates. The objectives of the 7-day in-hospital educational program were to create motivation, provide information about diabetes and IGT, and change the patient’s eating habits. Lessons were taught by nutritionists, pharmacologists, nurses, and physicians on a one-to-one or group basis. After the hospital stay, we provided individual support sessions every 3 months with nutritionists, nurses, and physicians. In the control group, participants were given general information about diabetes and IGT. Their physicians also provided diabetes information brochures with general instructions on diet and lifestyle improvement, but there was no individual instruction or formal group counseling.
7-day LCD education program
The LCD group was admitted to hospital for 7 days to participate in an educational program. On the first day of the program, a physician gave a lecture about the LCD using slides that lasted for 60 minutes. On the second day, the subjects received individual lessons from nutritionists, pharmacologists, and nurses. After that, they ate the LCD every day and studied the diet using a textbook that was given to them. In compliance with the LCD, rice (the main dish) was offered at lunchtime only. The target was a total intake of 1,300 kcal per day. The nutritional composition of the food was 30% carbohydrates, 25% protein, and 45% fat. On the fifth day, the subjects completed some tests on the LCD (30 questions, true/false test), and discussed their diet with nutritionists, nurses, and physicians at a lunch meeting on the LCD. After that, they reviewed the diet and were discharged from hospital.
Follow-up
Subjects in both groups were asked to attend outpatient guidance sessions every 3 months and were also reviewed by their physicians at 3-month intervals. Body weight was measured and blood and urine samples were collected. The general health of each subject was assessed, and the results of the laboratory tests were explained by the physicians, who gave advice about diabetes or IGT for 5–10 minutes at every interview. Thereafter, subjects in the LCD group received 10- to 15-minute individual counseling sessions. We emphasized the total carbohydrate intake of less than 120 g per day without restricting total calories or fat. A 75 g oral glucose tolerance test (OGTT), fasting plasma glucose, fasting plasma insulin, serum LDL cholesterol level, serum high-density lipoprotein (HDL) cholesterol, and serum TGs were measured at every 3-month visit. The study was continued for 12 months.
Laboratory investigations
All blood samples were sent to the central laboratory at Niigata Rosai Hospital, and aliquots were stored at −70°C until analysis. Plasma glucose levels were determined by the glucose oxidation method (chemical reagents and Glucose ADAMS GA-1171 Analyzer; Arkray, Kyoto, Japan). HbA1c was measured by high-performance liquid chromatography (HPLC; ADAMS A1C HA-8181; Arkray). The value of HbA1c (%) was estimated as a National Glycohemoglobin Standardization Program (NGSP) equivalent value (%) derived from the Japanese Diabetes Society (JDS) value and calculated by the formula HbA1c (%) = HbA1c (JDS) (%) +0.4%.Citation25 Serum LDL cholesterol and serum HDL cholesterol levels were measured by the direct method without deposition (Sekisui Medical H-7700; Hitachi Ltd, Tokyo, Japan). Serum TGs were measured by the cholesterol oxidation enzyme and enzymatic colorimetry methods (Sekisui Medical H-7700). Plasma insulin levels were measured with an enzyme immunometric assay (Immulite Autoanalyzer; Diagnostic Products Corporation, Los Angeles, CA, USA), for which the coefficient of variation was 2.5%.
Statistical analysis
Intention-to-treat analysis was done on all patients in their assigned groups, regardless of whether they actually performed the specified intervention. Results are expressed as the mean ± standard deviation. The differences between baseline values and those after 12 months of treatment were evaluated using the paired t-test for continuous variables. Differences between the two groups were assessed using the unpaired t-test for continuous variables and by the chi-square test or Fisher’s exact probability test for categorical variables because the distribution of each variable did not differ significantly between the two groups. In all analyses, P<0.05 was considered significant and analyses were performed with StatView software (v5; BrainPower Inc., Calabasas, CA, USA).
Results
Patients
From April 2007–March 2013, we assigned 72 participants to the two groups (36 to the LCD group and 36 to the control group). There were no significant differences in the baseline characteristics between the two groups ().
Table 1 Baseline characteristics of the patients
Changes in glucose parameters
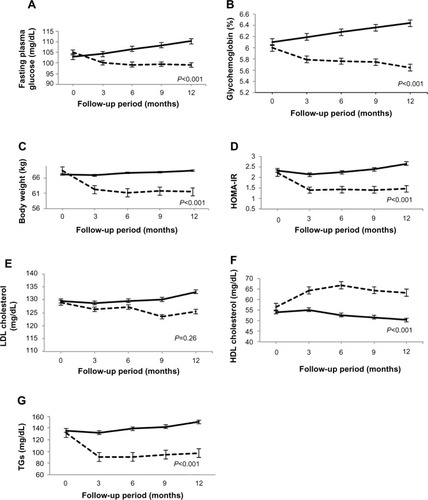
After 12 months, the 2-hour plasma glucose level of the LCD group showed a significant decrease in comparison with baseline in the OGTT (P<0.001). On the other hand, the control group showed a significant increase in the 2-hour plasma glucose compared with baseline (P<0.01). After 12 months, the 2-hour plasma glucose level in the OGTT was significantly lower in the LCD group than in the control group (P<0.001; and ). In the LCD group, 25 patients achieved resolution of IGT with normalization of glucose levels, eleven patients still had IGT, and no patient developed type 2 diabetes. In the control group, three patients achieved resolution of IGT, 28 patients still had IGT, and five patients progressed to type 2 diabetes. The IGT normalization rate was significantly higher in the LCD group (25/36, 69.4%) than in the control group (3/36, 8%) (P<0.001), while the incidence of diabetes was significantly lower in the LCD group (0/36, 0%) than in the control group (5/36, 13.9%) (P=0.02). Fasting plasma glucose and HbA1c both showed a significant decrease compared with baseline in the LCD group (P<0.01 and P<0.001, respectively). On the other hand, both parameters increased significantly compared with baseline in the control group (P<0.01 and P<0.001, respectively). Changes in fasting plasma glucose and HbA1c over the 1-year period were significantly different between the two groups (P<0.001; ).
Table 2 Endpoints at 12 months
Figure 1 Plasma glucose at 2 hours after an oral glucose load (12-month endpoint).
Abbreviation: LCD, low-carbohydrate diet.
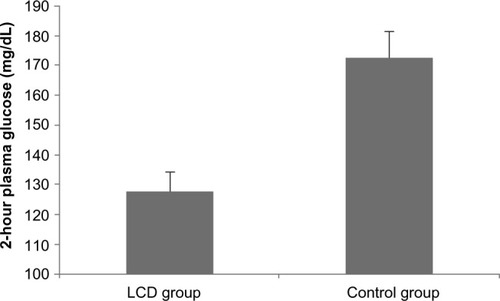
Figure 2 (A) Profile of fasting plasma glucose; (B) glycohemoglobin; (C) body weight; (D) HOMA-IR; (E) LDL cholesterol; (F) HDL cholesterol; and (G) TGs in each group.
Abbreviations: HDL, high-density lipoprotein; HOMA-IR, homeostasis model of assessment of insulin resistance; LCD, low-carbohydrate diet; LDL, low-density lipoprotein; TGs, triglycerides.
Changes in body weight
After 12 months, the LCD group showed a significant decrease in weight compared with baseline (P<0.001). In contrast, the body weight of the control group increased significantly compared with baseline (P<0.01). The weight of the LCD group was significantly lower than that of the control group at 12 months (P<0.001; and ).
Changes in insulin resistance
At 12 months, both hyperinsulinemia and homeostasis model of assessment of insulin resistance (HOMA-IR) were improved in the LCD group compared with the control group (P<0.001; ). In the LCD group, HOMA-IR showed a significant decrease compared with baseline (P<0.01), while HOMA-IR increased significantly relative to baseline in the control group (P<0.01). The 12-month change in HOMA-IR was significantly greater in the LCD group than in the control group (P<0.001; ).
Changes in lipids – LDL cholesterol, HDL cholesterol, and TGs
The serum LDL cholesterol level of the LCD group was slightly decreased (P=0.55 versus baseline) and that of the control group was slightly increased at 12 months (P=0.53 versus baseline), but there was no significant difference between the two groups (P=0.26; and ). After 12 months, the serum HDL cholesterol level of the LCD group showed a significant increase (P<0.001), while that of the control group decreased significantly (P<0.001). Thus, the 12-month changes of serum HDL cholesterol were significantly different between the two groups (P<0.001; and ). After 12 months, serum TGs significantly decreased in the LCD group (P<0.01), and significantly increased in the control group (P<0.01). Thus, the 12-month changes of TGs were significantly different between the two groups (P<0.001; and ).
Adverse events
None of the subjects in either group experienced any adverse events.
Discussion
The present study demonstrated that a 7-day in-hospital educational program focused on a LCD is effective for blood glucose normalization in IGT patients and for preventing progression from IGT to type 2 diabetes. The blood glucose normalization rate was 69.4% in the LCD group, which is higher than previously reported with a low-fat diet (LFD) (26%–47%).Citation12,Citation26 In the OGTT, the 2-hour plasma glucose level was reduced by 33 mg/dL in the LCD group, which was greater than the decrease in previous LFD studies (22–29 mg/dL).Citation12,Citation27 The 1-year incidence of diabetes among IGT patients in the control group was 13.9%, which was within the range suggested by epidemiological data (1.5%–15.7%).Citation11,Citation26–Citation30 On the other hand, the 1-year incidence of diabetes was 0% in the LCD group, which was significantly lower than in the control group (P=0.02) or in previous LFD studies (2.0%–12.5%).Citation10,Citation26,Citation28 Although we did not assess the long-term effects of the LCD, we consider that this diet reduces progression to diabetes in the IGT population more effectively than a LFD.
The following reasons can be suggested for the high blood glucose normalization rate. First, it is likely that participants with IGT have glucose intolerance due to excessive carbohydrate intake; hence, restriction of their carbohydrate intake leads to blood glucose normalization. In fact, the blood glucose level of most subjects in the LCD group decreased after a few days of hospitalization in comparison with baseline. Second, because the LCD does not regulate the total calorie intake and allows patients to eat enough of various foods, it seems that the LCD is easier to understand and conform to than the LFD. Third, several studies have indicated that the LCD is more effective for achieving weight loss than the LFD.Citation15–Citation24 The LCD group achieved a mean weight loss of 10.6% at 12 months, which was within the range suggested by previous reports on low-carbohydrate therapies (3.4%–10.9%).Citation18–Citation20 This marked weight reduction with the LCD may have led to blood glucose normalization in the LCD group and prevented progression to type 2 diabetes. Moreover, HOMA-IR was significantly lower at 12 months compared with baseline in the LCD group. Weight reduction probably contributed to the improvement of insulin resistance.
In this study, we observed a significant increase of HDL cholesterol and a significant decrease of TGs; however, there was no significant alteration of the LDL cholesterol level. Recent studies have shown that the LCD is better for achieving weight loss, decreasing TGs, and increasing HDL cholesterol, while the LFD is better for decreasing total cholesterol and LDL cholesterol levels.Citation24 We obtained similar results, which suggests that the LCD might have a weak effect on reducing LDL cholesterol.
We designed the 7-day in-hospital educational program so that it focused on the LCD. Subjects in the LCD group could study the LCD, actually eat the diet, and change their eating habits during a 7-day hospital stay. On the last hospital day, most subjects already displayed weight loss and a decrease in glucose, and they were praised for achieving this goal, which might have increased their confidence and motivation. The LCD group also received 10- to 15-minute individual counseling sessions every 3 months, and this level of support was sufficient for maintaining their knowledge and motivation.
Our study had several limitations. First, it was a case–control study and we could not determine whether both groups had the same unknown bias that affected glucose tolerance. Second, we treated a small number of Japanese patients for a short period. Therefore, a large-scale trial would be needed to confirm the generality of our findings. Third, we did not have a LFD group as one of the study groups; hence, we could not assess the superiority of the LCD over the LFD.
Conclusion
Our study demonstrated that a 7-day LCD education program and periodic interval follow-up are effective for achieving blood glucose normalization and preventing progression to type 2 diabetes in patients with IGT. The LCD significantly decreased the 2-hour plasma glucose in the OGTT, as well as fasting plasma glucose, HbA1c, HOMA-IR, body weight, and serum TGs at 12 months, while significantly increasing the serum HDL cholesterol level. However, a large-scale study is necessary to confirm the efficacy of the LCD for IGT.
Disclosure
The authors report no conflicts of interest in this work.
References
- National Diabetes Data Group Classification and diagnosis of diabetes mellitus and other categories of glucose intolerance Diabetes 1979 28 12 1039 1057 510803
- Saad MF Knowler WC Pettitt DJ Nelson RG Charles MA Bennett PH A two-step model for development of non-insulin-dependent diabetes Am J Med 1991 90 2 229 235 1996593
- Lillioja S Mott DM Howard BV Impaired glucose tolerance as a disorder of insulin action. Longitudinal and cross-sectional studies in Pima Indians N Engl J Med 1988 318 19 1217 1225 3283552
- Saad MF Knowler WC Pettitt DJ Nelson RG Mott DM Bennett PH The natural history of impaired glucose tolerance in the Pima Indians N Engl J Med 1988 319 23 1500 1506 3054559
- King H Aubert RE Herman WH Global burden of diabetes, 1995–2025: prevalence, numerical estimates, and projections Diabetes Care 1998 21 9 1414 1431 9727886
- DECODE Study Group Glucose tolerance and mortality: comparison of WHO and American Diabetes Association diagnostic criteria. The DECODE study group. European Diabetes Epidemiology Group. Diabetes Epidemiology: Collaborative analysis Of Diagnostic criteria in Europe Lancet 1999 354 9179 617 621 10466661
- Fujishima M Kiyohara Y Kato I Diabetes and cardiovascular disease in a prospective population survey in Japan: The Hisayama Study Diabetes 1996 45 Suppl 3 S14 S16 8674881
- Tominaga M Eguchi H Manaka H Igarashi K Kato T Sekikawa A Impaired glucose tolerance is a risk factor for cardiovascular disease, but not impaired fasting glucose. The Funagata Diabetes Study Diabetes Care 1999 22 6 920 924 10372242
- Harris MI Diabetes in America: epidemiology and scope of the problem Diabetes Care 1998 21 Suppl 3 C11 C14 9850480
- Kawahara T Takahashi K Inazu T Reduced progression to type 2 diabetes from impaired glucose tolerance after a 2-day in-hospital diabetes educational program: the Joetsu Diabetes Prevention Trial Diabetes Care 2008 31 10 1949 1954 18591401
- Pan XR Li GW Hu YH Effects of diet and exercise in preventing NIDDM in people with impaired glucose tolerance. The Da Qing IGT and Diabetes Study Diabetes Care 2008 20 4 537 544 9096977
- Knowler WC Barrett-Connor E Fowler SE Diabetes Prevention Program Research Group Reduction in the incidence of type 2 diabetes with lifestyle intervention or metformin N Engl J Med 2002 346 6 393 403 11832527
- Herman WH Hoerger TJ Brandle M Diabetes Prevention Program Research Group The cost-effectiveness of lifestyle modification or metformin in preventing type 2 diabetes in adults with impaired glucose tolerance Ann Intern Med 2005 142 5 323 332 15738451
- Genuth S Alberti KG Bennett P Expert Committee on the Diagnosis and Classification of Diabetes Mellitus Follow-up report on the diagnosis of diabetes mellitus Diabetes Care 2003 26 11 3160 3167 14578255
- Shai I Schwarzfuchs D Henkin Y Dietary Intervention Randomized Controlled Trial (DIRECT) Group Weight loss with a low-carbohydrate, Mediterranean, or low-fat diet N Engl J Med 2008 359 3 229 241 18635428
- Busetto L Marangon M De Stefano F High-protein low-carbohydrate diets: what is the rationale? Diabetes Metab Res Rev 2011 27 3 230 232 21309052
- Wycherley TP Brinkworth GD Keogh JB Noakes M Buckley JD Clifton PM Long-term effects of weight loss with a very low carbohydrate and low fat diet on vascular function in overweight and obese patients J Intern Med 2009 267 5 452 461 20141567
- Yarcy WSJr Westman EC McDuffie JR A randomized trial of a low-carbohydrate diet vs orlistat plus a low-fat diet for weight loss Arch Intern Med 2010 170 2 136 145 20101008
- Davis NJ Tomuta N Schechter C Comparative study of the effects of a 1-year dietary intervention of a low-carbohydrate diet versus a low-fat diet on weight and glycemic control in type 2 diabetes Diabetes Care 2009 32 7 1147 1152 19366978
- Foster GD Wyatt HR Hill JO Weight and metabolic outcomes after 2 years on a low-carbohydrate versus low-fat diet: a randomized trial Ann Intern Med 2010 153 3 147 157 20679559
- Sasakabe T Haimoto H Umegaki H Wakai K Effects of a moderate low-carbohydrate diet on preferential abdominal fat loss and cardiovascular risk factors in patients with type 2 diabetes Diabetes Metab Syndr Obes 2011 4 167 174 21779148
- Vetter ML Wade A Womble LG Dalton-Bakes C Wadden TA Igbal N Effect of a low-carbohydrate diet versus a low-fat, calorie-restricted diet on adipokine levels in obese, diabetic participants Diabetes Metab Syndr Obes 2010 3 357 361 21437105
- Haimoto H Sasakabe T Wakai K Umegaki H Effects of a low-carbohydrate diet on glycemic control in outpatients with severe type 2 diabetes Nutr Metab (Lond) 2009 6 21 19419563
- Foster GD Wyatt HR Hill JO A randomized trial of a low-carbohydrate diet for obesity N Engl J Med 2003 348 21 2082 2090 12761365
- Seino Y Nanjo K Tajima N The Committee of Japan Diabetes Society on the diagnostic criteria of diabetes mellitus: Report of the Committee on the classification and diagnostic criteria of diabetes mellitus J Diabetes Invest 2010 1 212 228
- Chiasson JL Josse RG Gomis R Hanefeld M Karasik A Laakso M STOP-NIDDM Trail Research Group Acarbose for prevention of type 2 diabetes mellitus: the STOP-NIDDM randomised trial Lancet 2002 359 9323 2027 2077 12076573
- Eriksson KF Lingärde E Prevention of type 2 (non-insulin-dependent) diabetes mellitus by diet and physical exercise. The 6-year Malmö feasibility study Diabetologia 1991 34 12 891 898 1778354
- Tuomilehto J Lindström J Eriksson JG Finnish Diabetes Prevention Study Group Prevention of type 2 diabetes mellitus by changes in lifestyle among subjects with impaired glucose tolerance N Engl J Med 2001 344 18 1343 1350 11333990
- Harris MI Impaired glucose tolerance – prevalence and conversion to NIDDM Diabet Med 1996 13 3 Suppl 2 S9 S11 8689862
- Modan M Karasik A Halkin H Effects of past and concurrent body mass index on prevalence of glucose intolerance and type 2 (non-insulin-dependent) diabetes and on insulin response. The Israel study of glucose intolerance, obesity and hypertension Diabetologia 1986 29 2 82 89 3516770