
Abstract
Purpose
Leucine activates SIRT1/AMP-activated protein kinase (AMPK) signaling and markedly potentiates the effects of other sirtuin and AMPK activators on insulin signaling and lipid metabolism. Phosphodiesterase 5 inhibition increases nitric oxide–cGMP signaling, which in turn exhibits a positive feedback loop with both SIRT1 and AMPK, thus amplifying peroxisome proliferator-activated receptor γ co-activator α (PGC1α)-mediated effects.
Methods
We evaluated potential synergy between leucine and PDE5i on insulin sensitivity and lipid metabolism in vitro and in diet-induced obese (DIO) mice.
Results
Leucine (0.5 mM) exhibited significant synergy with subtherapeutic doses (0.1–10 nM) of PDE5-inhibitors (sildenafil and icariin) on fat oxidation, nitric oxide production, and mitochondrial biogenesis in hepatocytes, adipocytes, and myotubes. Effects on insulin sensitivity, glycemic control, and lipid metabolism were then assessed in DIO-mice. DIO-mice exhibited fasting and postprandial hyperglycemia, insulin resistance, and hepatic steatosis, which were not affected by the addition of leucine (24 g/kg diet). However, the combination of leucine and a subtherapeutic dose of icariin (25 mg/kg diet) for 6 weeks reduced fasting glucose (38%, P<0.002), insulin (37%, P<0.05), area under the glucose tolerance curve (20%, P<0.01), and fully restored glucose response to exogenous insulin challenge. The combination also inhibited hepatic lipogenesis, stimulated hepatic and muscle fatty acid oxidation, suppressed hepatic inflammation, and reversed high-fat diet-induced steatosis.
Conclusion
These robust improvements in insulin sensitivity, glycemic control, and lipid metabolism indicate therapeutic potential for leucine–PDE5 inhibitor combinations.
Introduction
Sirtuin 1 (SIRT1) and AMP-activated protein kinase (AMPK) are well established as key sensors of energy status,Citation1–Citation4 sensing energy deprivation via elevations in NAD+ and AMP, respectively. Notably, due to their cross-activation, AMPK and SIRT1 are targets of common activators and produce overlapping outcomes via stimulation of peroxisome proliferator-activated receptor γ co-activator α (PGC1 α) to regulate mitochondrial biogenesis and energy expenditure.Citation5,Citation6 The SIRT1–AMPK axis is suppressed in energy replete states, including obesity and diabetes, while activation of this axis improves hyperglycemia, insulin resistance, and lipid metabolism.Citation7–Citation9
Our previous work demonstrated that the branched chain amino acid L-leucine activates SIRT1Citation10–Citation13 by lowering its activation energy for NAD+,Citation10 with secondary activation of AMPK.Citation11 This shift in SIRT1 sensitivity to NAD+ enables activation of this energy sensor at lower NAD+ concentrations, characteristic of energy replete states, and permits coactivation and amplification of other compounds that converge on the SIRT1/AMPK axis.Citation10,Citation12 This results in significant synergy of leucine with polyphenols and with metformin, resulting in significant increases in efficacy.Citation10,Citation12–Citation15
Nitric oxide (NO) levels are also responsive to energy status and are upregulated during caloric restriction; elevated NO, in turn, stimulates SIRT1 activity.Citation16,Citation17 SIRT1, in turn, may reciprocally elevate NO levels via deacetylation (Lys 496; Lys 506) of endothelial nitric oxide synthase (eNOS)Citation18,Citation19; AMPK plays a similar role via phosphorylation of eNOS (Ser 1177),Citation20,Citation21 resulting in a cross-talk energy-sensing network of SIRT1, AMPK, and NO.
The classically established mode of NO action is via stimulation of soluble NO-sensitive guanylyl cyclase to elevate cGMP and initiate subsequent physiological changes, primarily via cGMP-dependent protein kinases (PKGs).Citation22 Since termination of cGMP signaling is dependent upon phosphodiesterase (PDE)-mediated hydrolysis, comparable effects are obtained via inhibition of the cGMP-specific PDE5 with specific inhibitors, such as sildenafil and icariin.Citation22,Citation23 However, these PDE5-inhibitors also activate eNOSCitation24,Citation25 and may thereby increase SIRT1 activity and improve lipid metabolism and insulin signaling.Citation26–Citation28 Accordingly, our objective was to determine whether leucine could synergize with PDE5-inhibitors to increase insulin sensitivity and lipid metabolism. We tested this synergy with sildenafil as a pharmaceutical PDE5 inhibitor and icariin as a naturally occurring compound with PDE5 inhibitory activity. Since the in vitro results of both were similar, we conducted the animal study only with icariin.
Materials and methods
Animals and diets
Six-to-eight-week-old male C57/BL6 mice were purchased from Jackson Laboratories. Obesity and insulin resistance were induced via a high-fat diet (HFD) for 6 weeks. The animals were then randomized into one of the following groups with ten animals per group and kept on their diet for 6 weeks: 1) control (low-fat diet, standard diet [LabDiet 5001]); 2) HFD (60% fat; Research Diets, Inc., New Brunswick, NJ, USA), 3) HFD + leucine (24 g/kg diet; Sigma-Aldrich Co, St Louis, MO, USA), 4) HFD + leucine + icariin (25 mg/kg diet; Sigma-Aldrich Co). The leucine dose was designed to add a two-fold increase in leucine intake, as previously described.Citation12,Citation13 The icariin dose was selected to ensure a subtherapeutic dose that would exert no independent effect. A survey of the icariin literature indicated typical doses in the 50–200 mg/kg body weight range, with no significant effect on any variable studied at doses below 10–20 mg/kg body weight. For a 30 g mouse consuming ~3 g chow/day, this is equivalent to 100 mg icariin/kg diet. We reduced this to 25 mg/kg diet (approximately equivalent to 2.5 mg/kg body weight) to ensure no independent effect.
Animals were housed in polypropylene cages at a room temperature of 22°C with a 12-hour light/dark cycle. The animals had free access to water and their experimental food throughout the experiment. Body weight was measured every week. Blood glucose was measured in the fed or fasting state using a OneTouch Ultra Glucose Meter (LifeScan, Milpitas, CA, USA). At the end of the treatment period (6 weeks), all animals were humanely euthanized with CO2 inhalation. Blood and tissues were collected for further experiments as described below.
This study and all animal procedures were performed under the auspices of an Institutional Animal Care and Use Committee-approved protocol of the Georgia State University and in accordance with Public Health Service policy and recommendations of the Guide.
Glucose tolerance test
Mice were in a fasting state overnight (~16 hours) prior to glucose tolerance test. Basal (time 0) blood glucose was measured, the mice were then injected intraperitoneally with 1.2 g glucose/kg body weight, blood glucose was then measured 15 minutes, 30 minutes, 60 minutes, 90 minutes, and 120 minutes post-injection, and the area under the glucose response curve was calculated.
Insulin tolerance test
Food was removed for 4–6 hours prior to initiation of insulin tolerance test (ITT). Blood glucose was then measured to obtain a time 0 point, and the mice were then injected intraperitoneally with 1.0 U insulin/kg body weight in ~0.1 mL 0.9% NaCl. Blood glucose was then measured 15 minutes, 30 minutes, 60 minutes, 90 minutes, and 120 minutes post-injection, and the change in blood glucose over the linear portion of the response curve was calculated.
Liver histology
Liver tissues were fixed in 10% neutral formalin, embedded in paraffin, and cut into 5 μm sections. Sections were processed for hematoxylin and eosin staining, and histological images were recorded using Nikon Eclipse E800 Microscopy with Zeiss AxioCam camera.
Gene expression
Total RNA from liver and gastrocnemius muscle was extracted using the Tri-Reagent kit (Molecular Research Center, Cincinnati, OH, USA), and gene expression was assessed by quantitative reverse transcription-polymerase chain reaction (PCR) (ABI Universal PCR Master Mix; Thermo Fisher Scientific, Waltham, MA, USA) using a Stratagene Mx3000P thermocycler (Stratagene, La Jolla, CA, USA). The gene expression data were normalized to the house keeping gene 18s. The primer and probe sets used in the assays were purchased from Thermo Fisher Scientific (Waltham, MA, USA) and are further described in .
Table 1 RT-PCR probes ID and sequences
Plasma biochemistry
Blood was collected via tail vein, and plasma glucose and insulin were measured at the indicated time points using the glucose assay kit from Cayman Chemical (Ann Arbor, MI, USA) and an insulin enzyme linked immunosorbent assay kit from EMD Millipore (Billerica, MA, USA). Plasma C-reactive protein (CRP) levels were measured in fed mice using a mouse CRP enzyme linked immunosorbent assay kit (Life Diagnostics, West Chester, PA, USA).
Cell culture
Murine 3T3-L1 pre-adipocytes were grown in the absence of insulin in Dulbecco’s Modified Eagle’s Medium (DMEM, 25 mM glucose) containing 10% fetal bovine serum (FBS) and antibiotics (1% penicillin-streptomycin) (adipocyte medium) at 37°C in 5% CO2 in air. Confluent preadipocytes were induced to differentiate with a standard differentiation medium (DM2-L1; Zen-Bio Inc., Research Triangle Park, NC, USA). Preadipocytes were maintained in this differentiation medium for 3 days and subsequently cultured in adipocyte medium for a further 8–10 days to allow at least 90% of cells to reach full differentiation before treatment. Media was changed every 2–3 days; differentiation was determined microscopically via inclusion of fat droplets.
C2C12 myoblasts were plated at a density of 8,000 cells/cm2 (10 cm2 dish) and grown in DMEM containing 10% FBS and antibiotics at 37°C in 5% CO2. For differentiation of C2C12 cells, cells were grown to 100% confluence, transferred to differentiation medium (DMEM with 2% horse serum and 1% penicillin-streptomycin), and fed with fresh differentiation medium every day until myotubes were fully formed (3 days).
Human HepG2 cells (American Type Culture Collection HB-8065) were grown and maintained in DMEM, containing 5.5 mM glucose, 10% FBS, and antibiotics (1% penicillin-streptomycin) at 37°C in 5% CO2 in air. Medium was changed every 2–3 days, and cells were subcultured at a ratio of 1:4–1:6 upon reaching 80% confluence. Lipid accumulation was induced by incubation in 25 mM glucose for 48 hours prior to treatment.
All cells were obtained from American Type Culture Collection (ATCC, Manassas, VA, USA). Sildenafil, icariin, and leucine were obtained from Sigma-Aldrich Co.
Fatty acid oxidation
Palmitate-stimulated oxygen consumption rate was measured with an XF 24 analyzer (Seahorse Bioscience, Billerica, MA, USA) as previously describedCitation10,Citation13 with slight modifications. Cells were seeded at 40,000 cells per well and differentiated as described above. Media was then changed, and the cells treated for 24 hours with the indicated treatments, washed twice with non-buffered carbonate-free pH 7.4 low glucose (2.5 mM) DMEM containing carnitine (0.5 mM), equilibrated with 550 μL of the same media in a non-CO2 incubator for 45 minutes, and then inserted into the instrument for 15 minutes of further equilibration, followed by O2 consumption measurement. Three successive baseline measures at 5-minute intervals were taken prior to injection of palmitate (200 μM final concentration). Four successive 5-minute measurements of O2 consumption were then conducted, followed by 10-minute re-equilibration and another three 5-minute measurements. This measurement pattern was then repeated over a 6-hour period.
Glucose utilization
In the absence of a fatty acid source and oxidative metabolism, glycolysis and subsequent lactate production results in extracellular acidification, which was also measured using a Seahorse Bioscience XF24 analyzer. Cells were prepared and equilibrated similar to the methods described above for fatty acid oxidation, with the exclusion of carnitine from the medium. Following instrument equilibration and three baseline measurements, glucose was injected to a final concentration of 10 mM in each well. Measurements were taken as described above utilizing the sensors for extracellular acidification rather than O2 consumption. Insulin (final concentration of 5 nM) was added to some wells as a positive control and to some treatment and control wells to assess treatment effects on insulin response. The area under the curve of extracellular acidification change from baseline for each sample was then calculated and used for subsequent analysis.
NO production
NO production was detected using diaminofluorescein-2 diacetate (DAF-2DA), as cell-permeable dye, which is hydrolyzed by intracellular esterases and thereby trapped within the cell as a non-fluorescent dye (DAF-2). NO converts DAF-2 to a fluorescent triazole derivative, and fluorescence (excitation at 488 nm and emission at 515 nm) is proportional to NO production. DAF-2DA was obtained from Cell Technology, Inc. (Mountain View, CA, USA), and fluorescence was measured using a microplate reader (Synergy HT; BioTek Instruments, Winooski, VT, USA). The intensity of fluorescence was expressed as arbitrary units per microgram protein.
Mitochondrial biogenesis
Mitochondrial biogenesis was assessed as change in mitochondrial mass, as previously described.Citation12 The mitochondrial probe 10-N-nonyl-acridine orange (NAO) (Thermo Fisher Scientific, Waltham, MA, USA) was used to analyze mitochondrial mass by fluorescence (excitation 485 nm and emission 520 nm). Quantitative data were obtained with a fluorescence microplate reader (Synergy HT). The intensity of fluorescence was expressed as arbitrary units per microgram protein and normalized to control values within each assay.
Western blot
Phospho-IRS, IRS, Phospho-Akt, and Akt antibodies were obtained from Cell Signaling (Danvers, MA, USA). Protein levels of cell extracts were measured by bicinchoninic acid protein kit (Thermo Fisher Scientific). For Western blot, 15 μg protein was resolved on 10% gradient polyacrylamide gels (Criterion precast gel; Bio-Rad Laboratories Inc., Hercules, CA, USA), transferred to either polyvinylidene fluoride membranes, incubated in blocking buffer (5% non-fat dry milk in TBS) and then incubated with primary antibody (1:1,000 dilution), washed, and incubated with horseradish peroxidase- or fluorescence-conjugated secondary antibody (1:10,000 dilution). Visualization was conducted using Bio-Rad ChemiDoc instrumentation and software (Bio-Rad Laboratories) and/or band intensity was assessed using Image Lab 4.0 (Bio-Rad Laboratories), with correction for background and loading controls.
Statistical analysis
All data are expressed as mean ± standard error of the mean, with the exception of Seahorse fatty acid oxidation, which is shown as mean ± standard deviation. Data were analyzed by one-way analysis of variance, and significantly different group means (P<0.05) were separated by the least significant difference test using GraphPad Prism version 6 (GraphPad Software, Inc., La Jolla, CA, USA; http://www.graphpad.com).
Results
In vitro
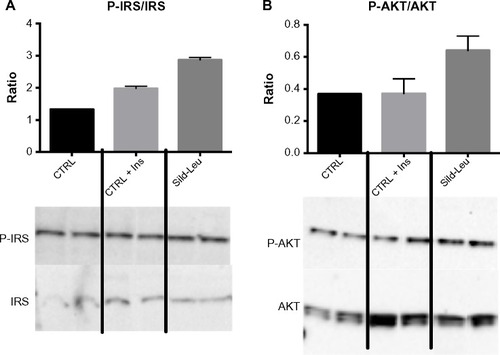
We initially assessed potential synergy between leucine and PDE5-inhibitors in cell culture. Sildenafil dose–response curves showed no effects on fat oxidation or glucose utilization at concentrations below 10 nM; this is approximately 10% of the peak plasma concentration (~100 nM) achieved in response to a low dose (20 mg) of the drug in clinical application. To evaluate synergy, this dose was lowered further to 0.1 nM and 1.0 nM. Icariin dose–response curves were similar to sildenafil, so the same concentrations were utilized. While neither PDE5 inhibitor exerted an independent effect on fat oxidation, both interacted with leucine (0.5 mM) to significantly increase fat oxidation in C2C12 myotubes, 3T3-L1 adipocytes, and HepG2 hepatocytes by ~20%–30% (). Both PDE5-inhibitors also interacted with leucine to produce modest but significant increases in NO production (15%–30%, P<0.0001, ) and mitochondrial mass (P<0.03, ). Sildenafil also exhibited synergy with leucine in stimulating glucose utilization in myotubes (~50%, P<0.04) and adipocytes (~300%, P<0.05) () and in stimulating insulin signaling in HepG2 hepatocytes ().
Figure 1 PDE5-inhibitors combined with Leu increases fatty acid oxidation in vitro.
Abbreviations: PDE5, phosphodiesterase 5; Leu, leucine; OCR, oxygen consumption rate; AUC, area under the curve; Sild, sildenafil; Icar, icariin; SD, standard deviation.
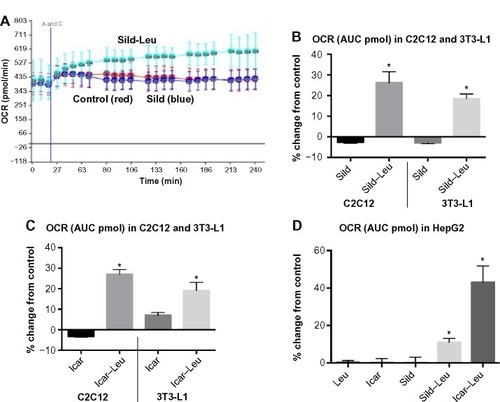
Figure 2 PDE5-inhibitors combined with Leu increases NO production and mitochondrial biogenesis in vitro.
Abbreviations: AFU, arbitrary fluorescence units; DAF-2DA, diaminofluorescein-2 diacetate; PDE5, phosphodiesterase 5; Leu, leucine; NAO, 10-N-nonyl-acridine orange; NO, nitric oxide; ns, not significant; Sild, sildenafil; Icar, icariin; SEM, standard error of the mean.
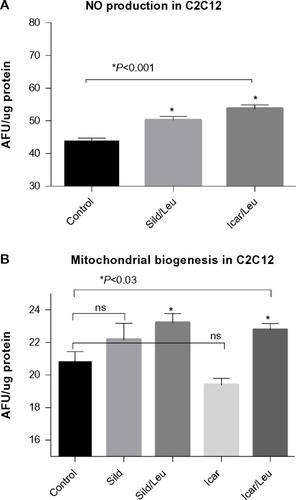
Figure 3 PDE5-inhibitors combined with Leu increases glucose utilization in vitro.
Abbreviations: PDE5, phosphodiesterase 5; ECAR, extracellular acidification rate; AUC, area under the curve; Sild, sildenafil; Leu, leucine; SD, standard deviation.
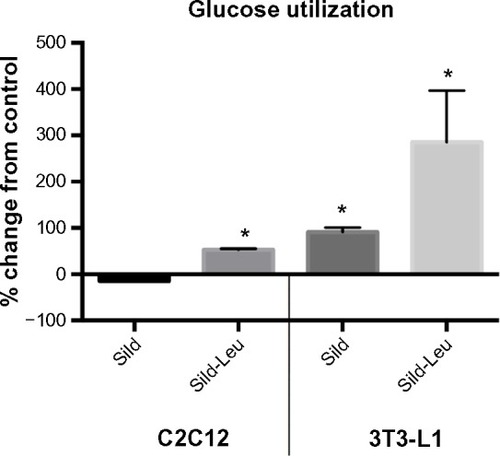
Figure 4 PDE5-inhibitors combined with Leu increases insulin signaling in vitro.
Abbreviations: Ins, insulin; PDE5, phosphodiesterase 5; CTRL, control; Sild, sildenafil; Leu, leucine; SEM, standard error of the mean; P-IRS, phosphorylated insulin receptor substrate; P-AKT, phosphorylated protein kinase B.
In vivo
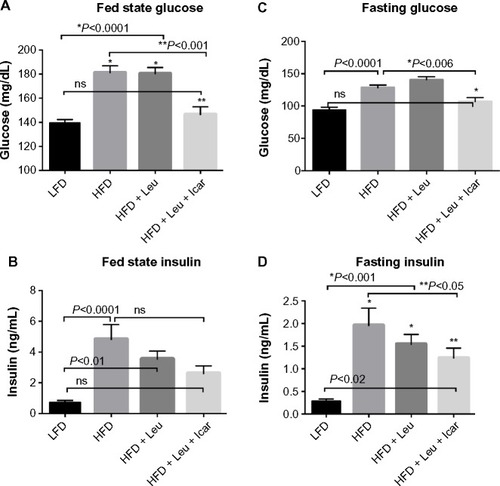
Six weeks of obesity-induction via HFD caused significant weight gain compared to the low-fat diet group; however, there was no effect of the treatments on body weight during the 6-week treatment period (). The HFD also produced significant fasting and postprandial hyperglycemia () and hyperinsulinemia (). Addition of leucine exerted no effect on fasting or fed state glucose or on fasting insulin, although it did reduce insulin in the fasting state (). However, the HFD-induced hyperglycemia was significantly attenuated by the addition of leucine + icariin in both the fasting and fed states (), and the fasting insulinemia was also markedly reduced ().
Figure 5 Body weight measurements of the DIO-mice.
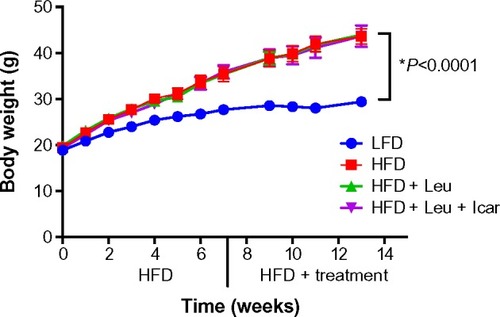
Figure 6 Leu and Icar combination lowers plasma glucose and insulin levels in DIO-mice.
Abbreviations: DIO, diet-induced obese; HFD, high-fat diet; LFD, low-fat diet; Leu, leucine; Icar, icariin; ns, not significant; SEM, standard error of the mean.
Notes: 6-to-8-week-old mice were fed an LFD (control) or HFD for 6 weeks to induce obesity and insulin resistance (DIO-mice). After 6 weeks, the HFD mice were randomized into treatment groups for a further 6 weeks. Body weight was measured weekly. Data are presented as mean ± SEM (n=10).
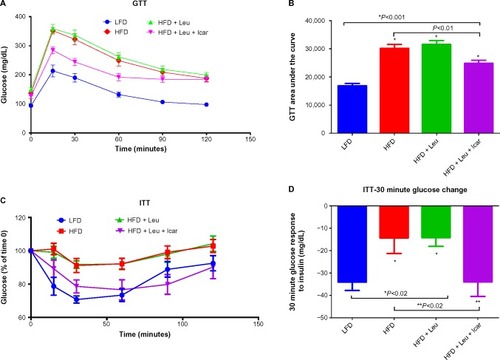
The HFD caused a profound impairment in glucose tolerance, which was unaffected by the addition of leucine alone but markedly improved by the leucine–icariin combination (). This is reflected in a significant and substantial reduction in the area under the glucose tolerance curve (P<0.01, ). The ITT demonstrates a profound blunting of the insulin response in animals on the HFD (). Addition of leucine alone exerted no effect on insulin tolerance, while the combination of leucine and icariin normalized the insulin response, as reflected in the ITT curve () and in the 30-minute change in blood glucose ().
Figure 7 Leu and Icar combination improves insulin sensitivity in DIO-mice.
Abbreviations: DIO, diet-induced obese; GTT, glucose tolerance test; ITT, insulin tolerance test; LFD, low-fat diet; HFD, high-fat diet; Leu, leucine; Icar, icariin; AUC, area under the curve; SEM, standard error of the mean.
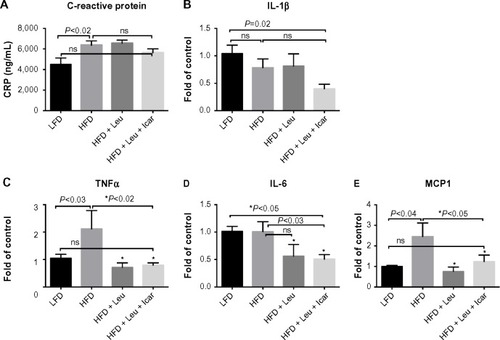
The leucine–icariin combination resulted in upregulation of fatty acid oxidation genes in skeletal muscle () and liver () and suppression of hepatic lipogenic gene expression (). Moreover, the leucine–icariin combination significantly attenuated the HFD-induced increase in liver mass () and completely prevented the HFD-induced hepatic lipid accumulation, as shown in the liver histology (). The leucine–icariin combination also suppressed hepatic inflammation, as shown by the reduction in hepatic inflammatory genes expression ().
Figure 8 Leu and Icar combination promotes muscle fatty acid oxidation in DIO-mice.
Abbreviations: Leu, leucine; Icar, icariin; DIO, diet-induced obese; HFD, high-fat diet; LFD, low-fat diet; PPARα, peroxisome proliferator-activated receptor alpha; COX1, cyclooxygenase 1; ACOX1, acyl-CoA oxidase; CPT1B, carnitine palmitoyltransferase 1B; SEM, standard error of the mean; ns, not significant.
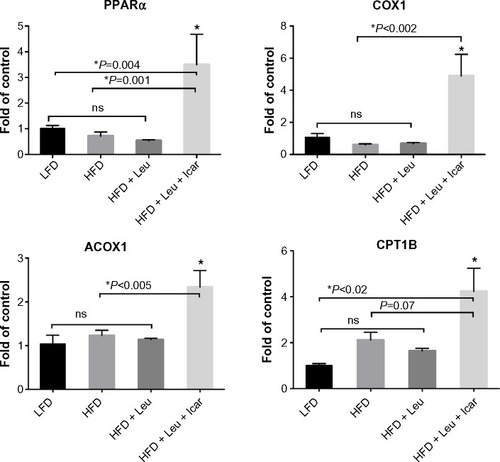
Figure 9 Leu and Icar combination inhibits hepatic lipogenesis and promotes hepatic fatty acid oxidation in DIO-mice.
Abbreviations: Leu, leucine; Icar, icariin; DIO, diet-induced obese; HFD, high-fat diet; CRP, C-reactive protein; IL-1β, inflammatory markers interleukin-1 beta; TNFα, tumor necrosis factor alpha; IL-6, interleukin 6; MCP1, monocyte chemotactic protein 1; LFD, low-fat diet; SEM, standard error of the mean; ns, not significant.
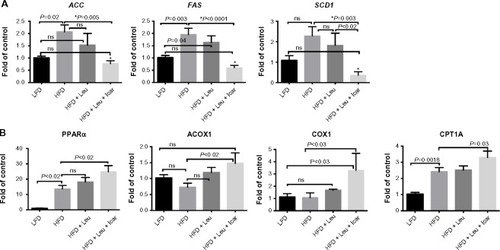
Figure 10 Leu and Icar combination prevents hepatic steatosis in DIO-mice.
Abbreviations: Leu, leucine; Icar, icariin; DIO, diet-induced obese; ACC, acetyl CoA carboxylase; FAS, fatty acid synthase; SCD1, stearoyl-CoA desaturase-1; PPARα, peroxisome proliferator-activated receptor alpha; ACOX1, acyl-CoA oxidase; COX1, cyclooxygenase 1; CPT1A, carnitine palmitoyltransferase 1A; HFD, high-fat diet; LFD, low-fat diet; SEM, standard error of the mean; ns, not significant.
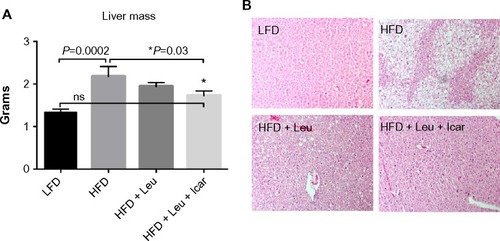
Figure 11 Leu and Icar combination suppresses inflammation in liver of DIO-mice.
Abbreviations: Leu, leucine; Icar, icariin; DIO, diet-induced obese; HFD, high-fat diet; LFD, low-fat diet; SEM, standard error of the mean; ns, not significant.
Discussion
These data indicate that the combination of leucine with PDE5 inhibition shifts lipid metabolism from storage to oxidation, improves glycemic control, and reverses the hepatic steatosis induced by high-fat feeding. These effects are similar to those induced by caloric restrictionCitation29–Citation34 and are likely to be mediated by the same pathways, including SIRT1 activation.
Obesity and insulin resistance result in impaired NO signaling,Citation35,Citation36 while PDE5-inhibitors, including sildenafil and tadalafil, have been demonstrated to increase SIRT1 signaling in mice,Citation26,Citation27 to increase energy expenditure in skeletal muscle cells,Citation37 to improve energy balance, and to increase insulin action in both diet-induced obese (DIO), insulin-resistant mice and diabetic patients.Citation28,Citation38 This may be, in part, due to stimulation of eNOS and NO signalingCitation24,Citation25 and subsequent NO-mediated SIRT1 activation.Citation26–Citation28
Since leucine activation of SIRT1 results in significant augmentation of the effects of other compounds that converge on this signaling pathway,Citation10–Citation13 we considered the potential for leucine to amplify the effects of PDE5-inhibitors. We found leucine to exhibit synergy with subtherapeutic levels of both sildenafil and icariin in stimulating fat oxidation in skeletal muscle cells, adipocytes, and hepatocytes, as well as in stimulating glucose utilization. Moreover, leucine–sildenafil and leucine–icariin combinations increased NO production, possibly due to a combination of direct activation of eNOS by the PDE5-inhibitors and indirect eNOS activation by both SIRT1 and AMPK. This suggests a three-way interaction among SIRT1, AMPK, and NO in mediating the observed effects, as illustrated in . Leucine activation of SIRT1 results in downstream activation of AMPK,Citation11 while AMPK in turn activates SIRT1 via phosphorylation of NAMPT to regenerate the SIRT1 activator NAD+.Citation39 Both AMPK and SIRT1, in turn, activate eNOS via phosphorylationCitation20,Citation21 and deacetylation,Citation18,Citation19 respectively. The increased NO, in turn, may stimulate SIRT1 activity,Citation16,Citation17 resulting in a three-component feed-forward loop.
Figure 12 Summary of the three-way interaction among AMPK, SIRT1, and eNOS.
Abbreviations: eNOS, endothelial nitric oxide synthase; AMPK, AMP-activated protein kinase; NO, nitric oxide; PKG, cGMP-activated protein kinase; HFD, high-fat diet; PDE5, phosphodiesterase 5 inhibition; PGC1α, peroxisome proliferator-activated receptor γ co-activator α; PPARα, peroxisome proliferator-activated receptor alpha; SCD1, stearoyl-CoA desaturase-1; ACC, acetyl CoA carboxylase; FAS, fatty acid synthase; TNFα, tumor necrosis factor alpha; NFκβ, nuclear factor-kappaB; MCP1, monocyte chemotactic protein 1; IL-1β, interleukin-1 beta; IL-6, interleukin 6; FA, fatty acid.
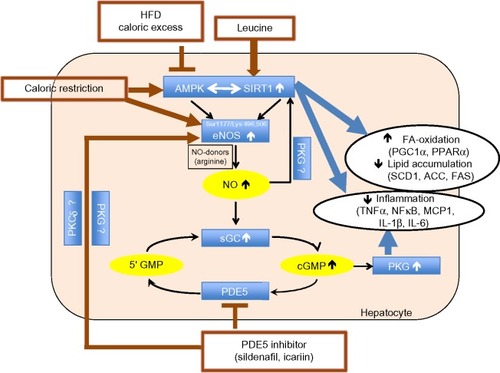
Data from the mice in the present study are consistent with such a multi-component activation. The leucine–icariin combination resulted in significant improvements in glycemic control and insulin sensitivity, upregulated fatty acid oxidation, and downregulated lipogenic markers, consistent with SIRT1–AMPK activation, while the attenuation of hepatic lipid accumulation and inflammatory markers may be mediated, in part, by both SIRT1 and NO. Reductions in SIRT1 activity increases steatosis in response to dietary fat in SIRT1+/− mice,Citation40 while SIRT1 activation in DIO-mice results in amelioration of hepatic steatosis.Citation15,Citation41,Citation42 On the other hand, diet-induced obesity and insulin resistance suppress hepatic eNOS activity prior to the induction of hepatic inflammation, while increasing NO signaling with sildenafil restored hepatic insulin signaling and prevented dietary fat-induced nuclear factor-kappaB (NFκB)-mediated hepatic inflammation.Citation43 The combination of leucine and icariin in the present study resulted in reversal of histological evidence of dietary fat-induced hepatic steatosis and normalization of dietary fat-induced hepatic TNFα, interleukin 6 (IL-6), and MCP1 expression and circulating CRP, as well as ~50% reduction in interleukin-1 beta (IL-1β) expression. Thus, our data are consistent with a combination of SIRT1 and NO signaling, with cross-talk between the two pathways. However, a portion of these effects are likely also mediated via the classically established mode of PDE5 inhibitor action, mediated by extending the duration of cGMP signaling as well as NO stimulation of cGMP production via NO-sensitive guanylyl cyclase (), resulting in enhanced cGMP-dependent PKG signaling.Citation22 This further contributes to improvements in insulin sensitivityCitation28,Citation44 as well as reductions in hepatic steatosis and NFκB-mediated inflammation.Citation36,Citation43,Citation44
Chronic treatment with the PDE5 inhibitor sildenafil has been reported to reduce weight gain in HFD-fed mice.Citation28 In contrast, we found no effects of our treatments on body weight (). However, we used a much lower dose of PDE inhibitor (~2.5 mg/kg body weight in our study vs 12 mg/kg BW) and a shorter treatment time (6 weeks in our study vs 12 weeks). Moreover, Ayala et al,Citation28 used a prevention approach by starting the sildenafil treatment concomitantly with beginning of HFD feeding, while in our study, the treatment was added to the HFD after obesity-induction.
In summary, subtherapeutic doses of PDE5-inhibitors combined with leucine result in activation of fatty acid oxidation, marked improvement in insulin sensitivity, and reversal of hepatic steatosis and inflammation in DIO-mice. We conclude that this combination may have therapeutic potential for treatment of both non-alcoholic steatohepatitis and type 2 diabetes.
Author contributions
All authors contributed toward data analysis, drafting and revising the paper and agree to be accountable for all aspects of the work.
Acknowledgments
This work was supported by NuSirt Biopharma Inc.
Disclosure
The authors Antje Bruckbauer and Michael B Zemel are employees and stockholders of NuSirt Biopharma, Inc. All other authors declare that they have no conflicts of interest.
References
- CantóCAuwerxJPGC-1alpha, SIRT1 and AMPK, an energy sensing network that controls energy expenditureCurr Opin Lipidol200920298 10519276888
- GomesAPPriceNLLingAJDeclining NAD(+) induces a pseudohypoxic state disrupting nuclear-mitochondrial communication during agingCell201315571624 163824360282
- PriceNLGomesAPLingAJSIRT1 is required for AMPK activation and the beneficial effects of resveratrol on mitochondrial functionCell Metab201215675 69022560220
- GowansGJHawleySARossFAHardieDGAMP is a true physiological regulator of AMP-activated protein kinase by both allosteric activation and enhancing net phosphorylationCell Metab2013184556 56624093679
- JägerSHandschinCSt-PierreJSpiegelmanBMAMP-activated protein kinase (AMPK) action in skeletal muscle via direct phosphorylation of PGC-1alphaProc Natl Acad Sci U S A20071042912017 1202217609368
- BrenmoehlJHoeADual control of mitochondrial biogenesis by sirtuin 1 and sirtuin 3Mitochondrion201313755 76123583953
- CoughlanKAValentineRJRudermanNBSahaAKAMPK activation: a therapeutic target for type 2 diabetes?Diabetes Metab Syndr Obes20147241 25325018645
- PflugerPTHerranzDVelasco-miguelSSerranoMTschoMHSirt1 protects against high-fat diet-induced metabolic damagePNAS2008105289793 979818599449
- MilneJCLambertPDSchenkSSmall molecule activators of SIRT1 as therapeutics for the treatment of type 2 diabetesNature20074507170712 71618046409
- BruckbauerAZemelMBSynergistic effects of polyphenols and methylxanthines with leucine on AMPK/Sirtuin-mediated metabolism in muscle cells and adipocytesPLoS One201492e8916624551237
- LiangCCurryBJBrownPLZemelMBLeucine modulates mitochondrial biogenesis and SIRT1-AMPK signaling in C2C12 myotubesJ Nutr Metab2014201423975025400942
- BruckbauerAZemelMBThorpeTSynergistic effects of leucine and resveratrol on insulin sensitivity and fat metabolism in adipocytes and miceNutr Metab (Lond)2012917722913271
- BruckbauerAZemelMBSynergistic effects of metformin, resveratrol, and hydroxymethylbutyrate on insulin sensitivityDiabetes Metab Syndr Obes2013693 10223430507
- XueBFuLLiFLeucine amplifies the effects of metformin on insulin sensitivity and glycemicDiabetes201463Suppl 1A288
- ShiHFuLLiFSynergy between metformin and leucine in sirtuin signaling and fat oxidation in vitro, and in reducing lipid accumulation in diet-induced obese miceDiabetes201463Suppl 1A463
- NisoliETonelloCCardileACalorie restriction promotes mitochondrial biogenesis by inducing the expression of eNOSScience20053105746314 31716224023
- ShinmuraKTamakiKBolliRImpact of 6-mo caloric restriction on myocardial ischemic tolerance: possible involvement of nitric oxide-dependent increase in nuclear Sirt1Am J Physiol Heart Circ Physiol20082956H2348 H235518931029
- MattagajasinghIKimCSNaqviASIRT1 promotes endothelium-dependent vascular relaxation by activating endothelial nitric oxide synthaseProc Natl Acad Sci U S A20071043714855 1486017785417
- SpallottaFCencioniCStrainoSA nitric oxide-dependent crosstalk between class I and III histone deacetylases accelerates skin repairJ Biol Chem20132881611004 1101223463510
- ChenZPMitchelhillKIMichellBJAMP-activated protein kinase phosphorylation of endothelial NO synthaseFEBS Lett1999443285 28910025949
- ZhangYLeeTSKolbEMAMP-activated protein kinase is involved in endothelial NO synthase activation in response to shear stressArterioscler Thromb Vasc Biol2006261281 128716601232
- FrancisSHBuschJLCorbinJDSibleyDcGMP-dependent protein kinases and cGMP phosphodiesterases in nitric oxide and cGMP actionPharmacol Rev2010623525 56320716671
- SchluesenerJKSchluesenerHPlant polyphenols in the treatment of age-associated diseases: revealing the pleiotropic effects of icariin by network analysisMol Nutr Food Res201458149 6024311544
- MusickiBBivalacquaTJChampionHCBurnettALSildenafil promotes eNOS activation and inhibits NADPH oxidase in the transgenic sickle cell mouse penisJ Sex Med2014112424 43024251665
- DasAXiLKukrejaRCPhosphodiesterase-5 inhibitor sildenafil preconditions adult cardiac myocytes against necrosis and apoptosis. Essential role of nitric oxide signalingJ Biol Chem20052801312944 1295515668244
- ShalwalaMZhuS-GDasASalloumFNXiLKukrejaRCSirtuin 1 (SIRT1) activation mediates sildenafil induced delayed cardioprotection against ischemia-reperfusion injury in micePLoS One201491e8697724466304
- KokaSAluriHSXiLLesnefskyEJKukrejaRCChronic inhibition of phosphodiesterase 5 with tadalafil attenuates mitochondrial dysfunction in type 2 diabetic hearts: potential role of NO/SIRT1/PGC-1α signalingAm J Physiol Heart Circ Physiol201430611H1558 H156824727492
- AyalaJBracyDJulienBChronic treatment with sildenafil improves energy balance and insulin action in high fat-fed conscious miceDiabetes20075641025 103317229936
- ColmanRJBeasleyTMKemnitzJWJohnsonSCWeindruchRAndersonRMCaloric restriction reduces age-related and all-cause mortality in rhesus monkeysNat Commun20145355724691430
- ColmanRJAndersonRMJohnsonSCCaloric restriction delays disease onset and mortality in rhesus monkeysScience20093255937201 20419590001
- JovéMNaudíARamírez-NúñezOCaloric restriction reveals a metabolomic and lipidomic signature in liver of male miceAging Cell2014131 1024433409
- MitchellSJMartin-MontalvoAMerckenEMThe SIRT1 activator SRT1720 extends lifespan and improves health of mice fed a standard dietCell Rep201465836 84324582957
- MerckenEMHuJKrzysik-WalkerSSIRT1 but not its increased expression is essential for lifespan extension in caloric-restricted miceAging Cell2014131193 19623941528
- ChangH-CGuarenteLSIRT1 and other sirtuins in metabolismTrends Endocrinol Metab2014253138 14524388149
- KimFPhamMMaloneyEVascular inflammation, insulin resistance, and reduced nitric oxide production precede the onset of peripheral insulin resistanceArterioscler Thromb Vasc Biol200828111982 198818772497
- HandaPTateyaSRizzoNOReduced vascular nitric oxide-cGMP signaling contributes to adipose tissue inflammation during high-fat feedingArterioscler Thromb Vasc Biol201131122827 283521903940
- SabatiniSSgròPDurantiGCeciRDi LuigiLTadalafil alters energy metabolism in C2C12 skeletal muscle cellsActa Biochim Pol2011582237 24121681286
- JanssonPAMurdoloGSjögrenLTadalafil increases muscle capillary recruitment and forearm glucose uptake in women with type 2 diabetesDiabetologica201053102205 2208
- ImaiSGuarenteLTen years of NAD-dependent SIR2 family deacetylases: implications for metabolic diseasesTrends Pharmacol Sci2010315212 22020226541
- XuFGaoZZhangJLack of SIRT1 (Mammalian Sirtuin 1) activity leads to liver steatosis in the SIRT1+/− mice: a role of lipid mobilization and inflammationEndocrinology201015162504 251420339025
- XuFLiZZhengXSirt1 mediates the effect of GLP-1 receptor agonist exenatide on ameliorating hepatic steatosisDiabetes201463113637 364624947350
- LeeJHongSWChaeSWExendin-4 improves steatohepatitis by increasing Sirt1 expression in high-fat diet-induced obese C57BL/6J micePLoS One201272e3139422363635
- TateyaSRizzoNOHandaPEndothelial NO/cGMP/VASP signaling attenuates Kupffer cell activation and hepatic insulin resistance induced by high-fat feedingDiabetes201160112792 280121911751
- RizzoNOMaloneyEPhamMReduced NO–cGMP signaling contributes to vascular inflammation and insulin resistance induced by high-fat feedingArterioscler Thromb Vasc Biol2010304758 76520093624