Abstract
We describe the changes in the prevalence of overweight and obesity in 4606 students that applied to a Mexican University during 1994 to 2008. The mean (± standard deviation [SD]) age was 17.7 ± 1.2 years-old. Progressive and significant increments of bodyweight (female [F] = 2.6, P = 0.03), body mass index (BMI) (F = 4.4, P = 0.001), and waist circumference (F = 30.08, P < 0.0001) in women, and bodyweight (male [M] = 8.9, P < 0.001), BMI (M = 10.4, P < 0.001), and waist circumference (M = 13.01, P < 0.001) in men were observed. A significant increment (P < 0.05) in the prevalence of overweight since 1994 (n = 87, 12.1%) throughout 1997 (n = 102, 14.1%), 1998 (n = 133, 18.4%), 1999 (n = 1993, 26.8%), and 2008 (n = 206, 19.9%) was documented. Similarly, the prevalence of obesity had a significant increment in all students evaluated (P < 0.0001) since 1994 (n = 29, 13.2%) through 1997 (n = 11, 5.0%), 1998 (n = 45, 20.5%), 1999 (n = 53, 24.1%), and 2008 (n = 82, 37.3%). The increment was significant in both women (P = 0.02) and men (P < 0.001). In summary, we report a significant increment in the prevalence of overweight and obesity in Mexican students living in an urban setting over a time period of 14 years.
Introduction
The prevalence of obesity is increasing rapidly worldwideCitation1 and this is especially true for Latin American countries. The prevalence of overweight and obesity in Mexico showed a progressive increase documented since 1988. National surveys undertaken in Mexico reported an increasing prevalence for overweight (16.4% to 40%) and obesity (18.7% to 30%) from 1988 to 2006.Citation2,Citation3 Thus, the prevalence in Mexico of overweight and obesity in 2006 was reported as 70% (about 77 million habitants affected).Citation3 Nowadays, the weight problems also affect adolescents, with 29% of youth aged 10 to 19 years classified as either overweight or obeseCitation6 and 24% of Mexican-American children classified as overweight.Citation4,Citation5 Although obesity is caused by many different factors (including genetics, changes in behavior, culture or environment) the continuous increase of its prevalence has been attributed to changes in dietary patterns and lifestyles.Citation6,Citation7 The adoption of diets with a high content of saturated fat and simple carbohydrates; reduced levels of physical activity, increased use of alcohol and tobacco together with increased psychosocial stress, are among the determinants of obesity and other chronic degenerative diseases, particularly in the rapidly growing cities of developing countries. Obesity increases the risk for heart disease and is associated with other chronic diseases including: hyperlipidemia; hyperinsulinemia; hypertension; and early atherosclerosis.Citation8–Citation11 Even in childhood, obesity is associated with a variety of adverse health consequences that can include: type 2 diabetes;Citation12 hypertension and dyslipidemia;Citation12 asthma and sleep apnea;Citation13 early maturation (that has been associated with overweight that may persist after the completion of biological growth and development); Citation14,Citation15 lower self-esteem;Citation16 and psychosocial stress.Citation16 In addition, adolescents with impaired fasting glucose have an increased number of cardiovascular risk factors, including overweight and abdominal obesity.Citation17,Citation18
The information given by studies in socially homogeneous populations are useful to assess the changes occurring in the prevalence of overweight and obesity influenced by the modifications of economic and cultural factors. However, the current information related with weight problems in Mexican adolescents is limited.Citation4,Citation5 Therefore, we aimed to evaluate the clinical and biochemical impact of changes in the prevalence of overweight and obesity between 1994 and 2008 in a well-defined urban sample of students.
Methods and procedures
This is a series of cross-sectional studies undertaken in 1994, 1997, 1998 and 2008, and which included 4606 students of the Universidad Popular Autonoma of Puebla in Mexico. Every student was evaluated at the time of admission to the University. The medical history was recorded using a standardized questionnaire with the student’s bodyweight, height, body mass index (BMI), waist circumference and fasting glucose were determined. Assessments were made over the years in which all students could be evaluated, the research team was available and the medical personnel were standardized for the measurement of bodyweight, height, and waist circumference. Throughout study duration there was no additional nutrition or fitness intervention for the students. In addition, students were of similar medium-high socioeconomic status and the admission criteria did not change throughout study duration. The study was approved by the college, and informed consent was obtained from all subjects.
Clinical evaluation
Students were cited in the morning, one day of the week, after an 8- to 12-hours fast. Participants removed their shoes and upper garments before bodyweight was measured, on a calibrated floor scale, with a maximum measuring capacity of 140-kg (1631 solar scale, Tanita Corp, Tokyo, Japan). The same equipment was used throughout the study. In addition, the same specialized medical personnel that were trained before of each year of the evaluation and using the same technique they undertook the measurements. Bodyweight was measured and recorded to the nearest 0.1 kg. All subjects were instructed to stand in the center of the scale during weight assessment. Height was obtained using the floor scale’s stadiometer, again with the student standing on the central part of the scale. Height was measured to the nearest 0.5 cm. BMI was calculated as bodyweight (kg) divided by height (m). Overweight and obesity were defined as a BMI ≥25 and ≥30 kg/m, respectively, for a population that were >18 years old. For younger students (<18 years old) we used the Centers for Disease Control and Prevention (CDC) BMI-for-age weight status categories. Overweight was defined being between the 85th to less than the 95th percentile, and obesity when the result were equal to or greater than 95th percentile.Citation19 Abdominal circumference was measured to the nearest 0.1 cm at the level of the greatest frontal extension of the abdomen between the bottom of the rib cage and the top of the iliac crest.Citation20 All measurements were done by specialized medical personnel that were standardized every year before the evaluation.
Biochemical evaluation
All analytic measurements were carried out in the central laboratory of the University Hospital. Glucose was measured using the glucose-oxidase method (Boehringer Mannheim, Mannheim, Germany) with a 5 ml. sample obtained from antecubital vein. All samples were analyzed the same day. The equipment was regularly calibrated using reference samples provided by the manufacturer. Impaired fasting glucose was defined as ≥110 mg/dL.Citation21
Statistical analysis
Normally distributed data, determined using Kolmogorov-Smirnov test, were expressed as means and standard deviation (±SD). Categorical variables were represented by frequency and percentage. Prevalence was calculated with number of existing cases on a specific date/number of people in the population on this date. Linear by linear association chi-square was used for testing if the prevalence of overweight and obesity had a significant change throughout years. One-way ANOVA were used for comparison between means of bodyweight, BMI and waist circumference throughout 1994 to 2008. Post-hoc analyses using Games-Howell test (since variances were not equal) was used to evaluate differences between years. Homogeneity of variance was evaluated with Levene’s test. All reported P values are based on two-sided tests considering ≤0.05 as significant. All analyses were performed with SPSS 15.0 (Chicago, IL).
Results
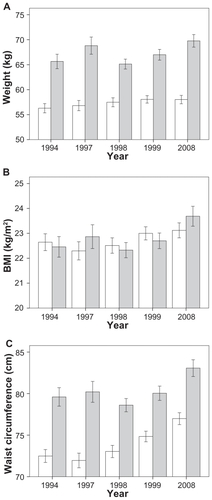
The clinical and biochemical characteristics of the participants (1991 male and 2615 female) are presented in . The students aged 15–20 years, and remained without significant variation in every year in both women (17.8 ± 1.2 years), and men (17.7 ± 1.4 years). Progressive and significant increments of bodyweight (3.6 kg P = 0.005), BMI (10.4 P < 0.001), and waist circumference (27.3 cm P < 0.001) were seen in the whole study population (). Post-hoc analysis showed a significant increment in bodyweight between 1994 and 1999 (P = 0.04), and 1994 and 2008 (P = 0.002). In the same way, progressive increments in BMI and waist circumference were seen during every year (P < 0.001).
Table 1 Clinical and biochemical characteristics of the 4606 Mexican students recruited in this study
Table 2 Weight, BMI, and waist circumference values in the population studied (n = 4606) between 1994 and 2008
Results related to bodyweight, BMI, and waist circumference in women
Analyses grouped by gender showed a significant increment of BMI (F = 4.4, P = 0.001), bodyweight (F = 2.6 P = 0.03) and waist circumference (F = 30.08 P < 0.0001) in women (). A significant change was observed when the mean bodyweight in 1994 was compared with the results obtained in 1999 (P = 0.03) and 2008 (P = 0.05). Similar results were seen for the BMI in 1997 (P = 0.006), 1998 (P = 0.04) and 1999 (P = 0.01) as compared to 2008. The most significant results in women were seen with the change in waist circumference throughout 1994 to 2008 (all P < 0.0001, ).
Figure 1 Mean weight A, BMI B and waist circumference C of the men (gray) and women (white) studied between 1994 and 2008.
Error bars represent CI 95%. Women: weight 1994 vs 1999 (P = 0.03) and 2008 (P = 0.05); BMI 1997 (P = 0.006), 1998 (P = 0.04) and 1999 (P = 0.01) vs 2008; and waist circumference 1994 throughout 2008 all P < 0.0001. Men: weight 1994 (P < 0.001), 1998 (P < 0.001) and 1999 (P = 0.009) vs 2008; BMI and waist circumference 1994 throughout 2008 (all P < 0.001) (except weight 1997 vs 2008, P = 0.07).
Results related to bodyweight, BMI, and waist circumference in men
The change in mean bodyweight (F = 8.9 P < 0.001), BMI (F = 10.4, P < 0.001) and waist circumference (F = 13.01 P < 0.001) was also significant in males. Individual post-hoc comparisons showed a significant increment in bodyweight from 1994 (P < 0.001), 1998 (P < 0.001) and 1999 (P = 0.009) compared with 2008 (). However, the change in mean bodyweight from 1997 to 2008 was not significant (P = 0.9). The BMI also had a significant increment in males in every year from 1994 (all P < 0.001) except in 1997 compared with 2008 (P = 0.07), where only a trend was identified (). Similarly, the waist circumference showed a significant increment in males from 1994 through 2008 (all P < 0.001, ).
Results related to the prevalence of overweight and obesity
We observed a significant increment in the prevalence of overweight and obesity from 1994 to 2008. Linear by linear association in the whole study population showed a significant increment (P = 0.05) in the prevalence of overweight since 1994 (n = 108, 12.1%) throughout 1997 (n = 111, 13.6%), 1998 (n = 153, 18.7%), 1999 (n = 227, 27.8%), and 2008 (n = 218, 26.8%). The increment in the prevalence of overweight were not significant in women; however, results showed a trend (P = 0.07). A progressive and significant (P = 0.001) increment in the frequency of overweight was seen in men ().
Figure 2 Prevalence of overweight and obesity in men (gray) and women (white) between 1994 and 2008.
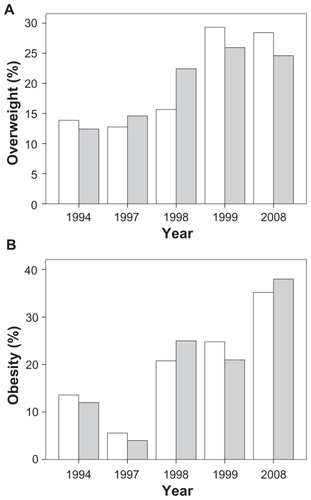
Similarly, the prevalence of obesity had a significant increment in all students evaluated (P < 0.0001) since 1994 (n = 29, 13.2%) through 1997 (n = 11, 5.0%), 1998 (n = 45, 20.5%), 1999 (n = 53, 24.1%), and 2008 (n = 82, 37.3%). The increment was significant in both women (P = 0.02) and men (P < 0.001, ).
The mean glucose concentration did not show a significant change in the whole study population (P = 0.90) and neither in men (P = 0.99) nor in women (P = 0.88). The prevalence of abnormal fasting glucose (n = 525, 11.4%) and diabetes mellitus (n = 9, 0.2%) remained stable throughout years.
Discussion
The study describes the changes in the prevalence of overweight and obesity in a large representative sample of students from an urban region of Mexico. Every year, this University admits approximately 400 to 700 students. In our sample, 50% of the participants were born in Puebla and the remaining students in other states of the country. However, 95.2% of the students lived permanently in Puebla during the study period. Therefore, the majority of the students were exposed to similar environmental factors and experienced comparable modifications in physical activities, nutrition and education during this time period. By comparing the anthropometric and biochemical measurements carried out at the beginning and throughout the years of the study we can assess the influence of the environment on body composition and bodyweight. Interestingly, a progressive increment in bodyweight, BMI and waist circumference were identified in the population studied. The reported changes in body composition produce a significant two-fold increase in the prevalence of overweight (12.1 to 26.8%) and a three-fold increase in the prevalence of obesity (13.2 to 37.3%) over the 14-year period.
Our data is in agreement with the growing obesity epidemic in adolescents in Hispanic populations. Between 1974 and 1989, data from population surveys or studies carried out in Brazil,Citation22,Citation23 Costa-Rica,Citation24 certain Caribbean countries,Citation25 ChileCitation26 and MexicoCitation27 all showed that obesity increased in adults but not in children. However, recent population results from Mexico (1993 to 2006) clearly demonstrate that obesity is increasing not only in adults but also in children and adolescents.Citation28,Citation29
The increment in waist circumference in both males and females could be of particular interest. We used a BMI of 25 and 30 kg/m2 as the cutoffs of overweight and obesity in adults, and the CDC classification for weight problems in students younger than 18 years old.Citation19 It is important to consider that the evaluation made in every year was cross-sectional and there was no follow-up for the sample studied. Using these definitions the mean of the bodyweight, BMI, and waist circumference represent one moment evaluation in the students at similar age (). Thus, we can conclude that the results reported here represent how progressively body composition changed in Mexican adolescents from 1994 through 2008 in an urban setting. Nevertheless, categorizing people based on BMI or BMI percentiles for age and gender on an individual level has the disadvantage that someone with low body fat but very high muscle mass may be misclassified as obese (or overweight, if using the pediatric terminology). However, BMI or BMI percentiles on a population level do work fairly well.Citation30 Although a significant increment in bodyweight and BMI was observed the change was particularly significant in waist circumference for both males and females. These changes suggest a high prevalence of abdominal obesity that could increase the risk for metabolic diseases in adulthood. Nevertheless, in the sample evaluated we did not identify any significant increment in fasting plasma glucose. Probably, the stress imposed by overweight and obesity in our sample is still well compensated for at this age. However current screening recommendations for fasting blood glucose underestimate the prevalence of impaired glucose metabolism in overweight adolescents.Citation31 Similar to our results, fasting plasma glucose was not associated with overweight and obesity in Mexican adolescents in another study.Citation32 Therefore, we cannot exclude a progressive deterioration in glucose metabolism if weight problems, inactivity and inadequate diet persist in the following years.
The prevalence of overweight (28.8%) and obesity (37.3%) in 2008 in our study, represents an increment of 52.6% and 65.5% since 1994. In all students, the prevalence of overweight and obesity in 2008 was 67%, which is 3% lower than that reported in Mexican adultsCitation29 and this figure is considerably higher than those found in the US 2003–2004 (NHANES survey).Citation33 The prevalence of overweight in our study (28.6%) was 38% higher than the prevalence (17.1%) found in the 2003–2004 NHANES surveyCitation33 and 26.0% higher than the prevalence (20%) in Mexican adolescents of 10 to 17 years old using Centers of Disease Control and Prevention (CDC) and the International Obesity Task Force (IOTF) percentiles.Citation34
It is important to mention that in 1997 a lower prevalence of obesity was documented (5.0%). Since the same standardized medical personnel did all the evaluations, and all students admitted to the University were evaluated every year, we think that the 1997 data could be the result of chance and a smaller sample size. In the Mexican or Latin American population we did not identify another possible explanation for a decrement in the prevalence of weight problems in 1997. Nevertheless, despite this limitation, the study has identified a significant increment in the frequency of weight problems.
Increments in the prevalence of overweight and obesity among both adults and children have been observed in many countries throughout the world.Citation35 The prevalence of obesity among adults in Great Britain almost tripled between 1980 and 2002.Citation36 Among preschool children in urban areas of China, the prevalence of obesity increased from 1.5% in 1989 to 12.6% in 1997.Citation37 In Mexico, since 1926, there has been a progressive increment in the prevalence of overweight and obesity in various regions.Citation38 Thirty eight percent of Hispanic youth (6–18 years) are overweight, which represents twice the national average for US children and 1.7 times greater than that of Mexican-American children in national US surveys.Citation39 In the United States, the prevalence of overweight has continued to increase in children and adolescents between 1999 and 2004.Citation33 The prevalence of childhood obesity has increased by 182% in the past 30 years in the USA.Citation40 A similar increment in prevalence of childhood and adolescent obesity will occur in Mexico, if appropriate actions are not taken immediately. Our results provide additional proof of the epidemiological transformation that the Mexican population has undergone during the past few decades.Citation3,Citation29,Citation38–Citation41 Preventive actions are urgently needed. Although some interventions have been initiated, they usually do not include people younger than 20 years old.Citation42 It is important to plan prevention and treatment strategies for children and adults at a national level.
Strengths and limitations of the study must be acknowledged. The results of our study complement the available information regarding the prevalence of overweight and obesity in Mexican adolescents. These data can only be applied to urban, middle-income adolescents based on the characteristics of our study population. Limitations include the cross-sectional nature of the evaluations, the absence of data obtained in other income groups and the lack information on variables related to lifestyle.
In summary, a three-fold increment in the prevalence of obesity and a two-fold increment in the prevalence of overweight were documented between 1994 and 2008 in Mexican adolescents living in an urban setting. This is a risk factor for metabolic diseases that should draw attention to the need to implement programs designed to encourage healthy lifestyles in young individuals.
Disclosures
Authors declare that they have no conflict of interest relevant to this study.
References
- World Health Organization Obesity: preventing and managing the global epidemic Report of a WHO consultation Geneva 3–5 Jun 1997 Geneva WHO 1998
- Olaiz-Fernández G Rojas R Barquera S Encuesta Nacional de Salud 2000 Tomo 2. La salud de los adultos Cuernavaca, Morelos, México Instituto Nacional de Salud Pública 2003
- Olaiz-Fernández G Rivera-Domenaco J Shamah-Levy T Encuesta Nacional de Salud y Nutrición 2006 Cuernavaca, México Instituto Nacional de Salud Pública 2006
- Villanueva J Ramírez E Factores asociados al sobrepeso en estudiantes de 8 a 18 años de áreas suburbanas, Hidalgo, México Salus cum positum vital 2004 5 3
- Martorell R Kettel L Morgen LH Laurence MGS Obesity in Latin American women and children J Nutr 1998 128 1464 1473 9732306
- World Health Organization [homepage on the internet] World Report in Obesity and Overweight [updated 2009 October 23; cited 2009 October 29]. Available from: http://www.who.int/dietphysicalactivity/publications/facts/obesity/en/ Accessed October, 2009
- Weiss R Dziura J Burgert TS Obesity and the metabolic syndrome in children and adolescents New Engl J Med 2004 350 2362 2374 15175438
- Berenson GS Srinivasan SR Wattigney WA Harsha DW Obesity and cardiovascular risk in children Ann NY Acad Sci 1993 669 93 103 8267341
- Berenson GS Srinivasan SR Bao W Newman WP Tracy RE Wattigney WA Association between multiple cardiovascular risk factor and atherosclerosis in children and young adults. The Bogalusa heart study New Engl J Med 1998 338 1650 1656 9614255
- Mahoney LT Burns TL Stanford W Coronary risk factors measured in childhood and young adult life are associated with coronary artery calcification in young adults: the Muscatine Study J Am Coll Cardiol 1996 27 277 284 8557894
- Must A Jacques PF Dallal GE Bajema CJ Dietz WH Long-term morbidity and mortality of overweight adolescents. A follow-up of the Harvard growth study of 1922 to 1935 New Engl J Med 1992 327 1350 1355 1406836
- Freedman DS Serdula MK Srinivasan SR Berenson GS Relation of circumferences and skinfold thickness to lipid and insulin concentrations in children and adolescents: the Bogalusa Heart Study Am J Clin Nutr 1999 69 2 308 317 9989697
- Leung AK Robson WL Childhood obesity Postgrad Med 1990 87 123 130 2315241
- Lee JM Appugliese D Kaciroti N Corwyn RF Bradley RH Lumeng JC Weight status in young girls and the onset of puberty Pediatrics 2007 119 3 e624 e630 17332182
- Bratberg GH Nilsen TI Holmen TL Vatten LJ Early sexual maturation, central adiposity and subsequent overweight in late adolescence. A four-year follow-up of 1605 adolescent Norwegian boys and girls: the Young HUNT study BMC Public Health 2007 7 1 7 17199891
- French SA Story M Perry CL Self-esteem and obesity in children and adolescents: a literature review Obes Res 1995 3 479 490 8521169
- Lu Q Fu-Zai Y Chun-Ming M Prevalence of impaired fasting glucose and analysis of risk factors in Han adolescents J Diabetes Complications 2009 2 Epub ahead of print
- Dietz WH Health consequences of obesity in youth: childhood predictors of adult disease Pediatrics 1998 101 518 525 12224658
- Kuczmarski RJ Ogden CL Grummer-Strawn LM CDC growth charts: United States Adv Data 2000 314 1 28
- Wang J Thornton JC Bari S Comparisons of waist circumferences measured at 4 sites Am J Clin Nutr 2003 77 379 384 12540397
- Cook S Weitzman M Auinger P Nguyen M Dietz WH Prevalence of a Metabolic Syndrome Phenotype in Adolescents. Findings From the Third National Health and Nutrition Examination Survey, 1988–1994 Arch Peadiatr Adolesc Med 2003 157 821 827
- Monteiro CA Mondini L Medeiros de Souza AL Popkin BM The nutrition transition in Brazil Eur J Clin Nutr 1995 49 105 113 7743983
- Schieri R Coltinho DC Marilia LM Recine E Evenhart JE High temporal geographic and income variation in body mass index among adults in Brazil Am J Public Health 1994 84 5 793 798 8179051
- Ministerio de Salud Encuesta Nacional de Nutrición, Antopometría San José, Costa Rica 1997
- Sinha DP Changing patterns of food, nutrition and health in the Caribbean Nutr Res 1995 15 899 938
- Atalah E Análisis de la situación nutricional de la población de Santiago Rev Med Chile 1993 121 819 826 8296089
- Hernandez B Peterson K Sobol A Rivera J Sepúlveda J Lezana MA Sobrepeso en mujeres de 12 a 49 años y niños menores de cinco años en México Salud Pública de México 1996 38 178 188
- Yamamoto-Kimura L Posadas-Romero C Posadas-Sánchez R Zamora-González J Cardoso-Saldaña G Méndez-Ramírez I Prevalence and interrelations of cardiovascular risk factors in urban and rural Mexican adolescents Jour Adolesc Healt 2006 38 591 598
- Velázquez O Rosas M Lara A Prevalencia e interrelación de enfermedades crónicas no transmisibles y factores de riesgo cardiovascular en México. Resultados finales de la Encuesta Nacional de Salud (ENSA) 2000 Arch Cardiol Mex 2005 73 62 73
- Field AE Laird N Steinberg E Fallon E Smega-Janeeh M Yanovski JA Which metric of relative weight best captures body fatness in children? Obes Res 2003 11 1345 1352 14627755
- Velasquez-Mieyer PA Cowan PA Neira CP Tylavsky F Assessing the risk of impaired glucose metabolism in overweight adolescents in a clinical setting J Nutr Health Aging 2008 12 10 750S 757S 19043652
- Velasco-Martínez RM Jiménez-Cruz A Higuera-Domínguez Domínguez de la Piedra E Bacardí-Gascón M Obesity and Insulin Resistance among Adolescents from Chiapas Nutr Hosp 2009 24 187 92 19593490
- Ogden CL Carroll MD Curtin LR McDowell MA Tabak CJ Flegal KM Prevalence of overweight and obesity in the United States, 1999–2004 JAMA 2006 295 1549 1555 16595758
- Río-Navarro BE Velázquez-Monroy O Sánchez-Castillo CP The high prevalence of overweight and obesity in Mexican children Obes Res 2004 12 215 223 14981213
- Wang Y Monteiro C Popkin BM Trends of obesity and underweight in older children and adolescents in United States, Brazil, China and Russia Am J Clin Nutr 2002 75 971 977 12036801
- Rennie KL Jebb SA Prevalence of obesity in Great Britain Obes Rev 2005 6 11 12 15655034
- Luo J Hu FB Time trends of obesity in preschool children in China from 1989 to 1997 Int J Obes Relat Metab Disord 2002 26 553 558 12075583
- Peña Reyes ME Cárdenas Barahona EE Cahvich MB Barragán A Malina RM Growth status of children 6–12 years from two different geographic regions of Mexico Ann Hum Biol 2002 29 11 25 11826877
- Mirza NM Kadow K Palmer M Solano H Rosche C Yanovski JA Prevalence of overweight among inner city Hispanic-American children and adolescents Obes Res 2004 12 1298 1310 15340113
- Jolliffe D Extent of overweight among US children and adolescents from 1972 to 2000 Int J Obes Relat Metab Disord 2004 28 4 9 14652618
- Rivera Domenaco J Shamah LT Villalpando Hernandez S Encuesta Nacional de Nutrición 1999 Estado nutricio de ninos y mujeres de México Cuernavaca Morelos México Instituto Nacional de Salud Pública 2001
- Gobierno del Estado de Puebla [homepage on the Internet] Updated 2009 October 23; cited 2009 October 23. Available from: www.puebla.gob.mx/puebla/complementos/contenido/plantilla.jsp?pagina=contenido.jsp&idmenu=12&seccion=Salud&id=36174 Accessed October 2009