
Abstract
The kallikrein-kinin system is well known for its role in pain and inflammation, and has been shown recently by our group to have a role also in the regulation of energy expenditure. We have demonstrated that B1 receptor knockout (B1KO) mice are resistant to obesity induced by a high-fat diet (HFD) and that B1 receptor expression in adipocytes regulates glucose tolerance and predisposition to obesity. However, it is also known that in the absence of B1 receptor, the B2 receptor is overexpressed and can take over the function of its B1 counterpart, rendering uncertain the role of each kinin receptor in these metabolic effects. Therefore, we investigated the impact of ablation of each kinin receptor on energy metabolism using double kinin receptor knockout (B1B2KO) mice. Our data show that B1B2KO mice were resistant to HFD-induced obesity, with lower food intake and feed efficiency when compared with wild-type mice. They also had lower blood insulin and leptin levels and higher glucose tolerance after treatment with an HFD. Gene expression for tumor necrosis factor-alpha and C-reactive protein, which are important genes for insulin resistance, was reduced in white adipose tissue, skeletal muscle, and the liver in B1B2KO mice after the HFD. In summary, our data show that disruption of kinin B1 and B2 receptors has a profound impact on metabolic homeostasis in mice, by improving glucose tolerance and preventing HFD-induced obesity. These novel findings could pave the way for development of new pharmacological strategies to treat metabolic disorders such as insulin resistance and obesity.
Introduction
Obesity and diabetes are serious health problems that are of particular concern given their increasing incidence around the world. The World Health Organization estimates that at least 2.8 million people die each year as a result of being overweight or obese, and currently more than 1.4 billion adults are overweight.Citation1 The excess energy intake in obese individuals is stored as fat tissue, which is an important organ in the regulation of metabolic homeostasis.Citation2 In this scenario, obesity and diabetes are closely related since the accumulation of adipose tissue alters the pattern of secretion of molecules involved in physiological processes, such as glucose uptake, lipid metabolism, inflammation, and vascular homeostasis,Citation3,Citation4 which may lead to insulin resistance and development of diabetes.
Study of the kallikrein-kinin system (KKS) has contributed to our understanding of many biological processes, including inflammation, nociception, vascular permeability, blood pressure regulation, and smooth-muscle contraction and relaxation.Citation5,Citation6 The KKS consists of distinct enzymes called kallikreins, which cleave their precursors, kininogens, producing kinins, a small group of peptides. Kinins activate two specific G-protein coupled receptors, ie, B1 and B2. Although it has been known since 1932 that the KKS participates in energy metabolism,Citation7 it has only been recently that these mechanisms have started to be elucidated.Citation8,Citation9 Several studies have highlighted the role of the B2 receptor in glucose homeostasis, in particular its effects on insulin-mediated glucose uptake.Citation10,Citation11 It was also shown that B1 receptor blockade by a specific antagonist could prevent hyperglycemia and insulitis, demonstrating that not only the B2 receptor but also the B1 receptor participates in the regulation of glucose uptake.Citation12
More recently, the participation of the B1 receptor in insulin secretion has been demonstrated,Citation13 as well as in the secretion of leptin by adipose tissue.Citation14 More evidence concerning the role of KKS in metabolism came from B1 receptor knockout (B1KO) mice which were shown to be hypersensitive to leptin and resistant to obesity induced by a high-fat diet (HFD).Citation15,Citation16 Moreover, overexpression of the B1 receptor in adipocytes demonstrated that this receptor regulates glucose tolerance and determines predisposition to obesity.Citation17 In agreement with these observations, recent findings have highlighted the inflammatory role of the B1 receptor in insulin-resistant glucose-fed rats, in which several pathological symptoms were reversed by treatment with specific B1 receptor antagonists.Citation18,Citation19
We can infer from the above data that KKS participates in development of obesity and related diseases, including insulin resistance and type 2 diabetes. However, the role played by each kinin receptor in these processes remains unclear, given the recurring evidence that in the absence of one receptor, the other is overexpressed and can compensate its functions.Citation20,Citation21
Therefore, we investigated energy metabolism in mice with deletion of both kinin receptors (B1B2KO). We found that B1B2KO mice had lower food and energy intake, lower feed efficiency, and lower serum insulin and leptin levels when compared with wild-type (WT) control mice. Hypothalamic mRNA expression of genes related to regulation of food intake and metabolism was unchanged in B1B2KO mice. However, when these mice were subjected to an HFD, they showed increased glucose tolerance when compared with their WT control littermates. The tumor necrosis factor-alpha (TNF-α) and C-reactive protein (CRP) genes code for pro-inflammatory proteins that are also known for their role in insulin resistance, and show reduced mRNA expression in white adipose tissue, skeletal muscle, and the liver. These novel data suggest that B1 and B2 receptors have pivotal roles in energy balance by controlling glucose homeostasis and may be targets for insulin resistance and diabetes therapy.
Materials and methods
Animals
Healthy 12-week-old C57Bl/6 male B1B2KO mice and their WT littermates were used in this study. They were obtained from the animal house at Universidade Federal de São Paulo, São Paulo, and maintained on a 12-hour light/12-hour dark cycle at 22°C, with free access to standard chow and drinking water. The experimental protocols were approved by the institutional ethics committee (01730/08).
Genotyping of kinin B1 and B2 knockout mice
Genomic DNA was isolated from a mice tail fragment using an NaOH extraction protocol.Citation22 Kinin B1 and B2 receptors were amplified by polymerase chain reaction (PCR) using the following primers: B1 receptor (NM_007539.2) sense 5′-TGAAGCTGTGAGCTCTTTG-3′ and antisense 5′-GCTACCCAGATGAGCAGGCA-3′; B2 (NM_009747.2) receptor sense 5′-TGTCCTCAGCGTGTTCTTCC-3′ and antisense 5′-GGTCCTGAACACCAACATGG-3′.
Kinin B1 and B2 receptor function
The functionality of B1 and B2 receptors was assayed by testing the contractile response of smooth muscle strips (from the fundus of the stomach) to bradykinin and des-Arg(9)-bradykinin (Bachem Inc.). Briefly, smooth muscle strips were extracted from the mice and kept at 37°C in oxygenated (95% O2, 5% CO2) modified Krebs buffer (119 NaCl mM, 4.7 KCl mM, 1.2 MgSO4:7H2O mM, 2.5 CaCl2:2H2O mM, 1.2 KH2PO4 mM, 25.0 NaHCO3 mM, and 5.5 glucose mM). After an equilibration period of 45–60 minutes at a resting tension of 0.5 g, experiments were initiated by checking the viability of the prepared specimen by exposure to carbachol (Sigma-Aldrich) at 10−5 M. Kinin agonists, ie, bradykinin 10−6 M and Des-Arg(9)-bradykinin,10−6 M), were then applied, and the contractile responses were recorded using an isometric transducer (TRI202P, Panlab) connected to a computerized system for data acquisition and analysis (PowerLab, AD Instruments).
Treatment with a high-fat diet
Mice were fed ad libitum for 12 weeks with a control diet (10% kcal from fat) or an HFD (45% kcal from fat) from Research Diets Inc. Each mouse was put in an individual cage, with weekly weight and food intake recording. After treatment, the mice were euthanized for blood and tissue collection. Feed efficiency was calculated by the ratio of total weight gain and calories of food ingested in both WT and B1B2KO mice after treatment with the HFD.
Leptin and insulin serum levels
Serum samples were separated and used for leptin (R&D Systems) and insulin (Millipore) measurement as specified by the manufacturers.
Glucose tolerance test
Mice were fasted for 8 hours before the glucose tolerance test. A small fragment of tail tissue was cut for blood collection and glucose was quantified using an Advantage II glucometer (Roche). Glucose measurements were carried out before and at 15, 30, 60, and 120 minutes after intraperitoneal injection of glucose 1 g/kg body weight.
Insulin and leptin sensitivity test
For the insulin sensitivity test, 0.01 U/kg of recombinant human insulin (Lilly) was injected intraperitoneally. Glucose levels were assessed in blood collected from the tail before and 15, 30, and 60 minutes after insulin injection immediately after treatment with the HFD. For leptin sensitivity, recombinant mouse leptin (R&D Systems) was injected as an intraperitoneal bolus of 40 µg/day for 5 days, with food intake measured under basal conditions. Food intake measured 5 days before the leptin injections was considered as basal consumption.
Gene expression
Total RNA (2 µg) was extracted from the hypothalamus, white adipose tissue, skeletal muscle, and liver from WT and B1B2KO mice using TRIzol Reagent (Invitrogen). It was reverse-transcribed using M-MLV (Invitrogen) to cDNA following the manufacturer’s instructions. The product was amplified by real-time PCR using the SYBR Green (Fermentas) protocol. Prolylcarboxipeptidase (PRCP), melanocortin 4 receptor (MC4R), neuropeptide Y (NPY), agouti-gene-related protein (AgRP), pro-opiomelanocortin (POMC), cocaine-and amphetamine-regulated transcript (CART), leptin, TNF-α, and CRP mRNAs were quantified as a relative value compared with the internal reference, β-actin. Primers used for real-time PCR were as follows: PRCP (NM_001278581.1) sense 5′-CAGGAGCTCAAGGTCAACCTGTC-3′ and antisense 5′-GAACCATACCATCAAGCTGCCAGAT-3′; MC4R (NM_016977.4) sense 5′-GCTGTGGCAGATATGCTGGTGAG-3′ and antisense 5′-CGAGCAAGGAGCTACAGATCACAG-3′; NPY (NM_023456.2) sense 5′-CGCTCTGCGACACTACAT CAA-3′ and antisense 5′-GGGCTGGATCTCTTGCCAT-3′; AgRP (NM_001271806.1) sense 5′-GGTGCTAGATC CACA GAACCG-3′ and antisense 5′-CCAAGCAGGACTCGTGCAG-3′; POMC(NM_001278581. 1) sense 5′-CGAGGCCTTTCCCCTAGAGT-3′ and anti-sense 5′-CCAGGACTTGCTCCAAGCC-3′; CART (NM_013732.7) sense 5′-TGGATGATGCGTCCCATGA-3′ and antisense 5′-CGGAATGCGTTTACTCTTGAGC-3′; leptin (NM_008493.3) sense 5′-AGCATTCAGG GCTAACATCC-3′ and antisense 5′-TATCCGCCAAGCAGAGGGT-3′; TNF-α (NM_013693.3) sense 5′-CACCACGCTCTTCTGTCTAC-3′ and antisense 5′-GATCTGAGTGTGAGGGTCTGG-3′; CRP (NM_007768.4) sense 5′-GGAGAAGCTACTCTGGTGCCTTCT-3′ and antisense 5′-CACACAGTAAAGGTGTTCAGTGGCT-3′, and β-actin (NM_007393.3) sense 5′-GAACCCTAAGGCCAACCGTGAA-3′ and antisense 5′-GACCAGAGGCATACAGGGACAAC-3′. Quantitative values for mRNA expression were obtained by the parameter 2−ΔCt, in which ΔCt represents the subtraction of the β-actin Ct values from the ones of the target gene.
Treatment with kinin B1 and B2 receptor antagonists
Healthy 12-week-old male C57Bl/6 mice were injected intraperitoneally daily for 7 days with the B1 receptor antagonist R-715 (1 mg/kg) together with the B2 receptor antagonist HOE-140 (500 µg/kg) or vehicle (saline). Both antagonists were obtained from Bachem Inc. After treatment, the mice in both groups were euthanized and their tissues collected for analysis of leptin, CRP, and TNF-α gene expression.
Statistical analysis
The results are reported as the mean ± standard error of the mean. Statistically significant differences in mean values were evaluated by the independent Student’s t-test when two groups were compared, or by the ANOVA test when three or more groups were analyzed. A P-value ≤0.05 was considered to be statistically significant.
Results
Genetic and pharmacological assays for kinin B1 and B2 receptors
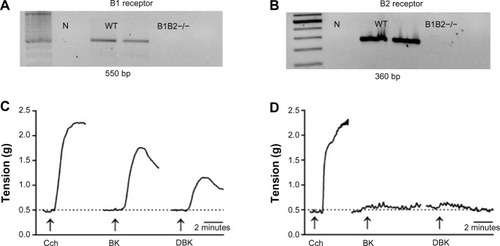
Deletion of both kinin receptors in the mice was confirmed by PCR genotyping, as demonstrated in . In the DNA samples from WT mice, B1 () and B2 receptor () gene fragments were amplified by PCR, whereas in B1B2KO mice the fragments could not be amplified. The pharmacological functionality of the B1 and B2 receptors was assayed by testing the contractile response of smooth muscle strips from the gastric fundus to bradykinin and des-Arg(9)-bradykinin. WT mice preparations were responsive to carbachol and to B1 and B2 receptor agonists (). On the other hand, double knockout mice were responsive to carbachol but not to the kinins (), confirming the absence of B1 and B2 receptors in this genetic mouse model.
Figure 1 Genotyping the kinin B1 and B2 receptor in B1B2KO mice.
Abbreviations: BK, bradykinin; DBK, des-Arg(9)-bradykinin; N, negative control; WT, wild-type; B1B2−/−, B1B2KO; Cch, carbachol.
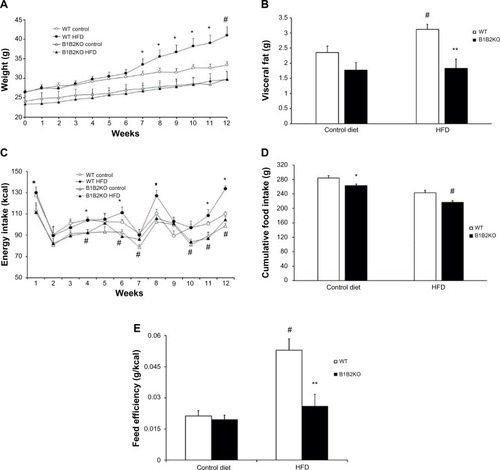
B1B2KO mice protected against HFD-induced obesity
Body weight was measured for 12 weeks in B1B2KO mice on a control diet or the HFD. The mice had a reduced body weight and smaller visceral fat depots after the HFD but not after the control diet (). To investigate why B1B2KO mice were protected against HFD-induced weight gain, food and energy intake was measured every week during the HFD and chow diet regimen. As shown in , WT mice showed higher food intake and calories ingested when compared with B1B2KO mice regardless of the type of diet. Also, the B1B2KO mice on the HFD showed lower feeding efficiency (), indicating more energy expenditure after the HFD.
Figure 2 B1B2KO mice are protected against obesity induced by HFD treatment and present lower food intake and feed efficiency.
Abbreviations: HFD, high-fat diet; WT, wild-type.
Gene expression in the hypothalamus was unchanged in B1B2KO mice
Given the reduced food and energy intake found in the B1B2KO mice, we also investigated the mRNA expression of important hypothalamic genes associated with satiety and energy balance. However, expression of orexigenic (NPY, AgRP), anorexigenic (POMC, CART), PRCP, and MC4R genes was not significantly different between B1B2KO and WT mice treated with a control diet or the HFD (data not shown).
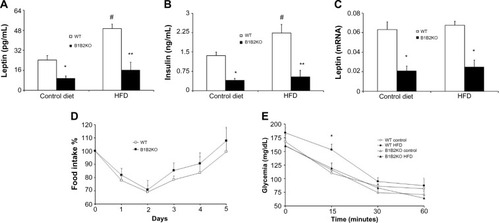
Insulin and leptin levels were reduced in B1B2KO mice
In order to better understand the metabolic profile in B1B2KO mice, we measured two important hormones involved in energy homeostasis, ie, insulin and leptin. Insulin and leptin levels (protein in the serum and mRNA from white adipose tissue) were decreased in B1B2KO mice when compared with WT mice using both regimens (). No difference in leptin sensitivity was observed in B1B2KO mice after the HFD (). Also, B1B2KO mice on the control diet or HFD did not present changes in insulin sensitivity when compared with WT mice ().
Figure 3 B1B2KO mice have low insulin and leptin levels.
Abbreviations: HFD, high-fat diet; WT, wild-type.
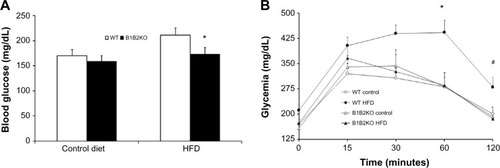
B1B2KO mice showed improved glucose tolerance
Differences in insulin levels between B1B2KO and WT mice suggested a potential impact of the B1 and B2 receptors on blood glucose levels and glucose tolerance. B1B2KO mice showed lower glucose levels than WT mice after treatment with the HFD (). Accordingly, in this condition, B1B2KO mice also showed higher glucose tolerance after glucose stimulation ().
Figure 4 B1B2KO mice show high glucose tolerance.
Abbreviations: HFD, high-fat diet; WT, wild-type.
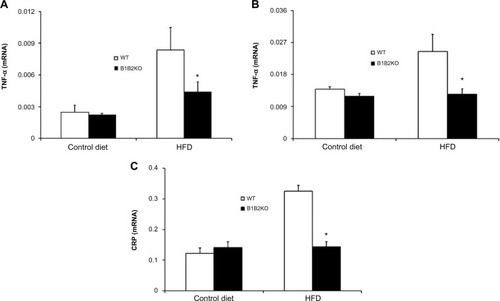
Genes related to insulin resistance were downregulated after HFD
Given the importance of inflammation in the pathogenesis of insulin resistance, we measured the expression of two inflammatory mediators in different metabolic tissues of double knockout mice. TNF-α mRNA expression was reduced in both white adipose tissue and skeletal muscle in B1B2KO mice after the HFD (). Similarly, CRP mRNA expression was decreased in the livers of the B1B2KO mice after the HFD (). In addition, WT mice were treated for 7 days with specific B1 (R-715) and B2 (HOE-140) receptor antagonists. Gene expression of leptin and TNF-α in white adipose tissue and skeletal muscle was measured and CRP expression was evaluated in the liver, but no differences were observed (data not shown).
Figure 5 Inflammatory cytokines are downregulated in tissues of B1B2KO mice.
Abbreviations: HFD, high-fat diet; WT, wild-type; CRP, C-reactive protein; TNF-α, tumor necrosis factor-alpha.
Discussion
Using both genetic and pharmacological approaches, the role of kinin receptors in energy balance has started to be elucidated in recent years. However, it is known that when one of the kinin receptors is blocked or deleted, the other receptor may compensate by upregulating its expression, which may introduce a confounding factor when interpreting data. To resolve part of this issue, B1B2KO mice were generated and characterized. These double knockout mice are healthy, fertile, normotensive, and protected against endotoxin-induced hypotension.Citation23
In our present work, we have shown that B1B2KO mice are resistant to HFD-induced obesity, showing less food intake and a smaller weight gain per calorie intake when compared with WT mice. Based on these observations, we analyzed the mRNA expression of genes in the hypothalamus associated with metabolism. NPY and AgRP, both orexigenic genes, were found to be present at the same levels in B1B2KO and WT mice whether on the control diet or the HFD. Similarly, expression of anorexigenic genes, POMC and CART, was not different between knockout and control mice. Recently, our group found that CART mRNA expression is elevated in the lateral hypothalamic area of B1KO mice.Citation24 Even though B1KO and B1B2KO mice show similarities in some aspects of metabolism, expression of CART seems to be different in the two strains. However, it should be taken into account that we analyzed expression of CART in the whole hypothalamus of B1B2KO mice, and not only in the lateral hypothalamic area, which may have contributed to the observed lack of differences. Further, Heijboer et al demonstrated that gene expression for NPY, AgRP, POMC, and CART is not altered in the mouse hypothalamus after treatment with an HFD,Citation25 suggesting that regulation of these genes may be not affected by an HFD in WT or B1B2KO mice. PRCP and MC4R gene expression was also tested, given the role of these genes in metabolism. PRCP is an enzyme associated with inactivation of alpha-melanocortin-stimulating hormone in rodents,Citation26 which in turn binds to MC4R to regulate food intake behavior and energy balance.Citation27 Together with other orexigenic and anorexigenic genes, expression of PRCP and MC4R was unchanged in the B1B2KO mouse hypothalamus after treatment with the control diet or the HFD, indicating that the reduced food consumption observed in these mice was probably related to an alternative metabolic pathway not examined in this study.
Circulating levels of leptin and insulin were also measured in the B1B2KO and WT mice. Decreased serum levels of both hormones were found in the double knockout mice on the control diet or the HFD. These data suggest hypersensitivity to these hormones, although no changes in insulin and leptin sensitivity were observed in B1B2KO mice. On the other hand, B1B2KO mice showed less glycemia and increased glucose tolerance after treatment with the HFD. We believe the mechanisms underlying these findings may be related to the control of energy intake and its expenditure. Indeed, energy expenditure is increased in B1B2KO mice, as suggested by the feed efficiency data. Studies analyzing the impact of B1 receptor on metabolism have found that B1KO mice benefit from deletion of the B1 receptor, with better leptin and insulin sensitivity.Citation16,Citation17 In agreement with this, blockade of the B1 receptor by the specific inhibitor SSR240612 reverted insulin and glucose concentrations to baseline levels in insulin-resistant glucose-fed rats.Citation19
By analyzing the B2 receptor knockout (B2KO) mouse phenotype, our group has found decreased serum insulin levels and increased glucose uptake after stimulation with insulin (unpublished data). Schweitzer et alCitation28 reported that B2KO mice also have lower serum insulin levels, but show decreased glucose tolerance. Conversely, it has been shown that B2KO mice have higher serum insulin levels and are resistant to the effects of insulin on mediating glucose uptake.Citation29 Taking these data together, the role of the B2 receptor in glucose uptake remains controversial. We can conclude that disruption of this receptor leads to significant alterations in glucose homeostasis, probably by compensatory mechanisms promoted by other related genes. Indeed, recent gene expression data from microarray analysis of B2KO mice have shown dysregulation of several genes related to pathological pathways involved in endothelial injury, oxidative stress, insulin and leptin metabolism, and the inflammatory process.Citation30 Therefore, we propose that deletion of the B2 receptor in mice regulates expression of not only the B1 receptor,Citation20 but also genes linked to insulin and glucose homeostasis. In agreement with this idea, we believe that disruption of the B1 receptor in mice leads not only to altered expression of B2 receptor,Citation21 but also other genes related to control of the energy balance. In this scenario, our double knockout model shows that metabolic parameters measured in the B1B2KO mice were not exclusively dependent on B1 or B2 receptor regulation, indicating that ablation of the B1 and/or B2 receptor might also have a profound impact on several other gene pathways related to disorders of metabolism.
To determine the link between abrogation of KKS and genes involved in metabolic homeostasis, we analyzed gene expression of proteins related to insulin resistance and the inflammatory process. We focused on inflammatory genes because the B1 receptor plays an important role in the immune response in many disorders.Citation31–Citation33 Thus, we measured gene expression of TNF-α and CRP, given that these proteins are present in elevated concentrations in insulin-resistant and obese individuals. In these cases, white adipose tissue and skeletal muscle are the main sources of TNF-α,Citation34,Citation35 which is directly related to impaired glucose uptake and insulin resistance mechanisms via activation of nuclear factor kappa B and IKKβ signaling.Citation36 Here we found that B1B2KO HFD-treated mice had decreased TNF-α mRNA expression in white adipose tissue and skeletal muscle. Similarly, increased CRP levels, with liver as the main source, are related to impaired insulin resistance.Citation16 We observed that CRP mRNA expression was decreased in the liver of the B1B2KO mouse after the HFD. Recently, Diaz et al demonstrated that blockade of the B1 receptor is able to reverse inflammatory biomarkers related to insulin resistance in insulin-resistant glucose-fed rats.Citation19 These findings suggest that reduced mRNA expression of TNF-α and CRP could be related to deletion of the B1 receptor in B1B2KO mice. Absence of the pro-inflammatory B1 receptor could be mandatory to modify the expression of inflammatory genes involved in the pathology of insulin resistance.
Accordingly, in order to observe the effect of pharmacological blockade of the B1 and B2 receptors, we treated WT animals with specific antagonists, ie, R-715 and HOE-140. No change in mRNA expression was observed after pharmacological treatment for leptin, TNF-α, and CRP gene expression in white adipose tissue, skeletal muscle, or the liver. Conversely, leptin mRNA expression was not decreased in white adipose tissue after treatment with specific antagonists, indicating that the decreased baseline leptin levels found in B1B2KO mice probably resulted from more profound and prolonged inactivation of kinin receptors.
In conclusion, we found that a deficiency of B1 and B2 receptors protects against obesity induced by an HFD and promotes a decrease in circulating levels of insulin and leptin. In addition, deletion of both B1 and B2 receptors has specific consequences with regard to mechanisms involving glucose homeostasis, ie, improving glucose tolerance. We propose that compensatory effects, as a consequence of disruption of the KKS, could dysregulate expression of inflammatory genes related to metabolic disorders such as insulin resistance. Therefore, our findings reinforce the role of the KKS in metabolism by showing that B1 and B2 receptor regulation is crucial for glucose tolerance control in mice, and suggest that new drugs focused on the KKS might be effective as therapeutic tools for conditions related to obesity, such as insulin resistance and diabetes.
Acknowledgments
We are grateful to our laboratory technicians Juliana Gilbert and Emanoel Barreto for helping with the experiments and to Dr Renan Paulo Martin for assistance with the graphical design.
This work was supported by Fundação de Amparo a Pesquisa do Estado de São Paulo, Conselho Nacional de Desenvolvimento Científico e Tecnológico, and Coordenação de Aperfeiçoamento de Pessoal de Nível Superior.
Disclosure
The authors report no conflicts of interest in this work.
References
- World Health OrganizationGlobal Health Observatory (GHO) data, risk factors Available from: http://www.who.int/gho/ncd/risk_factors/obesity_text/en/Accessed August 12, 2015
- WakiHTontonozPEndocrine functions of adipose tissueAnnu Rev Pathol2007231 5618039092
- ArnerPThe adipocyte in insulin resistance: key molecules and the impact of the thiazolidinedionesTrends Endocrinol Metab200314137 14512670740
- TilgHMoschenARAdipocytokines: mediators linking adipose tissue, inflammation and immunityNat Rev Immunol20066772 78316998510
- BhoolaKDFigueroaCDWorthyKBioregulation of kinins: kallikreins, kininogens, and kininasesPharmacol Rev1992441 801313585
- RegoliDBarabeJPharmacology of bradykinin and related kininsPharmacol Rev1980321 467015371
- FreyEKKrautHWerleEÜber die Blutzuckersenkende Wirkung des Kallikreins (Padutins). [The hypoglicemic effects of Kallikreins (Padutins)]Klin Wochenschr193211846 849 German
- DietzeGWicklmayrMEffect of bradykinin on muscular glucose uptake in manKlin Wochenschr197755357 358 German870748
- DietzeGJWicklmayrMRettKJacobSHenriksenEJPotential role of bradykinin in forearm muscle metabolism in humansDiabetes199645Suppl 1S110 S1148529790
- IsamiSKishikawaHArakiEBradykinin enhances GLUT4 translocation through the increase of insulin receptor tyrosine kinase in primary adipocytes: evidence that bradykinin stimulates the insulin signalling pathwayDiabetologia199639412 4208777990
- BeardKMLuHHoKFantusIGBradykinin augments insulin-stimulated glucose transport in rat adipocytes via endothelial nitric oxide synthase-mediated inhibition of Jun NH2-terminal kinaseDiabetes2006552678 268717003331
- ZuccolloANavarroMFronteraMCuevaFCarattinoMCatanzaroOLThe involvement of kallikrein-kinin system in diabetes type I (insulitis)Immunopharmacology19994569 7410614992
- AraujoRCMoriMAMerinoVFRole of the kinin B1 receptor in insulin homeostasis and pancreatic islet functionBiol Chem2006387431 43616606341
- MoriMAAraujoRCPesqueroJBKinin B1 receptor stimulation modulates leptin homeostasis. Evidence for an insulin-dependent mechanismInt Immunopharmacol20088242 24618182234
- FonsecaRGSalesVMRopelleELack of kinin B(1) receptor potentiates leptin action in the liverJ Mol Med (Berl)201391851 86023385644
- MoriMAAraújoRCReisFCKinin B1 receptor deficiency leads to leptin hypersensitivity and resistance to obesityDiabetes2008571491 150018332096
- MoriMASalesVMMottaFLKinin B1 receptor in adipocytes regulates glucose tolerance and predisposition to obesityPLoS One20127e4478223024762
- DiasJPTalbotSSenecalJCarayonPCoutureRKinin B1 receptor enhances the oxidative stress in a rat model of insulin resistance: outcome in hypertension, allodynia and metabolic complicationsPLoS One20105e1262220830306
- DiasJPCoutureRBlockade of kinin B(1) receptor reverses plasma fatty acids composition changes and body and tissue fat gain in a rat model of insulin resistanceDiabetes Obes Metab201214244 25322023455
- DukaIKintsurashviliEGavrasIJohnsCBresnahanMGavrasHVasoactive potential of the b(1) bradykinin receptor in normotension and hypertensionCirc Res200188275 28111179194
- RodriguesESSilvaRFMartinRPEvidence that kinin B2 receptor expression is upregulated by endothelial overexpression of B1 receptorsPeptides2013421 723306173
- TruettGEHeegerPMynattRLTruettAAWalkerJAWarmanMLPreparation of PCR-quality mouse genomic DNA with hot sodium hydroxide and tris (HotSHOT)Biotechniques20002952 5410907076
- CaylaCTodirasMIliescuRMice deficient for both kinin receptors are normotensive and protected from endotoxin-induced hypotensionFASEB J2007211689 169817289925
- TorresHALouise MottaFSalesVMKinin B1 receptor gene ablation affects hypothalamic CART productionBiol Chem2013394901 90823585179
- HeijboerACVosholPJDongaEHigh fat diet induced hepatic insulin resistance is not related to changes in hypothalamic mRNA expression of NPY, AgRP, POMC and CART in micePeptides2005262554 255815979206
- WallingfordNPerroudBGaoQProlylcarboxypeptidase regulates food intake by inactivating alpha-MSH in rodentsJ Clin Invest20091192291 230319620781
- FanWBostonBAKestersonRAHrubyVJConeRDRole of melanocortinergic neurons in feeding and the agouti obesity syndromeNature1997385165 1688990120
- SchweitzerGGCastorenaCMHamadaTFunaiKAriasEBCarteeGDThe B2 receptor of bradykinin is not essential for the post-exercise increase in glucose uptake by insulin-stimulated mouse skeletal musclePhysiol Res201160511 51921401298
- DukaIShenoudaSJohnsCKintsurashviliEGavrasIGavrasHRole of the B(2) receptor of bradykinin in insulin sensitivityHypertension2001381355 136011751717
- JaffaMAKobeissyFAl HaririMGlobal renal gene expression profiling analysis in B2-kinin receptor null mice: impact of diabetesPLoS One20127e4471423028588
- PesqueroJBAraujoRCHeppenstallPAHypoalgesia and altered inflammatory responses in mice lacking kinin B1 receptorsProc Natl Acad Sci U S A2000978140 814510859349
- CunhaTMVerriWAJrFukadaSYTNF-alpha and IL-1beta mediate inflammatory hypernociception in mice triggered by B1 but not B2 kinin receptorEur J Pharmacol2007573221 22917669394
- GobelKPankratzSSchneider-HohendorfTBlockade of the kinin receptor B1 protects from autoimmune CNS disease by reducing leukocyte traffickingJ Autoimmun201136106 11421216565
- KernPASaghizadehMOngJMBoschRJDeemRSimsoloRBThe expression of tumor necrosis factor in human adipose tissue. Regulation by obesity, weight loss, and relationship to lipoprotein lipaseJ Clin Invest1995952111 21197738178
- SaghizadehMOngJMGarveyWTHenryRRKernPAThe expression of TNF alpha by human muscle. Relationship to insulin resistanceJ Clin Invest1996971111 11168613535
- PannacciulliNCantatoreFPMinennaABellaciccoMGiorginoRDe PergolaGC-reactive protein is independently associated with total body fat, central fat, and insulin resistance in adult womenInt J Obes Relat Metab Disord2001251416 142011673760