Abstract
The presynaptic storage and release of glutamate, an excitatory neurotransmitter, is modulated by a family of transport proteins known as vesicular glutamate transporters. Vesicular glutamate transporter 1 (VGLUT1) is widely distributed in the central nervous system of most mammalian and nonmammalian species, and regulates the uptake of glutamate into synaptic vesicles as well as the transport of filled glutamatergic vesicles to the terminal membrane during excitatory transmission. In rodents, VGLUT1 mRNA is primarily found in the neocortex, cerebellum, and hippocampus, and the VGLUT1 transport protein is involved in intercortical and corticothalamic projections that remain distinct from projections involving other VGLUT isoforms. With the exception of a few thalamic sensory nuclei, VGLUT1 mRNA is absent from subcortical areas and does not colocalize with other VGLUT mRNAs. VGLUT1 is similarly restricted to a few thalamic association nuclei and does not colocalize with other VGLUT proteins. However, recent work in primates has shown that VGLUT1 mRNA is also found in several subcortical nuclei as well as cortical areas, and that VGLUT1 may overlap with other VGLUT isoforms in glutamatergic projections. In order to expand current knowledge of VGLUT1 distributions in primates and gain insight on glutamatergic transmission in the visual system of primate species, we examined VGLUT1 mRNA and protein distributions in the lateral geniculate nucleus, pulvinar complex, superior colliculus, V1, V2, and the middle temporal area (MT) of prosimian galagos. We found that, similar to other studies in primates, VGLUT1 mRNA and protein are widely distributed in both subcortical and cortical areas. However, glutamatergic projections involving VGLUT1 are largely limited to intrinsic connections within subcortical and cortical areas, as well as the expected intercortical and corticothalamic projections. Additionally, VGLUT1 expression in galagos allowed us to identify laminar subdivisions of the superior colliculus, V1, V2, and MT.
Introduction
Glutamatergic transmission in the central nervous system is presynaptically regulated by a family of proteins known as vesicular glutamate transporters (VGLUTs).Citation1–Citation6 VGLUT proteins package glutamate into presynaptic vesicles and transport these vesicles to the synaptic membrane prior to excitatory transmission. Two main VGLUT isoforms, VGLUT1 and VGLUT2, are widely distributed in the brain and are responsible for the majority of glutamatergic transmission in the central nervous system.Citation7–Citation10 These two isoforms typically occupy separate circuits, where VGLUT2 is primarily restricted to projections between and within subcortical areas, as well as thalamocortical projections, while VGLUT1 is reserved for intercortical and corticothalamic projections.Citation11–Citation13 Previous studies in rodents have shown that VGLUT1 is strongly expressed in the cerebral cortex, cerebellum and hippocampus and largely absent from the thalamus and brainstem.Citation2,Citation9,Citation11–Citation13 In the cortex, VGLUT1 mRNA is densely expressed in each of the cortical layers, with varying distributions in each functional area, while VGLUT1 protein is diffusely expressed across all the cortical layers with slight laminar differences in each area. In the thalamus, VGLUT1 mRNA and protein are moderately expressed in primary relay nuclei and weakly expressed in some association nuclei.
Although little work has been done in primates to characterize the distributions of VGLUT proteins in the central nervous system, recent studies show that VGLUT mRNA and protein expression in the brains of primates are quite similar to that of rodent brains, suggesting that the roles of VGLUTs in excitatory neurotransmission are highly conserved across mammalian species.Citation14–Citation17 In order to expand on the knowledge of VGLUT distributions in primates and gain insight into the functional organization of the primate visual system, we examined VGLUT1 mRNA and protein distributions within the visual system of prosimian galagos. Galagos are small, nocturnal primates that represent the prosimian branch of the primate order.Citation18 Prosimians more closely resemble ancestral primates than any of the present-day anthropoids (monkeys, apes, and humans), and thus the distribution pattern of VGLUTs in galagos may more closely reflect the distribution pattern of early primates. Previous research on the visual systems of galagos showed that VGLUT2 is localized to the expected thalamocortical and subcortical pathways,Citation17 so we predicted that VGLUT1 expression would be localized to intercortical and corticothalamic circuits. Our results show that, while VGLUT1 expression in primates is more widespread in subcortical and cortical areas than VGLUT1 expression in homologous areas of rodents, the expression patterns are largely confined to the expected pathways. These findings suggest that VGLUT1 expression patterns are highly conserved across mammalian species and that VGLUT1 is widely utilized in glutamatergic transmission.
Materials and methods
Four adult galagos (Otolemur garnetti) were examined for VGLUT1 protein and mRNA expression. Experimental procedures were all approved by the Vanderbilt Institutional Animal Care and Use Committee and followed the guidelines published by the National Institutes of Health.
Tissue acquisition and histology
Animals were injected with a lethal overdose of sodium pentobarbital (80 mg/kg), and when areflexive, were perfused transcardially with sterile 0.1 M phosphate-buffered saline (PBS), followed by 4% paraformaldehyde (PFA) in sterile PBS. The brain was removed from the skull, postfixed for 2–4 hours in 4% PFA in sterile PBS and cryoprotected in 30% sucrose in sterile PBS. The whole brain was cut into 40 µm coronal sections on a sliding microtome, separated into six series, and stored at −20°C in cryoprotectant solution (30% ethylene glycol, 30% glycerol, 10% phosphate buffer (pH 7.4), 1% 5 M NaCl, 29% sterile distilled deionized water) until further study. Two series from each animal were processed for cytochrome oxidase (CO)Citation19 and Nissl substance with thionin to determine the architectural and laminar boundaries of subcortical and cortical regions.
In situ hybridization
One series from each animal was labeled for VGLUT1 mRNA using in situ hybridization. Digoxigenin-labeled riboprobes for VGLUT1 were prepared using macaque cDNA libraries and labeled using a conventional DIG-dUTP labeling kit (Roche Diagnostics, Indianapolis, IN). In situ hybridization was carried out as previously described.Citation17 The forward and reverse primers for VGLUT1 were CCGCTACAT-TATCGCCATCA and CGATGGGCACGATGATGGTC, respectively, which targeted position 204–1093 of human VGLUT1 (AB032436). BLAST assessments of VGLUT1 homology across human, macaque, rat and mouse transcripts show 98%–100% homology, indicating that the VGLUT1 gene is highly conserved across species. However, sense and antisense probes for VGLUT1 were still used to evaluate the binding specificity and background reactivity of macaque VGLUT1 probes in galago tissue.
Immunohistochemistry
One series from each animal was labeled for VGLUT1 protein using commercial antibodies against VGLUT1 and previously described immunohistochemical techniques.Citation17 Two antibodies against VGLUT1 were used in this study, a polyclonal antibody raised in rabbits (MAb Technologies, Atlanta GA) that recognized amino acids 543–560 of rat VGLUT1, and a polyclonal antibody raised in guinea pigs (Synaptic Systems, Goettingen, Germany) that recognized amino acids 456–560 of rat VGLUT1. Western blot analysis showed that both antibodies were highly specific for primate VGLUT1, but due to the profuse and indistinct distribution of VGLUT1 in cortex, it became necessary to corroborate our findings using more than one antibody. Slight differences in the intensity of labeling in brainstem nuclei were noted when the two antibodies were compared, but no differences were noted in the thalamus or cortex. Primary antibodies were subsequently labeled with biotinylated secondary antibodies (Vector Labs, Burlingame, CA) amplified using an avidin/biotin conjugate kit (Vector Labs) and visualized using a diaminidobenzidine reaction with nickel enhancement. Details of primary and secondary antibody concentrations are listed in .
Table 1 Commercial reagents and concentrations for VGLUT1 immunohistochemistry
Light microscopy
Digital photomicrographs of cortical and subcortical areas were captured using a Nikon DXM2200 camera (Nikon, Melville, NY) mounted on a Nikon E800 microscope. Images were adjusted for contrast using Adobe Photoshop (Adobe Systems, San Jose, CA), but were otherwise unaltered.
Analysis
Relative staining intensity for VGLUT1 mRNA and VGLUT1 protein was analyzed using relative optical density; background relative optical density values were sampled in low magnification images of each area, from fiber tracts that did not show VGLUT1 expression, and subtracted out of relative optical density values from each area of interest. Relative density for both stains was analyzed using comparative cell counts of each area in high magnification images of serial Nissl and VGLUT1 sections. Analytical measures were only used to judge general differences in staining patterns for each area and were not intended to quantify levels of expression in any given region of interest.
Results
The regional distributions of VGLUT1 mRNA and protein varied significantly between subcortical and cortical areas in the galago brain. VGLUT1 mRNA was moderately expressed in the lateral geniculate nucleus (LGN), superior colliculus (SC), pulvinar, and middle temporal visual area (MT), but strongly expressed in V1 (area 17) and V2 (area 18). However, VGLUT1 protein was moderately expressed in MT and the SC, but strongly expressed in the LGN, pulvinar, V1, and V2. The detailed expression patterns of VGLUT1 are discussed below. Control staining using sense and antisense probes also confirmed that the engineered VGLUT1 probe was specific to VGLUT1 mRNA in galago cortex. Additionally, Western blot analysis for both VGLUT1 antibodies confirmed specificity to VGLUT1 protein in primate tissue (data not shown).
VGLUT1 in the thalamus and midbrain Lateral geniculate nucleus (LGN)
The dorsal LGN in galagos is classically divided into six layers with five interlaminar zones (). As previously described,Citation20 terms for the layers reflect cell type (magnocellular [M], parvocellular [P], or koniocellular [K]) and relative location (internal [I] or external [E]). Definitions for the interlaminar zones employ the neighboring dorsal and ventral LGN layer, such that the interlaminar zone between the internal M and P layers is termed Ipm. For the purposes of the present results, our identification of LGN layers and interlaminar zones follows previous descriptions.
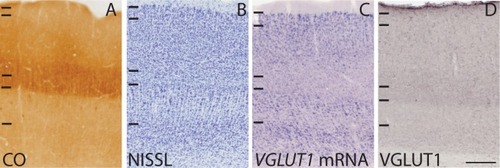
Figure1 Coronal sections through the lateral geniculate nucleus stained for (A) CO, (B) Nissl, (C and E) VGLUT1 mRNA, and (D and F) VGLUT1 protein.
Abbreviations: PE, external parvocellular; KE, external koniocellular; KI, internal koniocellular; PI, internal parvocellular; MI, internal magnocellular; ME, external magnocellular.
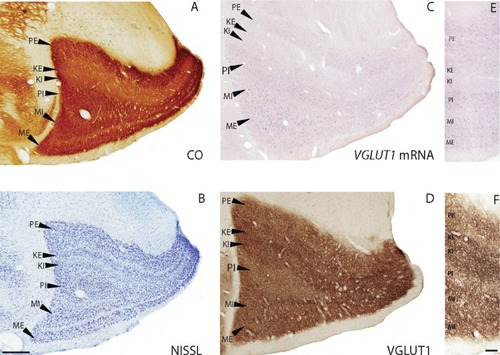
Previous descriptions of CO expression in the galago LGN have shown that all layers and interlaminar zones have some level of cytochrome oxidase reactivity.Citation21–Citation23 The M and P layers stain darkly for CO, while the K layers and interlaminar zones exhibit more moderate reactivity (). The LGN layers contain dense populations of darkly stained cells in Nissl preparations, while the interlaminar zones have sparse populations of more lightly stained cellsCitation17 (). We processed brain sections through the LGN for CO and Nissl substance in order to identify layers and relate VGLUT1 mRNA and protein expression patterns to these layers (). Our results were consistent with previous descriptions of CO and Nissl staining in the galago LGN.
In sections stained for VGLUT1 mRNA, all layers of the LGN showed moderate levels of VGLUT1 expression, while the interlaminar zones showed weaker levels of VGLUT1 expression (). Comparisons of cell counts from Nissl and VGLUT1 sections indicated that more than half the neurons in all layers express at least some VGLUT1 mRNA. Neurons in the M layers most strongly expressing VGLUT1 mRNA were large in size but sparsely distributed within the layers, while neurons in the P layers positive for VGLUT1 mRNA were smaller in size, but densely packed (). These layers both project to layer IV of V1, which shows corresponding strong levels of VGLUT1 protein (discussed below). Neurons in the K layers positive for VGLUT1 mRNA were smaller than both M and P cells, sparsely distributed within the layers, and weakly stained overall. Cells within the interlaminar zones showed varying levels of VGLUT1 expression, but in general, they were smaller and expressed less VGLUT1 mRNA than cells within the K layers of the LGN. Both the K layers and relay cells in the interlaminar zones project to layers III and I of V1, which also showed weak levels of VGLUT1 protein.
In sections stained for VGLUT1 protein, dense immunoreactivity (ir) was visible in all the LGN layers and inter-laminar zones (). VGLUT1 ir was largely confined to punctate terminals that seemed to surround unlabeled cell bodies (). The M, P, and K layers all showed strong, evenly distributed labeling of VGLUT1 terminals, indicating that retinogeniculate projections likely use VGLUT1 for glutamatergic transmission. Cell bodies positive for VGLUT1 were not found. The interlaminar zones of the LGN had somewhat stronger and denser labeling of VGLUT1 in comparison with the LGN layers, likely marking corticogeniculate terminationsCitation23 or, less likely, tectogeniculate projections from the upper superficial gray layer of the SCCitation24 to these zones. Additionally, VGLUT1-positive terminals in the interlaminar zones seemed to be more clustered and appeared as darker puncta than those within the layers of the LGN ().
Pulvinar
The pulvinar of prosimian galagos is divided here into the three traditional divisions based on anatomic appearance and relative location, the medial, lateral, and inferior pulvinar (PM, PL, and PI, respectively).Citation25 While it is almost certain that further subdivisions exist within these divisions, the anatomic identification of such partitions has proven problematic due to the lack of markers that selectively label further subdivisions within the pulvinar complex of galagos. VGLUT1 expression in the galago pulvinar does give us some clues about its architectonic organization, but does not clearly differentiate any subdivisions within the major divisions.
All three major divisions of the pulvinar are easily identified by CO and Nissl preparations in galagosCitation26 (). PM is characterized by intense CO reactivity and dense populations of Nissl-stained cells, while PL is characterized by fiber tracts separating CO-rich regions with evenly dispersed Nissl populations. PI lies ventral to PM and PL, and is largely separated from PM and PL by the brachium of the SC, a large white matter tract that runs through this region of the thalamus (best seen in ).
Figure 2 Coronal sections through the pulvinar complex stained for (A) Nissl, (B) CO, (C) VGLUT1 mRNA, and (D) VGLUT1 protein. (E–J) High magnification images of subdivisions of the pulvinar complex stained for (E–G) VGLUT1 mRNA and (H–J) VGLUT1 protein.
Abbreviations: PI, inferior pulvinar; PL, lateral pulvinar; PM, medial pulvinar.
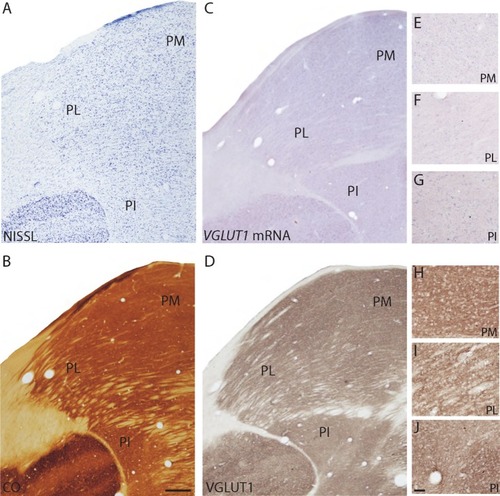
All three divisions of the pulvinar showed distinct distributions of positively labeled cells when stained for VGLUT1 mRNA (). PM was densely populated by cells that showed moderate staining for VGLUT1 mRNA, while PL was diffusely populated by cells that showed weak staining for VGLUT1 mRNA. Although PM is reciprocally connected with multiple areas in frontal, temporal, and parietal cortex that are not predominantly visual,Citation26 VGLUT1 expression in this division indicates these projections likely use VGLUT1 for glutamatergic transmission as well. PL sends projections to V1 and V2, and weak VGLUT1 expression here indicates that visual connections from PL to cortex may not utilize VGLUT1 to a great extent. PI showed both strong and weak labeling of VGLUT1-positive cells that varied in distribution across the division, likely indicating that multiple cell populations exist within this region. PI projects cortically to V1, V2, and MT, and weak VGLUT1 protein expression is seen in the recipient layers of those three areas, indicating that cell populations in PI that do project there may not rely heavily on VGLUT1.
Similar distributions across the pulvinar were seen in sections stained for VGLUT1 protein (). PM showed dense, even labeling of VGLUT1 across the extent of the pulvinar, while PL showed diffuse labeling of VGLUT1 that was confined to the regions around the fiber tracts and not within them. Frontal and parietal areas projecting to PM showed strong VGLUT1 distributions, while visual connections to PL showed moderate VGLUT1 distributions in comparison. These distributions correlated well with differential VGLUT1 ir in PM and PL, and again suggest that VGLUT1 is utilized to a lesser extent in visual projections to the pulvinar. PI showed regions of either strong or faint labeling of VGLUT1 across the nucleus, possibly reflecting subdivisions that differ in levels of glutamatergic input. PI in galagos is reciprocally connected with V1, V2, and MT in cortexCitation26 and receives subcortical visual input from the SC,Citation27 all of which express VGLUT1 mRNA at varying levels. These differential inputs could give rise to the varied distribution of VGLUT1 in PI.
Superior colliculus (SC)
The SC of galagos has been divided into seven layers based on histologic and connectional differences.Citation24 The superficial layers of the SC primarily process visual information, while the intermediate and deep layers regulate multisensory integration and brainstem motor functions. The laminar orga-nization of the SC in CO and Nissl preparations in galagos () has been characterized previously.Citation20,Citation24 Low magnification images of the layers of the SC are shown in .
Figure 3 Coronal sections through the superior colliculus stained for (A) CO, (B) Nissl, (C and E) VGLUT1 protein, and (D and F) VGLUT1 mRNA. The stratum zonale or zonal layer (SZ) is a thin band that runs across the dorsal surface of the SC; immediately below is the stratum griseum superficiale or superficial gray layer (SGS) that is divided into upper and lower sublayers (uSGS and ISGS respectively); the stratum opticum or optic layer (SO) lies below the SGS and separates the superficial layers from the intermediate layers; below the SO lies the stratum griseum intermediale or intermediate gray layer (SGI), which is divided into three sublayers (SGla, SGlb, and SGlc form dorsal to ventral); the stratum album intermediale or intermediate white layer (SAI) lies below the SGI and separates the intermediate layers from the deep layers; below the SAI lies the stratum griseum profundum or deep gray layer (SGP) and lastly; ventral to the SGP lies the stratum album profundum or deep white layer (SAP), which borders the periaqueductal gray.
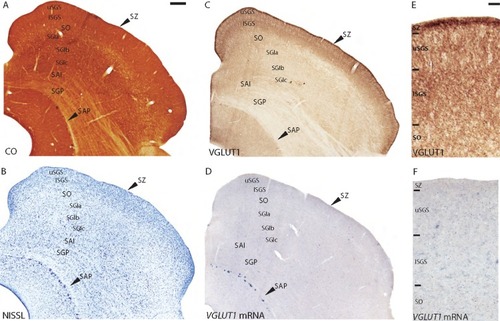
All layers of the SC only weakly expressed VGLUT1 mRNA (), and comparative cell counts between Nissl and VGLUT1 stained sections showed that VGLUT1 was confined to a small percentage of cells in each layer. The zonal layer (SZ) showed weak expression of VGLUT1 mRNA, with only a few stained cells scattered within the layer. However, both layers of the superficial gray layer (SGS) showed dense distributions of small cells stained lightly for VGLUT1 mRNA. The upper SGS (uSGS) projects to the interlaminar zones of the LGN, which showed dense labeling of VGLUT1 protein, while the lower SGS (lSGS) projected to PI,Citation27 which showed variable VGLUT1 distribution. The discrepancy in these expression patterns suggests that tectogeniculate and tectopulvinar projections likely use other glutamate transporters for glutamatergic transmission, and VGLUT1 expression in the SGS reflects intrinsic connections in this layer. The optic layer (SO) showed a sparse distribution of medium and large cells stained lightly for VGLUT1 mRNA, also likely reflecting intrinsic connections because this layer is primarily a fiber tract through the SC. The deep layers of the SC had scattered distributions of medium and large cells stained weakly for VGLUT1 mRNA that could represent relay projections or intrinsic connections in this multisensory area. Laminar boundaries within the SC were not readily apparent in sections stained for VGLUT1 mRNA, but slight differences in cell size and density allowed us to differentiate the superficial layers (). However, the deep layers had largely homogeneous distributions of VGLUT1, preventing us from discerning anatomic boundaries. A few large cells along the edge of the deep white layer (SAP) stained darkly for VGLUT1 mRNA but these cells are likely mesencephalic trigeminal neurons, and correspond to cells that stain strongly for Nissl and CO in this region. Overall, VGLUT1 mRNA was widely distributed across the galago SC, but at weaker levels compared with expression in the LGN and pulvinar.
VGLUT1 protein was also widely distributed in the galago SC (). Overall, the superficial layers showed much stronger VGLUT1 ir than the deep layers of the colliculus. The SZ appeared as a thin, dark band of dense VGLUT1 ir across the dorsal surface of the SC. The SGS also showed strong VGLUT1 ir and could be anatomically segregated into sublayers based on VGLUT1 reactivity. The upper SGS could be subdivided into two layers of VGLUT1 reactivity; a dorsal band of moderate VGLUT1 ir followed by a thin ventral band of strong VGLUT1 ir. The lower SGS could be subdivided into three layers; a dorsal band of weaker VGLUT1 ir, followed by a thin, middle band of strong VGLUT1 ir, and a ventral band of moderate VGLUT1 ir (). Retinotectal projections primarily terminate in the SGS and SZ,Citation24 and strong VGLUT1 ir in these layers indicates that retinal ganglion cells use VGLUT1 for glutamatergic transmission to the SC. Additionally, visual cortical inputs to the superior colliculus from layer V of V1 and MT terminate diffusely across the SGS and upper SO,Citation28 and the strong VGLUT1 expression seen in layer V of both those areas likely contributes to the dense VGLUT1 ir in the superficial SC. The SO below the SGS showed moderate levels of VGLUT1 reactivity, most of which was confined to areas around the white matter tracts. VGLUT1 ir in this layer could reflect inputs from association visual areas such as the medial, dorsomedial, and posterior parietal cortex projections seen in owl monkeys,Citation29 although such connections have not yet been described in galagos. Lastly, the deep layers all showed weak, homogeneous VGLUT1 ir and could not be further differentiated based on staining reactivity. Overall, visual inputs from the retina and cortex to the superficial SC use VGLUT1 for glutamatergic transmission, but this neurotransmitter is largely unused by projections in the deeper layers of the SC.
VGLUT1 in cortex
V1 (area 17)
V1 in galagos is easily distinguished from neighboring cortical areas by its distinct lamination, densely myelinated band of Gennari, and strong reactivity for CO and other immune markers.Citation16 In CO preparations, V1 is characterized by a dense CO band in layer IV that decreases markedly at the V1/V2 border, as well as moderate CO reactivity in layers I and VI and weak reactivity in layers III and V ( and ). In Nissl preparations, V1 is characterized by dense populations of cells compared with other cortical areas, and distinct lamination due to varying densities of cells in each layer ( and ). The laminar subdivisions of V1 have been described previouslyCitation23,Citation30 according to Nissl preparations and are shown in and .
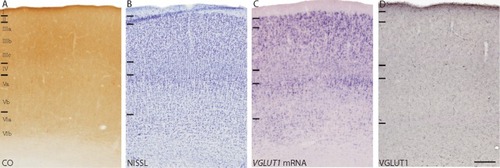
Figure 4 Low magnification images of coronal sections through V1 (area 17) and V2 (area 18) stained for (A) CO, (B) Nissl, (C) VGLUT1 mRNA, and (D) VGLUT1 protein. Arrowheads mark the V1/V2 border. Dorsal surface of cortex is up, ventral surface is down, hemispheric midline is to the left.
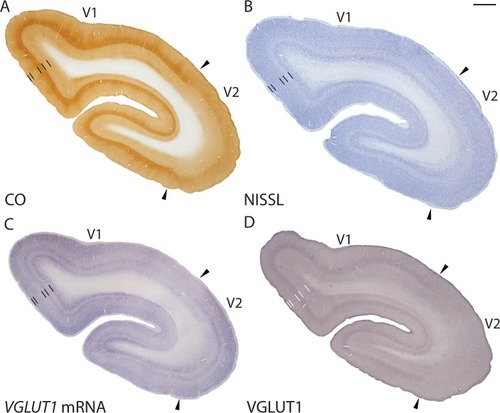
Figure 5 High magnification images of the laminar organization of V1 in sections stained for (A) CO, (B) Nissl, (C) VGLUT1 mRNA, and (D) VGLUT1 protein. Laminar divisions for layers I–VI are presented from dorsal to ventral in each image.
When stained for VGLUT1 mRNA, laminar boundaries in V1 were clearly visible due to differences in staining intensity between the layers ( and ). Comparative cell counts between Nissl-stained sections and VGLUT1-stained sections indicated that most of the cells in V1 expressed some level of VGLUT1 mRNA. Layer I lacked VGLUT1-positive cells and appeared as an unstained band across the surface of V1, consistent with its primary role as a recipient layer of pulvinar projections and feedback connections from other cortical areas.Citation30 Layer II appeared as a thin, dense band of medium and small cells that stained strongly for VGLUT1 mRNA, which are likely projections to other layers in VI and match the diffuse VGLUT1 ir across all the layers of V1. Layer III showed decreasing VGLUT1 expression from dorsal to ventral sublayers; layer IIIa consisted of medium and large cells that showed strong VGLUT1 expression, layer IIIb consisted of medium and small cells with moderate VGLUT1 expression, and layer IIIc consisted of mostly small cells with weaker VGLUT1 expression. Since layer III of V1 projects to MT and V2, varied VGLUT1 expression in this layer likely contributes to the differential levels of VGLUT1 ir seen in those areas. Layer IV showed a minor distribution of small cells that stained weakly for VGLUT1 mRNA scattered across the layer, consistent with its function as the primary recipient layer of thalamocortical projections. However, layer V showed significant VGLUT1 expression and could be divided into upper and lower layers, defined as Va and Vb respectively. Layer Va consisted of a dense distribution of large cells that stained strongly for VGLUT1 mRNA, while layer Vb was composed of small cells that stained moderately for VGLUT1 mRNA. Known projections of layer V in galagos include PL, PI, and the SGS of the SC, and all three areas show varied VGLUT1 ir. Lastly, layer VI could also be subdivided into upper and lower layers based on staining intensity, termed VIa and VIb, respectively. Layer VIa primarily consisted of large cells stained strongly for VGLUT1 mRNA while layer VIb was composed of medium cells and small cells with more moderate VGLUT1 expression. Layer VI in galagos projects to the layers and interlaminar zones of the LGN, and VGLUT1 expression here correlates well with the strong VGLUT1 ir in the LGN.
The distribution of VGLUT1 protein in cortex was robust across all areas, including V1 ( and ). Although laminar organization in V1 was less visible in sections stained for VGLUT1, slight differences in reactivity between the layers were still evident. Layer I showed stronger VGLUT1 ir than the rest of the layers, and thus could be distinguished as a thin, dark band across the surface of V1. Because most feedback connections to V1 terminate in layer I, strong VGLUT1 reactivity indicates that these projections heavily utilize VGLUT1 for glutamatergic transmission. Layers II, III, and V showed less staining for VGLUT1 and appeared as lighter bands through this region. Layer II does not receive dense projections from cortical or subcortical areas, layer III receives input from the K layers of the LGN, and layer V receives input from the pulvinar and V2. Weak VGLUT1 ir in these layers correlates with the weak VGLUT1 expression seen in those areas. Layer IV appeared as a dark band of VGLUT1 ir that terminated at the V1/V2 border, similar to the layer IV band in CO sections and consistent with the VGLUT1 expression in the LGN layers that project here. Layer VI, which receives some input from the LGN and MT, also showed stronger VGLUT1 ir than layers II, III and V and appeared as a thin, dark band along the internal edge of V1.
V2 (area 18)
V2 in galagos forms a long band along the length of the V1 border and extends about 3 mm across the cortical surface rostral to V1.Citation31 V2 is anatomically identified by its moderate level of myelination in comparison with V1. The CO stripes that characterize V2 of anthropoid primates are only weakly expressed in V2 of galagos.Citation32 In coronal sections stained for CO, V2 showed moderate staining in lower parts of layer IIIc and upper parts of layer IV, but showed weak staining in the other layers ( and ). In Nissl preparations, layer IV showed a denser cell distribution than the other layersCitation16 and layers I–IV showed stronger Nissl reactivity while layers V and VI showed weaker Nissl reactivity ( and ). Overall, the laminar organization of V2 was less well defined than that of V1, but slight differences in CO and Nissl reactivity allowed us to define laminar borders across the area.
Figure 6 High magnification images of the laminar organization of V2 in sections stained for (A) CO, (B) Nissl, (C) VGLUT1 mRNA, and (D) VGLUT1 protein. Laminar divisions for layers I–VI are presented from dorsal to ventral in each image.
When stained for VGLUT1 mRNA, V2 showed generally weaker levels of expression compared with V1. However, comparative cell counts between Nissl and VGLUT1 stained sections still indicated that the majority of cells in V2 expressed some level of VGLUT1 mRNA. Additionally, the laminar organization of V2 was far more evident in sections stained for VGLUT1 mRNA than comparative CO and Nissl sections (). Layer I lacked VGLUT1 expression entirely, while layer II showed an even distribution of medium and small cells that stained moderately for VGLUT1 mRNA. Layer III showed differential VGLUT1 expression in each sublayer. Layers IIIa and IIIc consisted of variably sized cells with weaker VGLUT1 expression, while layer IIIb consisted of medium and small cells with slightly stronger VGLUT1 expression. Layer IV showed a sparse distribution of small cells that stained weakly for VGLUT1 mRNA. Layer V showed a dense distribution of medium and small cells that stained strongly for VGLUT1 mRNA, although this is less apparent in . Finally, layer VI could be divided into two sub-layers based on VGLUT1 expression. The dorsal layer, VIa, consisted of scattered distributions of small cells that stained moderately for VGLUT1 mRNA while the ventral layer, VIb, showed a dense distribution of medium cells with strong VGLUT1 expression. Overall, the weak VGLUT1 expression seen in layers I and IV correlates with their role as recipient layers of thalamocortical projections from the pulvinar and cortical projections from V1 and MT.Citation30 Similarly, the varied VGLUT1 expression seen in layers II, III, V, and VI reflects the diverse projections of V2 to the pulvinar, V1, and MT, and correlates with VGLUT1 ir seen in these terminations.
VGLUT1 ir in V2 was strong but diffusely spread across the layers, and laminar patterns were less evident than those of V1 (). Layer I appeared as a thin, dark band across the surface of V2, fitting with its role as a recipient layer of pulvinar and MT projections. Layers IV and VI also showed slightly stronger VGLUT1 ir, which likely arises from afferent projections from the pulvinar and higher order visual areas, such as V3.Citation32 Layers II, III, and V showed weaker VGLUT1 ir and appeared as lighter bands in between layers I, IV, and VI. In galagos, layers II and III only receive diffuse projections from MT, and layer V does not receive extrinsic visual input,Citation30 so weak VGLUT1 ir here accurately reflects the afferent projections that terminate in these layers of V2.
Middle temporal area (MT)
MT in galagos lies on the cortical surface just above the caudal end of the lateral sulcus, and occupies an oval-shaped region about 18 mm2 on the temporal lobe.Citation28 MT is characterized by strong myelination, high CO reactivity in layers III and IV, weak CO reactivity in the other layers ( and ), and a large, diffuse band of small cells across layer IV in Nissl preparations ( and ). When stained for VGLUT1 mRNA and compared with Nissl sections, almost all of the cells in MT showed robust expression of VGLUT1 mRNA, but a distinct laminar pattern was still evident in this region ( and ). Layer I did not show any VGLUT1 expression. Layer II appeared as a thin, dense band of small cells with weak VGLUT1 expression. Layers IIIa and IIIb showed even distributions of medium and large cells with moderate VGLUT1 expression, while layer IIIc showed a denser distribution of medium and small cells with stronger VGLUT1 expression. Layer IV showed a sparse distribution of small cells that stained weakly for VGLUT1 mRNA. However, layer V could be split into two sublayers based on VGLUT1 expression; the dorsal sublayer, Va, showed a dense population of medium and large cells that stained strongly for VGLUT1 mRNA while the ventral sublayer, Vb, showed a more diffuse population of medium and large cells that stained weakly for VGLUT1 mRNA. Layer VI of MT appeared much thicker than layer VI of V1 and V2, consistent with its appearance in CO and Nissl sections, and could be divided into sublayers based on VGLUT1 expression. The dorsal third of layer VI showed a sparse distribution of medium cells with weaker VGLUT1 expression, although a number of individual cells stained strongly for VGLUT1 mRNA. The middle third of layer VI showed a dense distribution of medium and large cells that stained strongly for VGLUT1 mRNA, and the ventral third of layer VI consisted of an even distribution of medium cells stained moderately for VGLUT1 mRNA. Known projections of MT in galagos consist of efferent connections from layer III to PI, layer Vb to V2, and layer VIa to V1, PL, and PI.Citation28 VGLUT1 expression in the projecting layers of MT reflects the VGLUT1 ir seen in these areas and confirms that VGLUT1 is widely utilized in transmitting visual information between cortical and subcortical areas.
Figure 7 Low magnification images of coronal sections through the middle temporal area (MT) stained for (A) CO, (B) Nissl, (C) VGLUT1 mRNA, and (D) VGLUT1 protein. Dorsal is up, hemispheric midline is to the right.
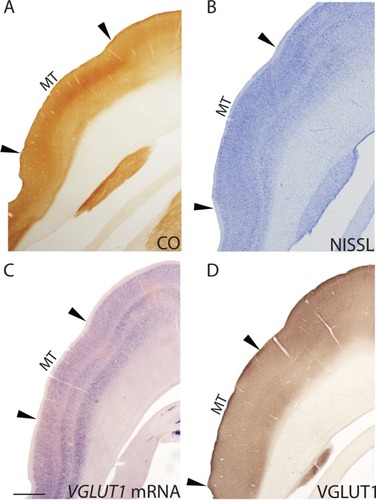
Figure 8 High magnification images of the laminar organization of middle temporal area in sections stained for (A) CO, (B) Nissl, (C) VGLUT1 mRNA, and (D) VGLUT1 protein. Laminar divisions for layers I–VI are presented from dorsal to ventral in each image.
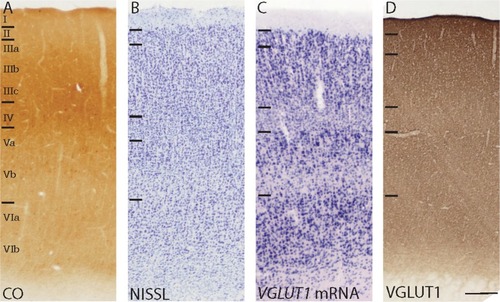
When stained for VGLUT1 protein, MT again showed weaker reactivity compared with adjacent areas of cortex, making laminar divisions less apparent, but each layer had slight differences in reactivity ( and ). Layer I appeared as a thin, dark band of strong VGLUT1 ir, while layer II appeared as a wider band of moderate VGLUT1 ir. Layer III showed a fairly homogeneous distribution of moderate VGLUT1 ir across all sublayers, only the lower half of layer IIIc had slightly weaker reactivity than the rest of layer III. Layer IV showed weak VGLUT1 ir and appeared as a lighter band between layers III and V. Layer V showed a thin band of slightly stronger VGLUT1 ir in the dorsal third of the layer followed by weaker VGLUT1 ir in the ventral two thirds of the layer. Similarly, layer VI showed slightly stronger VGLUT1 ir in the dorsal half and weaker VGLUT1 ir in the ventral half of the layer. In galagos, known projections to MT from the pulvinar, V1, and V2, all terminate in layer IV,Citation30 and the weak VGLUT1 ir seen here reflects the weak VGLUT1 expression seen in the projecting divisions of those areas. However, the strong VGLUT1 ir seen in layers I, II, and V likely reflects connections from higher order visual areasCitation32 and indicates that VGLUT1 is more utilized in higher order visual projections to MT and less utilized in primary visual input from the thalamus, V1, and V2.
Discussion
The primary aims of the present study were to characterize the distribution of VGLUT1 mRNA and protein across the visual system of galagos, identify novel anatomic features of visual structures revealed by VGLUT1 distributions, and compare VGLUT1 distributions in galagos with known VGLUT1 distributions in rodents. We find that VGLUT1 mRNA and protein expression varied distinctly between visual subcortical and cortical areas (), but their expression patterns are largely consistent with the known projections between and within these regions (shown in and ). VGLUT1 mRNA expression revealed novel laminar characteristics of V1, V2, and MT, while VGLUT1 protein expression identified subdivisions within the superficial layers of the SC. Finally, we find that, contrary to most rodent studies of VGLUT1 distributions, VGLUT1 is widely expressed in both subcortical and cortical areas, and may be involved in subcortical and thalamocortical projections as well as inter-cortical and corticothalamic circuits.
Figure 9 Cortical and subcortical visual connections of the (A) lateral geniculate nucleus, (B) pulvinar complex, and (C) superior colliculus. Shading intensity reflects levels of expression for both VGLUT1 mRNA and protein. Summarized from the literature.Citation16,Citation17,Citation20–Citation31,Citation34–Citation36,Citation41–Citation43
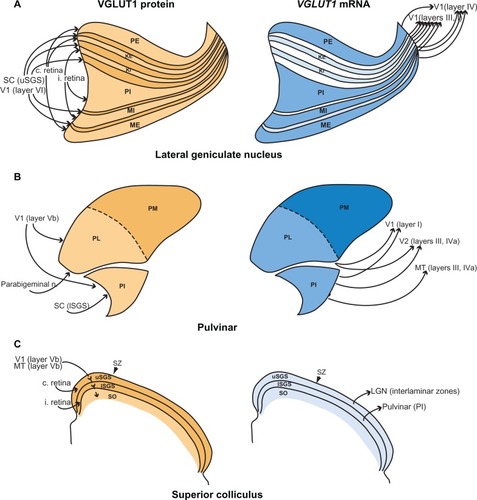
Figure 10 Visual connections of V1, V2, and MT in prosimian galagos. Shading intensity reflects levels of expression for both VGLUT1 mRNA and protein. Brodmann’s divisions listed in gray on the right side of each layer for V1. Summarized from the literature.Citation16,Citation18–Citation20,Citation22,Citation23,Citation25–Citation34,Citation36,Citation37,Citation40–Citation43
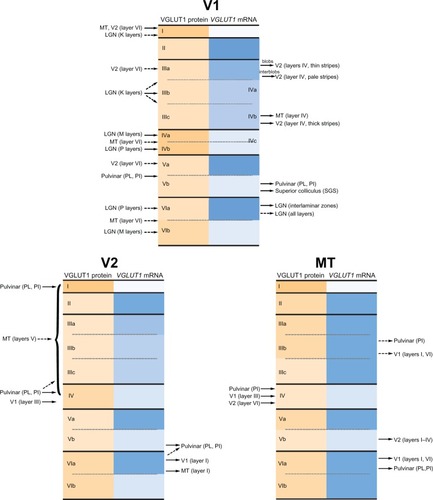
Table 2 Summary of VGLUT1 mRNA and protein expression in the galago visual system
VGLUT1 distributions in the visual system of galagos
Lateral geniculate nucleus (LGN)
The LGN is a central structure in the visual system of galagos because it is a primary recipient of visual input from the retina as well as the primary relay of visual information to cortexCitation30,Citation34 (). Retinal input to the LGN layers is topographically organized and segregated; the external layers receive contralateral retinal input while the internal layers receive ipsilateral retinal input. When relaying information to cortex, the M layers project to layer IVa of V1 while the P layers project to layer IVb. The K layers, as well as some cells in the interlaminar zones, project to all sublayers of layer III (centered on IIIb) and parts of layer I. Both the K layers and the interlaminar zones receive projections from the superficial gray layer of the SC,Citation27 and all LGN layers and interlaminar zones receive feedback projections from layer IVa of V1.Citation23,Citation30 Overall, VGLUT1 mRNA and protein distributions in the LGN correlate well with the known afferent and efferent projections of this nucleus. Previous work has shown that VGLUT2, another isoform in the VGLUT family, is strongly utilized in retinogeniculate and geniculocortical projections in galagos as well.Citation17 Thus, both VGLUT1 and VGLUT2 appear to be involved in this circuit and likely regulate different modes of glutamatergic transmission within these projections.Citation2,Citation5,Citation9
Pulvinar
The galago pulvinar is a complex nucleus that is densely connected with a number of visual and nonvisual areasCitation25 (). PM is reciprocally connected with multiple areas in frontal and parietal cortex that are not predominantly visual, so it is not examined in great detail in this discussion. PL and PI receive projections from layer Vb of V1 and send projections to layer I of V1, as well as layers III and IV of V2. PI sends an additional projection to layers III and IV of MT.Citation26,Citation30 Subcortical connections of the pulvinar complex include projections from the parabigeminal nucleus to PLCitation35 and projections from the lower SGS of the SC to PI.Citation36
Moderate VGLUT1 expression in afferent projections from V1, the SC, and the parabigeminal nucleus (not shown) to PL and PI confirm that VGLUT1 is utilized to a lesser extent in these subcortical and corticothalamic visual projections. Efferent projections with weak VGLUT1 expression from PL and PI to V1, V2 and MT also illustrate the same finding. The faint VGLUT1 expression in PL and PI could simply reflect intrinsic connections within these divisions, as opposed to projections outside of the pulvinar complex. Previous studies of VGLUT2 in the pulvinar of galagos showed that VGLUT2 mRNA is strongly expressed in PL and PM, and correlates with strong VGLUT2 ir in the corresponding projection layers of cortex,Citation17 suggesting that PL and PI preferentially use VGLUT2 over VGLUT1 in efferent projections to cortex. Tectopulvinar projections from the SC to PI have previously been shown to utilize VGLUT2 as well,Citation17 suggesting that afferent subcortical projections to the pulvinar also use VGLUT1 to a limited extent.
In contrast with the lateral and inferior divisions, the strong VGLUT1 expression and VGLUT1 ir seen in PM reflects its dense interconnectivity with frontal and parietal cortical areas, and suggests that VGLUT1 is preferentially used in circuits that process higher order information, as opposed to circuits that relay sensory input. However, examination of similar corticothalamic circuits in association areas would be necessary to justify this conclusion. Overall, PL and PI in galagos do not rely on VGLUT1 for thalamocortical or corticothalamic projections, while PM relies heavily on VGLUT1 for both thalamocortical and corticothalamic projections.
Superior colliculus
The SC in galagos is an intricate multisensory structure that integrates multiple modes of sensory input to influence motor behavior.Citation24 Visual processing in the SC is largely restricted to the superficial layers (). The upper superficial gray receives contralateral retinal input while the lower superficial gray receives ipsilateral retinal input. The upper superficial gray then sends projections to the K layers and interlaminar zones of the LGN while the lower superficial gray sends projections to PI. Feedback connections to the superior colliculus in galagos have not been studied in great detail, but previous work has shown that layer Vb of V1 and MT both project to the SGS and upper SO.Citation23,Citation28 Studies in squirrel monkeys and owl monkeysCitation29 showed that V2, as well as the medial, dorsomedial, and posterior parietal visual areas, all project to the SC and terminate primarily in the SGS and SO, thus it is possible that galagos have similar feedback connections as well. Overall, we find that VGLUT1 in the SC is primarily confined to afferent cortical projections to the SC and less utilized in efferent projections from the SC to the pulvinar and LGN. Previous work in galagos showed that VGLUT2 is predominantly used in tectogeniculate and tectopulvinar projections,Citation17 which accounts for the weak expression of VGLUT1 in the efferent visual connections of the SC.
The banded pattern of VGLUT1 ir seen in the superficial layers of the SC is a novel finding in galagos and could reflect differential inputs to the colliculus from retinal and cortical projections. The wide dorsal band of moderate VGLUT1 ir in the upper SGS likely reflects retinotectal projections from the contralateral retina, while the dorsal band of weaker VGLUT1 ir in the lower SGS likely reflects retinotectal projections from the ipsilateral retina. This is consistent with previous studies that show strong contralateral retinal projections to the upper SGS and more diffuse retinal projections to the lower SGS in galagos.Citation30 The wide ventral band of moderate VGLUT1 ir in the lower SGS likely arises from diffuse corticotectal projections that terminate across the SGS and SO. The thin, dark bands of VGLUT1 ir in the upper and lower superficial gray could reflect concentrations of corticotectal terminations or, less likely, retinotectal terminations in these layers; their relative depth from the surface of the SC places them closer to the average depth of corticotectal terminations from V1 and MT.Citation30 In owl monkeys, V1 projections to the SC terminate more dorsally in the SGS while MT projections terminate more ventrally.Citation29 If similar patterns of terminations exist in galagos, the dorsal band of concentrated VGLUT1 ir could arise from strong VGLUT1 expression in layer V of V1 while the ventral band of VGLUT1 ir could arise from similarly strong VGLUT1 expression in layer V of MT. Alternatively, the banded pattern seen in VGLUT1 sections may reveal the presence of a third sublayer between the retinotectal projections in galagos, although a third superficial gray layer has not been described in other species.
V1 (area 17)
V1 in galagos is a large area, approximately 200 mm2, which occupies the caudal half of the occipital lobe.Citation31 It is the primary recipient of visual information from subcortical structures, and has a distinct pattern of lamination that corresponds to its afferent and efferent projections (). Thalamic inputs to V1 originate in the pulvinar and LGN; PL and PI both project to layer I of V1.Citation23 From the LGN, the M layers project primarily to layer IVa of V1 with some collateral projections to the lower half of layer VI. The P layers project primarily to layer IVb with collateral projections to the upper half of layer VI, and the K layers project to the blob compartments in layer III with collateral projections to layer I.Citation23 V1 sends feedback projections to a number of subcortical regions in the thalamus, midbrain, and pons. Cells in the lower half of layer V in V1 project to the lower SGS and upper SO in the superior colliculus, as well as PL and PI. Cells in the upper half of layer VI of V1 project primarily to the interlaminar zones of the LGN, and secondarily to the LGN layers themselves.Citation23,Citation33
The major cortical projections of V1 in galagos are to V2 and MT. V1 projections to these areas arise through two major pathways.Citation23 First, neurons in layer IIIc of V1 project to layer IV of MT and to layer IV of V2. Second, neurons in the blob and interblob compartments of layer IIIa in V1 project differentially to compartments in layer IV of V2 that are likely homologous to the bands of V2 seen in other primate species. Feedback connections to V1 from V2 and MT terminate primarily in layer I with collateral projections to layers II, IVb, V, and VI. From V2, neurons originating in layer VI and (less significantly) layer IIIa terminate primarily in layer I, and secondarily in layer IIIa and Va. Similarly, neurons originating in layer VI and IIIa of MT terminate in layer I of V1 with collateral projections to layer IVb and VI.Citation33 Patterns of VGLUT1 mRNA and protein expression in V1 correlate well with their known connections and complement previous studies of VGLUT2 distribution in V1 as well.Citation16 Overall, VGLUT1 expression in the afferent and efferent projections of V1 indicates that this transport protein is heavily utilized in glutamatergic transmission of visual information.
The subdivision of layer V in V1 is a novel finding in galagos and has only been previously identified anatomically in tarsiersCitation38 and macaques.Citation39 However, connectional studies in galagos have identified separate projections from upper and lower halves of layer V to other layers in V1,Citation40 and similar studies in macaques have identified separate divisions of layer V as well. In macaques, the upper half of layer V is defined as Va and the lower half is defined as Vb; layer Va primarily consists of interneurons that project to other layers in V1 while layer Vb consists of relay cells that project outside of V1.Citation39 Thus, differential levels of VGLUT1 expression in layers Va and Vb of galagos could be an anatomic marker of the different projections that arise from these two divisions, and likely separates intrinsic and extrinsic connections of V1. Because connectional differences appear in both the strepsirrhine and haplorrhine suborders of primates, it is likely that these two sublayers of layer V are a common trait in primates that arose from a common ancestor. It is expected that future studies on VGLUT1 expression in other primates will identify similar divisions in layer V as well.
V2 (area 18)
V2 in galagos shares many anatomic and connectional traits with V2 in simian primates, and appears to serve a similar functional role.Citation31,Citation32,Citation41 V2 receives subcortical projections from PL and PI, which terminate primarily in layer IV and, to a lesser extent, in layer ICitation42 (). V2 also projects back to both PL and PI, and efferent connections to both divisions arise from layers V and VI. In cortex, V2 is densely connected with V1 and MT, and also has reciprocal connections with other parts of visual cortex, such as the medial, dorsomedial, dorsolateral, and ventral posterior parietal areas.Citation41 While the laminar organization of V2 connections has not been studied extensively in galagos, previous studies show that projections from V1 to V2 terminate primarily in layer IV,Citation33 while MT projections to V2 are spread across layers I–IV.Citation28 In return, layer VI of V2 projects back to layer I of V1 and MT.Citation28,Citation30 VGLUT1 distributions in V2 appear consistent with the afferent and efferent projections of this area and indicate that VGLUT1 is well utilized in higher order processing of visual information.
A similar subdivision of layer V into Va and Vb based on VGLUT1 expression is apparent in V2. This division has not been noted in anatomic or functional studies of V2 in other primates but this is more likely due to the paucity of research on the laminar organization of V2 rather than the existence of a novel subdivision in galagos alone. Given the conclusions on layer V of V1, it is likely that subdivisions of layer V in V2 also reflect differential projections of layer V to intrinsic and extrinsic areas, as well as differential levels of glutamatergic transmission. Hopefully, further studies of VGLUT1 expression in the visual system of primate species will identify similar subdivisions in other primates.
Middle temporal area (MT)
MT is a common visual area in all primate species,Citation43 and is involved in the processing of motion information in visual stimuli. In galagos, MT receives subcortical projections from PI,Citation26 which terminate primarily in layer III with some collaterals to layer IV, and send subcortical feedback to PL and PI, which likely arises in layer VI.Citation29 Cortically, layer IV of MT also receives dense projections from layer III of V1 and, based on studies in other primates,Citation44 likely receives projections from layer III of V2. Feedback connections from MT to V1 arise primarily in layer VI and secondarily in layer III, and terminate in layers I and VI of V1.Citation28,Citation45 Similar connections from MT to V2 arise in layer V of MT and terminate diffusely across layers I–IV of V2.Citation28 Overall, VGLUT1 mRNA and protein expression in MT reflects these known projections to and from this area. Further laminar-specific connections of MT in galagos are unknown,Citation30 but based on the diversity of VGLUT1 mRNA and protein expression patterns in this area, it is certain that laminar subdivisions identified by these techniques reveal additional afferent and efferent projections in MT, as well as differential levels of glutamatergic transmission in this area. Further anatomic and connectional studies will aid in understanding the exact nature of these projections.
Comparisons with rodents
Previous studies of VGLUT1 expression in the visual system of rodents have noted that VGLUT1 mRNA is expressed at low levels in the dorsal LGN, and the lateral posterior complex (the rodent equivalent of the pulvinar complex), and not expressed in the SC.Citation9,Citation11,Citation46 In the cortex, VGLUT1 mRNA is strongly expressed in all areas. VGLUT1 protein is similarly strongly expressed across the cortex, but moderately expressed in the lateral posterior nucleus and weakly expressed in the SC and LGN. Following these patterns, it appears that VGLUT1 is primarily utilized in corticothalamic projections and intrinsic connections in the cortex. Our results showed that VGLUT1 mRNA is moderately expressed in all visual subcortical nuclei, indicating that VGLUT1 is utilized to a greater extent in the subcortical projections of primates than those of rodents. Correspondingly, VGLUT1 immunoreactivity was also strong in the subcortical visual nuclei, indicating that efferent projections to these areas in primates also utilize VGLUT1 to a greater extent than similar projections in rodents. While VGLUT1 expression does still appear to be employed more in intercortical and corticothalamic projections than subcortical or thalamocortical projections in galagos, which is consistent with rodent studies, the greater overall expression of VGLUT1 in the visual subcortical nuclei of galagos suggests a more widespread use of VGLUT1 for glutamatergic transmission in primates. While the significance of increased VGLUT1 expression in primates is still unclear, further studies on the comparative distributions of VGLUT1 and VGLUT2 may provide insight on the differential use of glutamate by these two transporters in excitatory transmission.
Acknowledgments
We thank Laura Trice for assistance with tissue processing and histology, Dr Toru Takahata and the Yamamori laboratory (National Institute for Basic Biology, Japan) for supplying the VGLUT1 probe, Brett Begley and the Conti Core for assistance with Western blots, Dr Lisa de la Mothe for assistance with image processing, and Mary Fuertado for assistance in animal care.
Disclosure
This research was funded by National Eye Institute grants T32 EY 007135 and P30 EY 08126 to the Vanderbilt Vision Research Center and EY 02686 to JHK, and a National Institutes of Health/National Institute on Deafness and other Communication Disorders grant R01 DC 04318 to TAH. The authors report no other conflicts of interest in this work.
References
- FremeauRTTroyerMDPahnerIThe expression of vesicular glutamate transporters defines two classes of excitatory synapseNeuron200131224726011502256
- FremeauRTVoglmaierSSealRPEdwardsRHVGLUTs define subsets of excitatory neurons and suggest novel roles for glutamateTrends Neurosci20042729810315102489
- BellocchioEEReimerRJFremeauRTEdwardsRHUptake of glutamate into synaptic vesicles by an inorganic phosphate transporterScience2000289548195796010938000
- AiharaYMashimaHOndaHMolecular cloning of a novel brain-type Na+-dependent inorganic phosphate cotransporterJ Neurochem20007462622262510820226
- SantosMSLiHVoglmaierSMSynaptic vesicle protein trafficking at the glutamate synapseNeuroscience2009158118920318472224
- GrasCHerzogEBellenchiGCA third vesicular glutamate transporter expressed by cholinergic and serotonergic neuronsJ Neurosci200222135442545112097496
- FremeauRTBurmanJQureshiTThe identification of vesicular glutamate transporter 3 suggests novel modes of signaling by glutamateProc Natl Acad Sci U S A200499221448814493
- VaroquiHSchaferMKZhuHWeiheEEricksonJDIdentification of the differentiation associated Na+/Pi transporter as a novel vesicular glutamate transporter expressed in a distinct set of glutamatergic synapsesJ Neurosci200222114215511756497
- HerzogEBellenchiGCGrasCThe existence of a second vesicular glutamate transporter specifies subpopulations of glutamatergic neuronsJ Neurosci200121RC18116
- TakamoriSRheeJSRosenmundCJahnRIdentification of a vesicular glutamate transporter that defines a glutamatergic phenotype in neuronsNature2000407680118919411001057
- Barroso-ChineaPCastleMAymerichMSExpression of the mRNAs encoding for the vesicular glutamate transporters 1 and 2 in the rat thalamusJ Comp Neurol2007501570371517299752
- KanekoTFujiyamaFHiokiHImmunohistochemical localization of candidates for vesicular glutamate transporters in the rat brainJ Comp Neurol20024441396211835181
- KanekoTFujiyamaFComplementary distribution of vesicular glutamate transporters in the central nervous systemNeurosci Res200242424325011985876
- HackettTADe La MotheLARegional and laminar distribution of the vesicular glutamate transporter VGluT2, in the macaque monkey auditory cortexJ Comp Neurol2009382106116
- HackettTATakahataTBalaramPVGLUT1 and VGLUT2 mRNA expression in the primate auditory pathwayHear Res20112741–212914121111036
- WongPKaasJHArchitectonic subdivisions of neocortex in the galago (Otolemur garnetti)Anat Rec2010293610331069
- BalaramPTakahataTKaasJHVGLUT2 mRNA and protein expression in the visual thalamus and midbrain of prosimian galagosEye and Brain20113111
- KaasJHEvolution of the neocortexCurr Biol20061621R910R91417084684
- Wong-RileyMChanges in the visual system of monocularly sutured or enucleated cats demonstrable with cytochrome oxidase histochemistryBrain Res197917111128223730
- KaasJHHuertaMFWeberJTPatterns of retinal terminations and laminar organization of the lateral geniculate nucleus of primatesJ Comp Neurol19781823517554102662
- McDonaldCTMcGuinnessERAllmanJMLaminar organization of acetylcholinesterase and cytochrome oxidase in the lateral geniculate nucleus of prosimiansNeuroscience1993544109111018393538
- JohnsonJKCasagrandeVADistribution of calcium-binding proteins within the parallel visual pathways of a primate (Galago crassicaudatus)J Comp Neurol199535622382607629317
- CasagrandeVAKaasJHThe afferent, intrinsic, and efferent connections of primary visual cortex in primatesCereb Cortex199410201259
- MayPJThe mammalian superior colliculus: Laminar structure and connectionsProg Brain Res200615132137816221594
- StepniewskaIThe pulvinar complexKaasJHCollinsCEThe Primate Visual SystemBoca Raton, FLCRC Press2004
- WongPCollinsCEBaldwinMKLCortical connections of the visual pulvinar complex in prosimian galagos (Otolemur garnetti)J Comp Neurol20095171449351119795374
- RaczkowskiDDiamondITCells of origin of several efferent pathways from the superior colliculus in Galago senegalensisBrain Res1978146235135777177
- WallJTSymondsLLKaasJHCortical and subcortical projections of the middle temporal area (MT) and adjacent cortex in galagosJ Comp Neurol198221121932147174890
- GrahamJLinCSKaasJHSubcortical projections of six visual cortical areas in the owl monkey, Aotus trivirgatusJ Comp Neurol19791873557580114555
- WellerREKaasJHThe organization of the visual system in galago: Comparisons with monkeysHainesDEThe Lesser Bushbaby (Galago) as an Animal Model: Selected TopicsBoca Raton, FLCRC Press1982
- RosaMGPCasagrandeVAPreussTKaasJHVisual field representation of striate and prestriate cortices of a prosimian primate (Galago garnetti)J Neurophysiol1997776319332179212268
- LyonDCKaasJHConnectional evidence for dorsal and ventral V2 and other extrastriate areas in the prosimian primateBrain Behav Evol200259311412912119531
- RocklandKSThe organization of feedback connections from area V2(18) to V1(17)PetersAJonesEGCerebral Cortex, Volume 10: Primary Visual Cortex in PrimatesNew York, NYPlenum Press1994
- CasagrandeVADeBruynEJThe galago visual system: Aspects of normal organization and developmental plasticityHainesDEThe Lesser Bushbaby (Galago) as an Animal Model: Selected TopicsBoca Raton, FLCRC Press1982
- DiamondITFitzpatrickDConleyMA projection from the parabigeminal nucleus to the pulvinar nucleus in GalagoJ Comp Neurol199231633753821374436
- GlendenningKKHallJADiamondITHallWCThe pulvinar nucleus of Galago senegalensisJ Comp Neurol1975161341945850331
- TiggesJTiggesMDistribution of retinofugal and corticofugal axon terminals in the superior colliculus of squirrel monkeyInvest Ophthalmol Vis Sci19812021491587461921
- CollinsCEHendricksonAKaasJHOverview of the visual system of a tarsiusAnat Rec2005287110131025
- LundJSBootheRGInterlaminar connections and pyramidal neuron organization in the visual cortex, area 17, of the Macaque monkeyJ Comp Neurol19751593305334
- LachicaEABeckPDCasagrandeVAIntrinsic connections of layer III of striate cortex in squirrel monkey and bush baby: Correlations with patterns of cytochrome oxidaseJ Comp Neurol199332921631878384222
- CollinsCEStepniewskaIKaasJHTopographic patterns of V2 cortical connections in a prosimian primate (Galago garnetti)J Comp Neurol2001431215516711169997
- RaczkowskiDDiamondITCortical connections of the pulvinar nucleus in GalagoJ Comp Neurol198019311407430424
- KrubitzerLAKaasJHCortical connections of MT in four species of primates: Areal, modular, and retinotopic patternsVis Neurosci1990521652042278944
- AndersonJCMartinKACConnection from cortical area V2 to MT in macaque monkeyJ Comp Neurol20024431567011793347
- SymondsLLKaasJHConnections of striate cortex in the prosimian, Galago senegalensisJ Comp Neurol19781813447512
- MinelliAEdwardsRHManzoniTContiFPostnatal development of the glutamate vesicular transporter VGLUT1 in rat cerebral cortexDev Brain Res2003140230931412586437