Abstract
Purpose
To demonstrate the utility of a retinal imaging technique using spectral domain optical coherence tomography (SD-OCT) for creating a B-scan layer-by-layer analysis to aid in the differential diagnosis of various retinal dots, spots, and other white lesions.
Design
Review.
Methods
A retrospective review of imaging studies performed with SD-OCT (Topcon, 3DOCT-2000, Oakland, NJ) at SUNY State College of Optometry.
Results
B-scan layer-by-layer analysis and unique SD-OCT reflectivity patterns of the following retinal white lesions are reviewed in the order of their retinal layer localization: myelinated nerve fiber layer, cotton wool spot, exudates, edema residues, drusen, fundus albipunctatus, Stargardt disease, Bietti crystalline dystrophy, punctate inner choroidopathy (PIC), presumed ocular histoplasmosis syndrome (POHS), post-photocoagulation chorioretinal scarring, and osseous choristoma.
Conclusion
The reviewed images demonstrate the utility of SD-OCT in the identification of the unique characteristics of the presented retinal pathologies. SD-OCT is ideal for retinal layer localization of lesions, thus enhancing the differential diagnosis of retinal dots, spots, and other white lesions. Even though true pathognomonic patterns are rare, highly suggestive findings of certain retinal abnormalities often facilitate immediate recognition and diagnosis.
Introduction
Optical coherence tomography (OCT) has revolutionized our approach to retinal disease identification and diagnosis. It is a noninvasive imaging procedure of ocular structures that employs nonionizing optical radiation.Citation1,Citation2 Recent work in the field of ophthalmic OCT has demonstrated that spectral or Fourier detection methods (SD-OCT) enable OCT imaging with significantly improved speed, resolution, and sensitivity, as opposed to time domain OCT (TD-OCT).Citation3–Citation6 SD-OCT is capable of obtaining 27,000–40,000 A-scans/second with an axial resolution of 3.5–6 µm,Citation1,Citation7 as opposed to an acquisition speed of 400 A-scans/second, as in TD-OCT.Citation2 Thus, SD-OCT imaging results in considerable improvement in image acquisition speed and resolution, minimizing the well-known limitations of TD-OCT, such as limited retinal nerve fiber layer (RNFL) resolution, operator error, and increased motion artifacts.Citation1,Citation2 The unique capability of SD-OCT technology is to provide a layer-by-layer analysis of the retina with a resolution highly superior to contact lens fundus ophthalmoscopy and/or fundus photography. Clinically detectable drusen by ophthalmoscopy, for example, is 30 µm8 and resolution of fundus photography is 25 µm,Citation9 whereas axial resolution of SD-OCT has been reported to be 3.5–6 µm.Citation1,Citation7 The high sensitivity of this instrument provides entirely new imaging capabilities and, therefore, has significant impact on diagnosis and decision making.
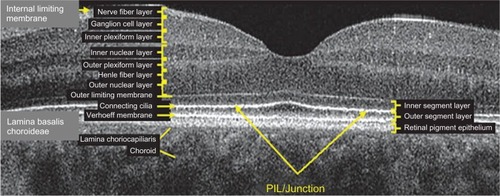
SD-OCT is often referred to in literature as “optical biopsy method” due to its extraordinary ability to provide information on ocular subsurface structures with retinal layer-by-layer analysis, otherwise obtainable only by histology.Citation3 The interface between different retinal layers is determined by changes in reflective properties between the tissues.Citation1 One of the most important new SD-OCT developments secondary to the higher resolution is the recognition and clinical importance of the photoreceptor integrity line (PIL),Citation10 also referred to as the IS/OS line. PIL represents the junction between the inner (IS) and outer (OS) segments of the photoreceptors (). Even though it is barely visible on histological sections, PIL is highly reflective with SD-OCT imaging. Recent histological studies have shown that the second hyper-reflective outer retinal OCT band, currently attributed to IS/OS junction, is likely due to mitochondria packing geometry and the organelle’s high refractive index (1.4).Citation11 Costa et al suggested that the inner layer, which is identical to the PIL reported in this study, could not be visualized with OCT imaging due to either a missing or disrupted PIL in the eyes of patients with outer retinal disorders.Citation12 Moreover, studies have shown that the integrity of the PIL is associated with visual function.Citation13,Citation14 Shin et al have recently reported that the length of a disrupted PIL on SD-OCT in patients with retinal vein occlusion is closely associated, if not predictive, of visual outcome.Citation14 High reflectivity and integrity of the PIL has been found to be independent of age and low scan sensitivities.Citation10 In normal eyes, PIL is as visible as the retinal pigment epithelium (RPE). If the PIL disappears while the RPE is still visible, it is likely that the PIL is abnormal in this region of the retina.
Figure 1 Layer-by-layer B-scan SD-OCT display of normal retina.
The current uses of SD-OCT are extensive and include retinal nerve fibre layer (RNFL) analysis, vitreomacular interface evaluation, and macular abnormalities. This study will explore SD-OCT characteristics of some common retinal and choroidal pathologies that present as white lesions: myelinated nerve fiber layer, cotton wool spot, exudates, edema residues, drusen, fundus albipunctatus, Stargardt disease, Bietti crystalline dystrophy, punctate inner choroidopathy (PIC), presumed ocular histoplasmosis syndrome (POHS), post-photocoagulation chorioretinal scarring, and osseous choristoma. In this study, the above retinal white dots, spots, and other lesions are categorized based on the retinal layer where they are thought to be found. The pathologies that affect the inner retina are myelinated nerve fiber layer and cotton wool spot. Retinal lesions that are typically localized to the outer retina are exudates and edema residues. Retinal pigment epithelium (RPE) abnormalities are further subdivided into sub-RPE deposits such as in drusen and fundus albipunctatus and RPE migration and/or atrophy cases such as in Stargardt disease, Bietti crystalline dystrophy, PIC, POHS, and post-photocoagulation chorioretinal scarring. In this study, B-scan analysis of retinal layers and unique SD-OCT reflectivity patterns of the white deposits in each of the above conditions are presented, stressing the importance of SD-OCT imaging, and the evaluation of PIL and RPE integrity in the differential diagnosis.
Methods
This study presents a retrospective review of imaging studies performed with SD-OCT (Topcon, 3DOCT-2000, Oakland, NJ) at the SUNY State College of Optometry. The B-scan image of the PIC case included in this study was taken with Spectralis OCT (Heidelberg Engineering, Carlsbad, CA).
Results
Inner retinal lesions
Myelinated retinal nerve fiber layer (MRNF)
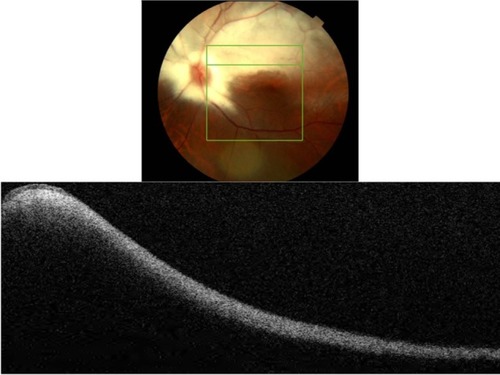
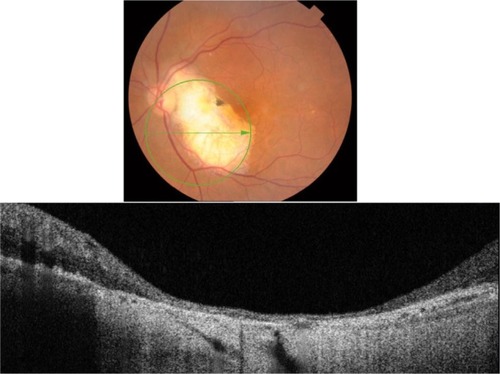
MRNF is reported to be present in approximately 1% of the population. Histological studies show the presence of oligodendrocyte-like glial cells and the surrounding myelination that is thought to be due to developmental anomaly or acquired insult.Citation15 Generally, during embryogenesis the process of myelination should stop at the level of the lamina cribrosa due to the dense aggregation of astrocytes that acts as a barrier.Citation15 Abnormal migration of oligodendrocyte-like cells into the retina results in MRNF formation and is thought to happen either prior to the development of the barrier function of lamina cribrosa or due to the abnormal dislocation of the glial cells as a result of a temporary loss of the barrier function of the lamina cribrosa.Citation15 The condition is usually asymptomatic; however, wide-spread myelination is associated with increased degree of axial myopia and hypoplastic disc in the affected eye.Citation15 Usually no treatment is indicated unless neovascularization or vitreous hemorrhage complications arise.Citation15 Clinically, MRNF appears as white or gray-white striated patches with feathery edges (). Myelination can be localized to the vascular arcades, be contiguous with the disc, or be separate from it. The size depends on the severity of developmental anomaly ranging from small 1–2DD (1500–3000 µm) to large, extending into the posterior pole and mid-periphery.
Figure 2 Fundus photograph (top) showing MRNF; the B-scan line on the fundus photograph has the same width as the B-scan SD-OCT image (bottom); SD-OCT image demonstrates thickened RNFL due to MRNF, thickness of which increases closer to the optic nerve head.
B-scan SD-OCT reflectivity pattern
shows hyper-reflective thickened RNFL. The increased thickness of the RNFL completely blocks the view of underlying structures. The increase in thickness of MRNF closer to the disc, the part of retina where RNFL is the thickest, should be noted.
Cotton wool spots (CWS)
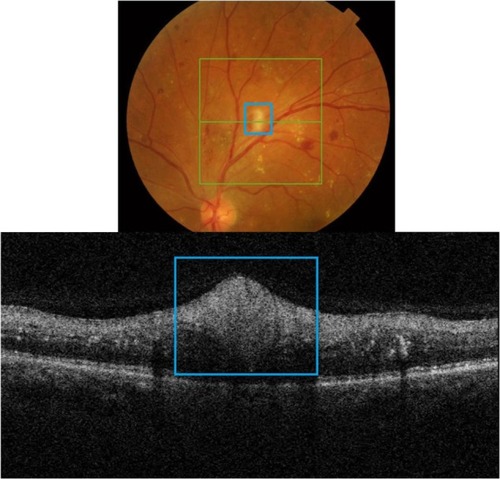
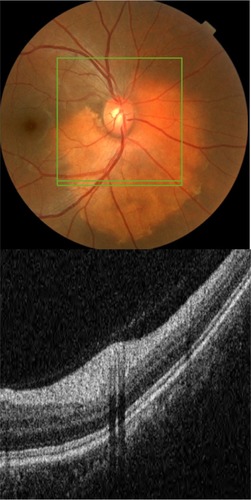
CWSs develop secondary to focal ischemia associated with occlusion of precapillary arterial flow.Citation16–Citation19 Blood flow abnormality, rather than a simple infarct is thought to cause an ischemic event.Citation19 There are numerous retinal vascular and systemic diseases associated with formation of cotton wool spots.Citation16–Citation18 There can be an ischemic etiology, embolic, infectious, tractional, traumatic, or simply idiopathic.Citation16 CWSs are comprised of swollen ganglion cell axons that expand as much as 10-fold (to some 5–15 µm in diameter) due to focal ischemic events.Citation19 Light microscopy studies have revealed the presence of cytoid bodies within a swollen axon.Citation16–Citation19 Cytoid bodies form due to the accumulation of intracytoplasmic organelles that were interrupted in their normal axoplasmic flow.Citation16–Citation18 Clinically, CWSs appear as slightly elevated white or yellow-white lesions with cloud-like or fluffy borders ().Citation16–Citation18 CWSs are typically localized to nerve fiber layer and develop at the border of large ischemic areas. The typical size of CWSs is <0.25 DD (<400 µm). They usually resolve within 5–12 weeks, but may persist for 1–2 years in diabetic patients.Citation17,Citation18
Figure 3 Fundus photograph (top) showing CWS (blue rectangle) in the left eye of a patient with diabetic retinopathy; the B-scan line on the fundus photograph has the same width as the B-scan SD-OCT image (bottom); SD-OCT image demonstrates thickened RNFL in CWS (blue rectangle).
B-scan SD-OCT reflectivity pattern
shows a hyper-reflective thickened area within the RNFL that appears as a nodular shape rather than continuously thickened RNFL. The retinal layers underneath the CWS are “masked” by the thickened nerve fibers.
Outer retinal lesions
Hard exudates
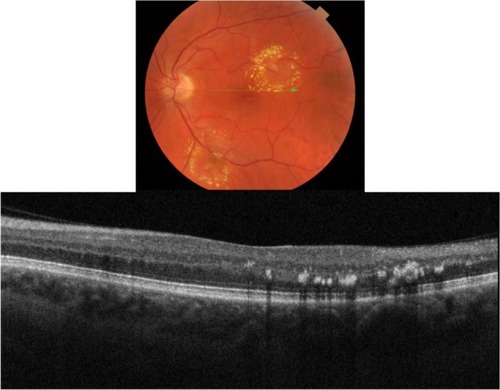
There are numerous retinal vascular diseases associated with hard exudates, including diabetic retinopathy, hypertensive retinopathy, retinal venous obstruction, retinal arterial macroaneurysm, radiation retinopathy, Coat’s disease, and capillary hemangioma.Citation20 Exudates are frequently associated with choroidal neovascular membrane (CNVM) formation in the wet form of age-related macular degeneration (ARMD). The pathophysiology of exudates is described by chronic localized leakage of plasma as a result of vasodilation.Citation20 This causes a deposition of lipid, which can be visualized clinically as waxy white-yellow lesions with distinct margins (). Exudates are mainly composed of lipoprotein and lipid-filled macrophages. The deposition is thought to occur in the outer plexiform layer (OPL) of the retina. The size of exudates is usually small, ranging between 15–55 µm, with those smaller than 25 µm invisible to ophthalmoscopy and fundus photography.Citation20 The lipid deposits typically develop at the junction of normal and edematous retina, arranging themselves as clumps and rings, which are commonly termed a circinate ring in diabetic retinopathy and a macular star in hypertensive retinopathy. It generally takes months to years for exudates to reabsorb.Citation20
Figure 4 Fundus photograph (top) showing a circinate ring of exudates in the left eye of a patient with macroaneurysm; the B-scan line on the fundus photograph has the same width as the B-scan SD-OCT image (bottom); SD-OCT image demonstrates exudate deposits at the level of outer plexiform layer (OPL).
B-scan SD-OCT reflectivity pattern
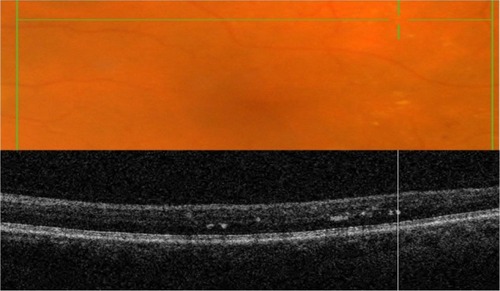
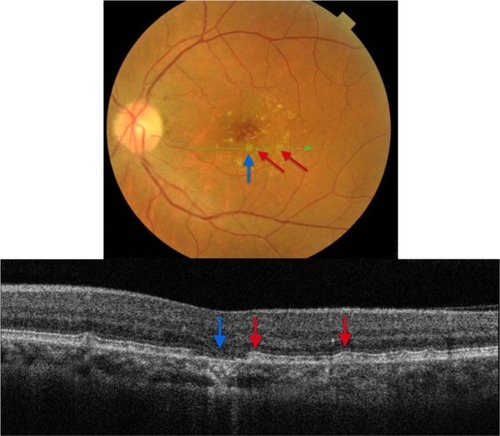
Our SD-OCT images of patients with exudates confirm the location of the deposits in and around OPL retinal layer (). Deposits present as hyper-reflective minute dots at the level of OPL. One hundred percent of the time the differential diagnosis between drusen and exudates can be made by layer localization of the deposits in question (). shows fundus photography (top) and its corresponding SD-OCT image (bottom) demonstrating a B-scan through the two different types of deposit: exudates (blue square) and drusen (red arrow).
Figure 5 Fundus photograph (right) showing two different types of deposit: exudates (blue rectangle) and drusen (red arrow) in the left eye of a patient with wet ARMD; the B-scan line on the fundus photograph has the same width as the B-scan SD-OCT image (left).
illustrates the example of superior resolution of SD-OCT in comparison to fundus photography. Nearly all of the hard exudates in this horizontal section are invisible to ophthalmoscopy but easily detected with SD-OCT. By reviewing all 128 horizontal sections in the 6 × 6 mm box, 405 exudates were detected with an SD-OCT; whereas only 20 were visualized with ophthalmoscopy, a 20-fold sensitivity improvement.
Figure 6 Cross-section of a scanned fundus image (top); the B-scan line on the fundus photograph has the same width as the B-scan SD-OCT image (bottom).
Subretinal deposits/edema residues/retinal precipitates
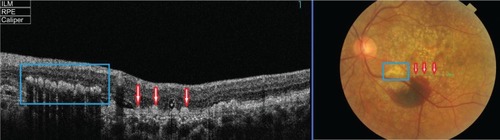
Edema residues, also referred to as subretinal deposits or retinal precipitates, are commonly seen in patients with central serous chorioretinopathy (CSC); 86% of patients with CSC were reported to present with white deposits in the area of retinal detachment.Citation9 Edema residues begin as minute yellowish deposits of granular material that are believed to contain photoreceptor outer segment debris.Citation9 Later these deposits coalesce together into dense confluent patches of amorphous extravascular fibrinous material.Citation9 Clinically, edema residues are similar in appearance to hard exudates (), presenting as waxy white-yellow lesions with distinct margins.Citation21 Deposits are variable in size ranging from small (10–20 µm) to large (200–300 µm).Citation9 Generally, edema residues are located in front of the RPE layer and they are highly confined to the detached area of retina.Citation9
Figure 7 Fundus photograph of the left eye showing edema residues inside the area of CSC (enlarged).
B-scan SD-OCT reflectivity pattern
demonstrates edema residues that appear as hyper-reflective deposits (red arrows) within the area of retinal detachment. SD-OCT images confirm the location of sub-retinal deposits to the photoreceptor outer segment layer. These subretinal precipitates are virtually pathognomonic of CSC.
Figure 8 B-scan SD-OCT image demonstrating edema residues confined to the level of photoreceptor outer segment layer in CSC.
Retinal pigment epithelium (RPE) lesions
Sub-RPE deposits
Drusen
Drusen deposits are commonly associated with ARMD and dominant drusen. ARMD is known to be the leading cause of irreversible legal blindness in people over 60 years of age.Citation22 It is characterized by the progressive loss of central vision due to degeneration, dysfunction, and subsequent death of photoreceptor cells.Citation23 Drusen-induced RPE degeneration has been hypothesized to account for the loss of photoreceptor cells.Citation22,Citation23 The largest single component of drusen is lipid, mainly esterified and unesterified cholesterol and phosphatidylcholine.Citation24 There are also other components such as polysaccharides, glycosaminoglycans, and protein molecules that mediate proinflammatory and immune processes Citation22,Citation24 Cellular components within drusenoid deposits have been found to be RPE debris, lipofuscin, and melanin.Citation22 All types and sizes of drusen, including subclinical drusen smaller than 63 µm, have been reported to result in photoreceptor abnormalities, not affecting horizontal, amacrine, bipolar, and ganglion cells.Citation23
Three types of drusen have been recently described: hard, subretinal drusenoid deposits, and soft.Citation24 In this study, hard drusen will be further subdivided into cuticular and infiltrative based on the SD-OCT reflective characteristics. Clinically, hard drusen appears as multiple densely packed small yellow-white nodular deposits of lipid-rich material ( and ). Typically it is 50–75 µm in size. The location of the deposits distinguishes hard drusen from subretinal drusenoid deposits. Subretinal drusenoid deposits are similar in appearance to hard drusen and are similar in size (50–75 µm) (). However, in comparison to hard drusen, as Spaide and CurcioCitation24 reported, drusenoid-material is located above rather than below the RPE layer. Soft drusen can be distinguished more easily from the other types of drusen based on their larger size (63–1000 µm in diameter).Citation24 It appears as yellow-white, dome-shaped, lipid-rich deposits with softer borders (). Similar to the hard drusen, soft drusen deposits are located between the RPE and Bruch’s membrane.
Figure 9 Fundus photograph (top) showing hard cuticular drusen in the right eye of a patient with ARMD; the B-scan line on the fundus photograph has the same width as the B-scan SD-OCT image (bottom) which demonstrates the appearance of hard cuticular drusen.
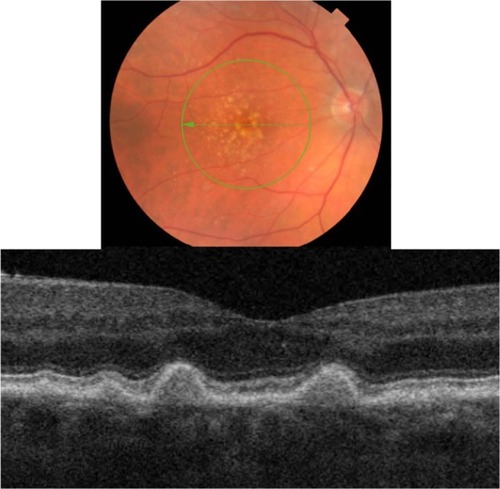
Figure 10 Fundus photograph (top) showing hard infiltrative drusen in the left eye of a patient with ARMD; the B-scan line on the fundus photograph has the same width as the B-scan SD-OCT image (bottom) which demonstrates the appearance of hard infiltrative drusen.
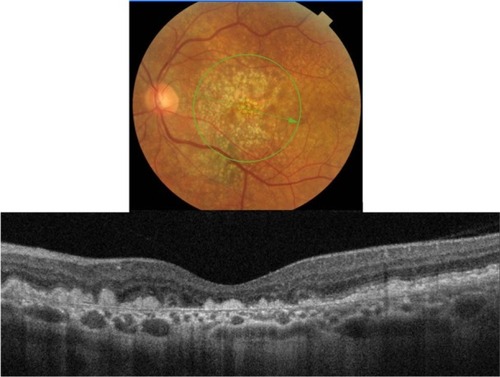
Figure 11 Fundus photograph (top) showing subretinal drusenoid deposits in the right eye of a patient with ARMD; the B-scan line on the fundus photograph has the same width as the B-scan SD-OCT image (bottom) which demonstrates the appearance of subretinal drusenoid deposits.
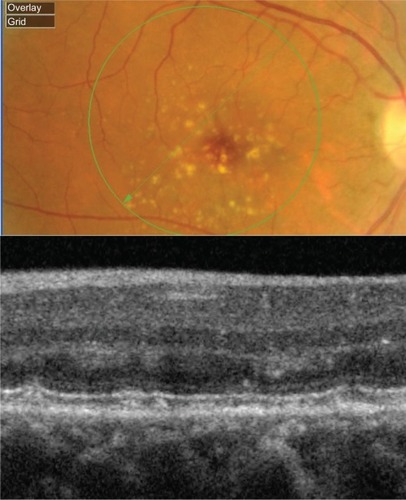
Figure 12 Fundus photograph (top) showing soft drusen in the left eye of a patient with ARMD; the B-scan line on the fundus photograph has the same width as the B-scan SD-OCT image (bottom) which demonstrates the appearance of soft drusen.
B-scan SD-OCT reflectivity pattern
Cuticular hard drusen appear as discrete dome-shaped elevations of RPE layer due to the deposits external to the RPE basement membrane and solid in appearance (). It can be clearly visualized with SD-OCT imaging that the RPE layer is intact and elevated with sub-RPE deposits beneath it. Elevations have about the same height-to-width ratio. Another important distinguishing feature of cuticular hard drusen is the presence of PIL that sits on top of the dome-shaped structures. Even though it is thinner than in unaffected parts of retina, the PIL is generally present and intact.
Infiltrative hard drusen, on the other hand, appear drastically different with SD-OCT (). Multiple discrete deposits infiltrate through the RPE and PIL with disruption of both layers.
Subretinal drusenoid deposits are conical in shape and have a more punctuate appearance. SD-OCT images show with great resolution the fact that deposits are localized between the RPE and the PIL layer (). PIL is intact and slightly elevated with an intact outer limiting membrane sitting on top of it. In contrast to hard drusen, however, the RPE layer is not elevated because the deposits are sitting on top of it, rather than underneath.
Soft drusen exhibit a classical appearance with sub-RPE deposits that result in a pronounced elevation of the RPE (). SD-OCT reveals elevated mounds or dome-shaped structures with less reflective material inside as compared with the solid-appearance of a hard drusen. Large elevated drusen are typically associated with a compromised PIL above the deposits, which can be clearly visualized with the SD-OCT B-scan. Another important feature of soft drusen is that in some cases it is possible to visualize Bruch’s membrane, which appears as a thin reflective layer that lies flat at the base of a soft drusen. Generally Bruch’s membrane is masked by the RPE shadow; however, when the RPE is compromised, it is possible to localize the presence of Bruch’s membrane.
Geographic atrophy
Analysis of fundus photography images of the right and left eyes of the patient who presented with subretinal drusenoid deposits revealed one area of deposits that appeared different from the rest (). SD-OCT imaging was done through the region of interest (marked by a blue arrow). As shows, B-scan reveals missing PIL and the external limiting membrane, along with the easily visualized Bruch’s membrane, the presentation consistent with geographic atrophy. Drusenoid deposits, marked by red arrows, surround the area of geographic atrophy.
Figure 13 The B-scan line on the fundus photograph (top) has the same width as the B-scan SD-OCT image (bottom) demonstrating one area of geographic atrophy (blue arrow) surrounded by multiple subretinal drusenoid deposits (red arrows).
Fundus albipunctatus (fundus albi)
Fundus albi (FA) is a rare form of congenital stationary night blindness (CSNB) characterized by minute white dots and a delayed course of dark adaptation.Citation25 The condition is stationary and nonprogressive.Citation25 A combination of FA and cone dystrophy (CD) has been reported in several studies.Citation27 CD and FA have been linked by a mutation in the 11-cis retinol dehydrogenase (RDH5) gene with autosomal recessive inheritance reported in at least 6 families.Citation25–Citation27 RDH5 is expressed predominantly in the RPE cells and plays a role in the visual cycle,Citation26,Citation27 which can explain the symptoms of night blindness. The composition of the white deposits is unknown, but they have been reported to be localized to the level of the RPE.Citation27
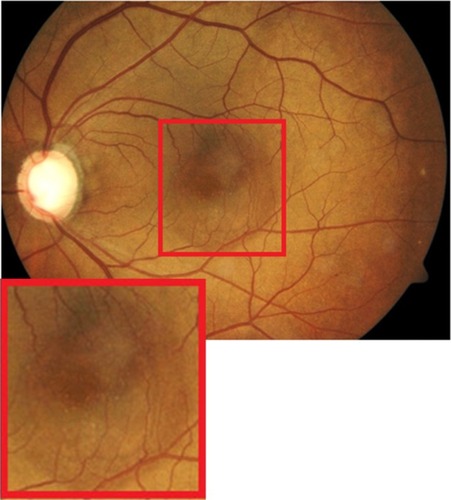
Clinically, FA presents as a large number of discrete monotonous subretinal white or pale-yellow deposits in the perimacular area and mid-periphery ( and ). The deposits are usually best visualized with a green-separation filter which localizes deposits to the retinal rather than the choroidal layer. The white dots usually fade slowly over decades.
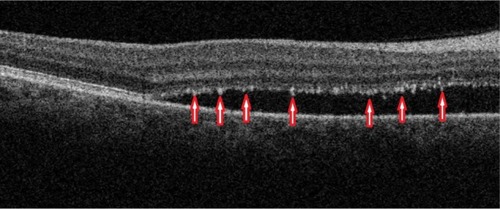
Figure 14 The B-scan line on the fundus photograph (top) has the same width as the B-scan SD-OCT image (bottom) demonstrating the appearance of white deposits (red arrows) in fundus albi.
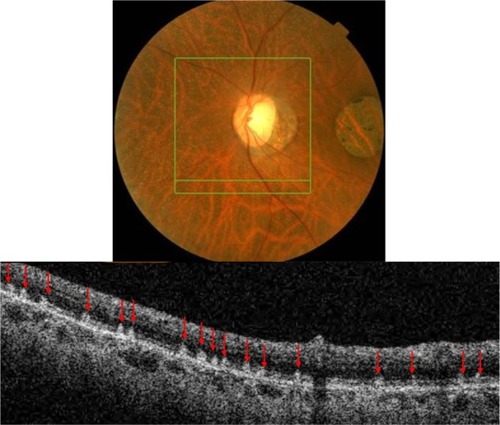
Figure 15 The B-scan line on the fundus photograph (top) has the same width as the B-scan SD-OCT image (bottom) demonstrating the appearance of early deposits in fundus albi (red arrow).
B-scan SD-OCT reflectivity pattern
SD-OCT imaging reveals numerous hyper-reflective dots (red arrows) larger than the thickness of the PIL that appear to straddle through the PIL, extending into the inner and outer photoreceptor layer (). SD-OCT shows with great precision their location anterior to the RPE. All retinal layers, including the RPE, PIL, and external limiting membrane are present and grossly intact, resulting in good visual acuity unless CD is present concomitant with FA.
shows SD-OCT image of a 6-year-old patient with FA. In comparison to the adult fundus shown in , early FA appears to start as subretinal deposits between the PIL and the RPE layers (red arrow). The typical straddling through the PIL and extending into the inner and outer photoreceptor layer is likely to be associated with the longstanding FA deposition.
RPE migration and RPE atrophy
Fundus flavimaculatus (FF)/Stargardt disease
Stargardt disease is the most common juvenile macular dystrophy, accounting for approximately 7% of all juvenile macular dystrophies.Citation28 It can present with or without white-yellow retinal deep lesions, that are called fundus flavimaculatus (FF). FF and Stargardt are variants of the same hereditary disease, sharing a similar genetic background.Citation28 They are both inherited as an autosomal recessive trait that is due to a mutation in the ABCA4 gene.Citation28 The composition of the deposits is presently unknown, and they exhibit variable patterns and shapes of hyper-reflective material.Citation28,Citation29 Clinically they appear as deep more-yellow-than-white ill-defined retinal lesions, commonly referred to as flecks in the literature.Citation28,Citation29 Even though they appear similar to drusen deposits, FF flecks are more likely to have fishtail, rather than round shapes (). Flecks can be localized in the perifoveal region or can be scattered throughout the posterior pole and mid-periphery.Citation28,Citation29
Figure 16 Fundus photograph (top) showing white FF flecks in the left eye of a patient with Stargardt disease; the B-scan line on the fundus photograph has the same width as the B-scan SD-OCT image (bottom) demonstrating areas of RPE migration (red arrows) and areas of RPE dropout (blue arrows).
B-scan SD-OCT reflectivity pattern
FF flecks appear very different from drusen deposits. RPE pigment migration (red arrows) to the inner retina is clearly observed (), leaving areas of RPE dropout (blue arrows) consistent with a yellow-white appearance clinically. Up to date, there are no histology reports available of the composition of FF flecks, likely due to the fact that they represent areas of RPE dropout.
Bietti crystalline dystrophy (BCD)
Bietti crystalline dystrophy is an autosomal recessive retinal dystrophy characterized by a triad of glistening intraretinal crystals, RPE atrophy and hypertrophy, which is also known as tapetoretinal degeneration and choroidal sclerosis.Citation30 Crystal deposits have been reported to be composed mainly of cholesterol or cholesterol ester with complex lipid inclusions.Citation31 Mutation in the CYP4V2 gene was found to be associated with BCD.Citation31 This gene codes for a protein involved in fatty acid metabolism.Citation31 According to the recent literature, BCD is associated with abnormally high levels of triglycerides and cholesterol storage in the body, though direct correlation to any specific systemic disease has not yet been established.Citation31
Clinically, BCD is characterized by the presence of minute crystal deposits scattered along the posterior pole and mid-periphery, retinitis pigmentosa-like pigment clumping, and atrophic appearing retina with easily visualized choroidal vasculature, which is also known as choroidal sclerosis (). The literature also reports the presence of yellowish crystals in multiple types of cells, including choroidal fibroblasts, corneal keratocytes, and conjunctival and skin fibroblasts. Anterior segment OCT reveals hyper-reflective crystal deposits within the cornea at the limbus ().
Figure 17 Anterior segment SD-OCT image demonstrating hyper-reflective crystals (red arrows) in the limbus area of the eye of a patient with Bietti crystalline dystrophy (BCD).
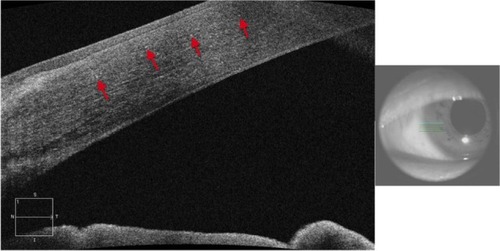
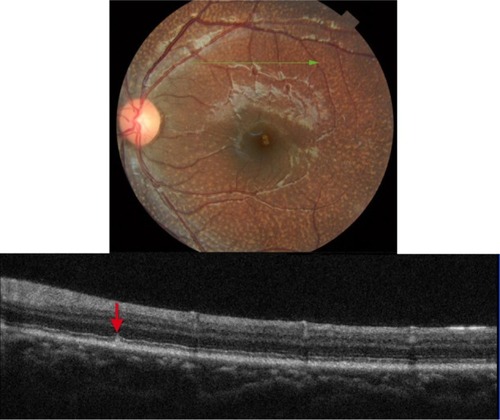
Figure 18 Fundus photograph (top) showing BCD triad, glistening crystal deposits, tapetoretinal degeneration and choroidal sclerosis, in the left eye of a patient with BCD; the B-scan line on the fundus photograph has the same width as the B-scan SD-OCT image (bottom) demonstrating the appearance of crystalline deposits and the absence of PIL and RPE layers.
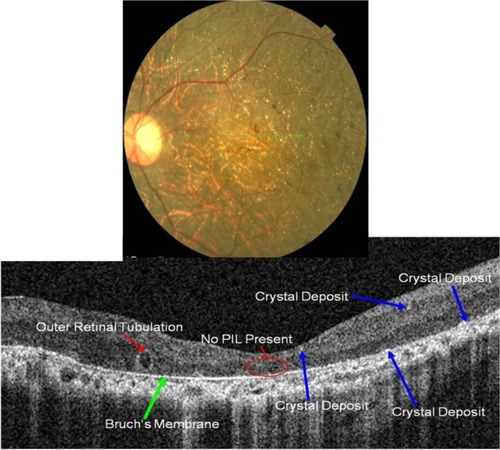
B-scan SD-OCT reflectivity pattern
Perhaps one of the most revealing characteristics of BCD is a complete absence of the PIL (). A thin Bruch’s layer can be easily visualized due to the extreme RPE thinning. Small highly-reflective dots are seen on the anterior surface of Bruch’s membrane with more subtle hyper-reflective dots scattered throughout inner retinal layers (blue arrows).
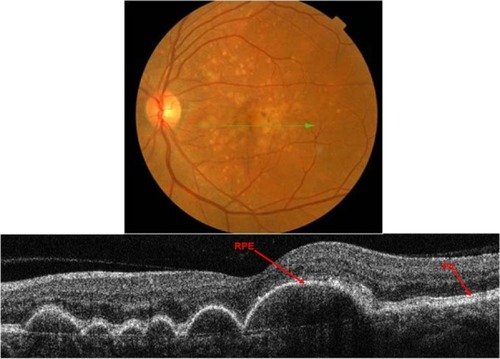
Punctate inner choroidopathy (PIC)
PIC is a part of the White Dot Syndromes family, which is a group of disorders characterized by multiple whitish inflammatory lesions located at the level of the outer retina and choroid.Citation32,Citation33 PIC normally affects young myopic women between the ages of 20 to 45 years of age. It presents as small multifocal well-circumscribed hypopigmented and pigmented fibrotic scars often located in both eyes (). The color can be gray-white or yellow with a cuff of pigment at the level of the inner choroid and retinal pigment epithelium (RPE). It often resembles signs of ocular histoplasmosis (POHS) and unless an active vitritis is present, it is often difficult to distinguish between the two diseases. In this paper, we will show how SD-OCT imaging can be used to differentiate between the two entities. When active, PIC can be symptomatic with blurred vision up to 20/200 and complaints of photopsia.
Figure 19 Fundus photographs (top) showing white lesions in the right eye of a patient with PIC; the B-scan line on the fundus photograph (top-left) has the same width as the B-scan SD-OCT image (bottom) demonstrating missing retinal layers in the area of the lesion.
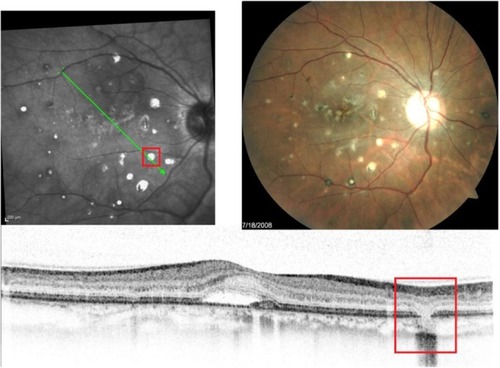
B-scan SD-OCT reflectivity pattern
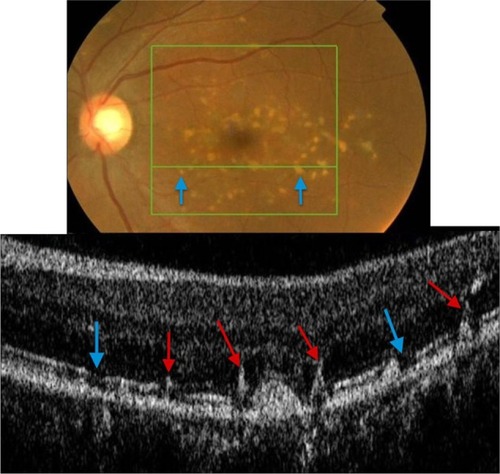
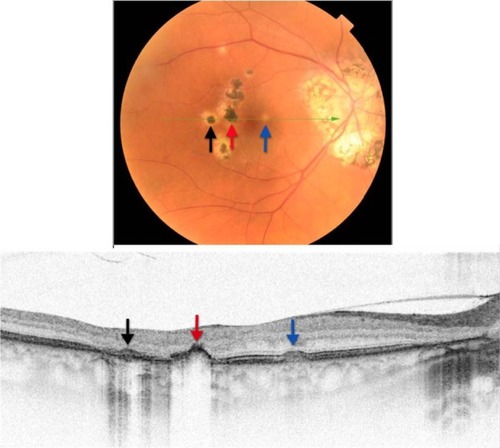
SD-OCT shows a complete loss of all retinal layers at the level of white lesions (). The RPE and PIL cannot be visualized, and even Bruch’s membrane and choriocapillaris are missing in the area of the defect. This finding is virtually pathognomonic of PIC. The SD-OCT image of POHS, on the other hand, differs significantly from PIC (), showing elevated rather than atrophic RPE and PIL layers. Going from left to right, the B-scan through the three different types of chorioretinal lesions in POHS show the area of pigment deposition surrounded by the area of RPE atrophy (black arrow), RPE migration (red arrow), and drusen-like apigmented pigment deposition (blue arrow).
Figure 20 Fundus photograph (top) showing hypo- and hyper-pigmented lesions in the right eye of a patient with POHS; the B-scan line on the fundus photograph has the same width as the B-scan SD-OCT image (bottom) demonstrating the three different types of lesions: the area of pigment deposition surrounded by the area of RPE atrophy (black arrow), RPE migration (red arrow) and drusen-like apigmented pigment deposition (blue arrow).
Chorioretinal scar
Factored into the differential diagnosis of white retinal lesions is the atrophic chorioretinal scar. This case presents a patient who underwent sectoral pan-retinal photocoagulation (PRP) argon laser treatment of the left eye secondary to a polyploidal neovascular membrane. B-scan SD-OCT imaging revealed severe chorioretinal atrophy that resulted in complete absence of all retinal layers, including the RPE, PIL, and external limiting membrane ().
Figure 21 The B-scan line on the fundus photograph (top) has the same width as the B-scan SD-OCT image (bottom) demonstrating the appearance of chorioretinal atrophy.
Osseous choristoma
Osseous choristoma is defined as a congenital tumor consisting of ectopic osseous tissue in the choroid.Citation34 It is more prevalent in Caucasians and is reported more frequently in women than men. It is composed of bony trabeculae with numerous osteocytes and occasional osteoclasts.Citation34 Fundoscopically, osseous choristoma appears yellowish-white to sometimes reddish in color ().Citation34 It can be elevated ranging from 0.5 to 2.00 mm elevation.Citation35 The size ranges from 1.5 × 2 DD to 9 × 15 DD.Citation35 It has been reported that RPE can show areas of depigmentation and areas of RPE clumping; whereas, retina overlying the tumor can show focal degeneration of outer segments.Citation34 Given the relatively benign and silent nature of the tumor, no treatment is usually recommended. However, argon laser treatment can be used if choroidal neovascularization develops.Citation34
Figure 22 The B-scan line on the fundus photograph (top) has the same width as the B-scan SD-OCT image (bottom) demonstrating the appearance of osseous choristoma.
B-scan SD-OCT reflectivity pattern
As shows, SD-OCT imaging of osseous choristoma reveals intact RPE, PIL, and external limiting membrane layers. Areas of thickened retina can be observed; however, no mass under the retina and no retinal atrophy is associated with osseous choristoma.
Conclusion
Retinal spots, dots, and other white lesions can often present a diagnostic challenge for clinicians. The aforementioned cases, summarized in , demonstrate the importance of SD-OCT in the identification of the unique B-scan SD-OCT reflectivity patterns of the presented retinal abnormalities. SD-OCT is an ideal diagnostic tool to localize various deposits to a specific retinal layer, thus enhancing the differential diagnosis of retinal white dots and spots. Knowing how to interpret images of this remarkable technology can provide significant insight into characteristic features of these conditions often facilitating immediate diagnosis.
Table 1 Summary of B-scan SD-OCT reflectivity patterns of the presented dots, spots and other white retinal lesions
Disclosure
The authors report no conflicts of interest in this work.
References
- ChenTCCenseBPierceMCSpectral domain optical coherence tomography: ultra-high speed, ultra-high resolution ophthalmic imagingArch Ophthalmol2005123121715172016344444
- AlamSZawadzkiRJChoiSClinical application of rapid serial fourier-domain optical coherence tomography for macular imagingOphthalmology200611381425143116766031
- PodoleanuAGOptical coherence tomographyBr J Radiol20057893597698816249597
- KimJSIshikawaHGabrieleMLRetinal nerve fiber layer thickness measurement comparability between time domain optical coherence tomography (OCT) and spectral domain OCTInvest Ophthalmol Vis Sci201051289690219737886
- XiPMeiKBräulerTZhouCRenQEvaluation of spectrometric parameters in spectral-domain optical coherence tomographyAppl Opt201150336637221263736
- WatanabeYItagakiTReal-time display on Fourier domain optical coherence tomography system using a graphics processing unitJ Biomed Opt200914606050620059237
- SrinivasanVJAdlerDCChenYUltrahigh-speed optical coherence tomography for three-dimensional and en face imaging of the retina and optic nerve headInvest Ophthalmol Vis Sci200849115103511018658089
- SarksSHArnoldJKKillingsworthMCSarksJPEarly drusen formation in the normal and aging eye and their relation to age related maculopathy; a clinicopathological studyBr J Ophthalmol199983335836810365048
- WangMSanderBla CourMLarsenMClinical characteristics of subretinal deposits in central serous chorioretinopathyActa Ophthalmol Scand200583669169616396646
- ShermanJYannuzziLAMadonnaRJNathSBababekovaYThe Photoreceptor Integrity Line: As Revealed by Spectral Domain OCTNew YorkLulu.com2008
- LittsKMessingerJSloanKSpaideRCurcioCSources of reflectivity in optical coherence tomography (OCT) of retina: candidates near the inner-outer segment (IS/OS) junctionAbstract 1322/A259.ARVO Conference522011Fort Lauderdale, FL Available at: http://www.abstract-sonline.com/plan/ViewAbstract.aspx?mID=2684&sKey=a9534887-8f0d-44c9-9838-df773b6c095b&cKey=7f02ab5d-342b-430f-8-dc1-4e2bc2114dbb&mKey=%7B6F224A2D-AF6A-4533-8BBB-6A8D7B26EDB3%7DAccessed September 16, 2011
- CostaRACalucciDSkafMOptical coherence tomography 3: automatic delineation of the outer neural retinal boundary and its influence on retinal thickness measurementsInvest Ophthalmol Vis Sci20044572399240615223823
- OtaMTsujikawaAMurakamiTAssociation between integrity of foveal photoreceptor layer and visual acuity in branch retinal vein occlusionBr J Ophthalmol200791121644164917504858
- ShinHJChungHKimHCAssociation between integrity of foveal photoreceptor layer and visual outcome in retinal vein occlusionActa Ophthalmol2011891e35e4021155986
- TarabishyABAlexandrouTJTraboulsiEISyndrome of myelinated retinal nerve fibers, myopia, and amblyopia: a reviewSurv Ophthalmol200752658859618029268
- ArroyoJGCotton-wool spots may challenge diagnosisReview of Opthalmology serial on the Internet42004 cited April 15, 2004 Available at: http://www.revophth.com/content/d/retinal_insider/i/1332/c/25556/Accessed April 10, 2011
- GomezMLMojanaFBartschDUFreemanWRImaging of long-term retinal damage after resolved cotton wool spotsOphthalmology2009116122407241419815278
- SchmidtDThe mystery of cotton-wool spots – a review of recent and historical descriptionsEur J Med Res20082413623126618558551
- McLeodDWhy cotton wool spots should not be regarded as retinal nerve fiber layer infarctsBr J Ophthalmol200589222923715665358
- KanskiJJClinical Ophthalmology: A Systematic Approach5th edPhiladelphia, PAButterworth Heinemann Elsevier2007
- WangMMunchICHaslerPWPrünteCLarsenMCentral serous chorioretinopathyActa Ophthalmol200886212614517662099
- UmedaSSuzukiMTOkamotoHMolecular composition of drusen and possible involvement of anti-retinal autoimmunity in two different forms of macular degeneration in cynomolgus monkey (Macaca fascicularis)FASEB J200519121683168516099945
- JohnsonPTLewisGPTalagaKCDrusen-associated degeneration in the retinaInvest Ophthalmol Vis Sci200344104481448814507896
- SpaideRFCurcioCADrusen characterization with multimodal imagingRetina20103091441145420924263
- HiroseEInoueYMorimuraHMutations in the 11-cis retinol dehydrogenase gene in Japanese patients with Fundus albipunctatusInvest Ophthalmol Vis Sci200041123933393511053296
- NakamuraMHottaYTanikawaATerasakiHMiyakeYA high association with cone dystrophy in Fundus albipunctatus caused by mutations of the RDH5 geneInvest Ophthalmol Vis Sci200041123925393211053295
- NiwaYKondoMUenoSNakamuraMTerasakiHMiyakeYCone and rod dysfunction in fundus albipunctatus with RDH5 mutation: an electrophysiological studyInvest Ophthalmol Vis Sci20054641480148515790919
- ErgunEHermannBWirtitschMAssessment of central visual function in Stargardt’s disease/fundus flavimaculatus with ultrahigh-resolution optical coherence tomographyInvest Ophthalmol Vis Sci200546131031615623790
- WirtitschMGErgunEHermannBUltrahigh resolution optical coherence tomography in macular dystrophyAm J Ophthalmol2005140697698316376639
- DrenserKSarrafDJainASmallKWCrystalline retinopathiesSurv Ophthalmol200651653554917134644
- LiAJiaoXMunierFLBietti crystalline corneoretinal dystrophy is caused by mutations in the novel gene CYP4V2Am J Hum Genet200474581782615042513
- EssexRWWongJFraser-BellSPunctate inner choroidopathy: clinical features and outcomesArch Ophthalmol2010128898298720696997
- QuillenDADavisJBGottliebJLThe white dot syndromesAm J Ophthalmol2004137353855015013878
- KimBHHendersonBAIntraocular choristomaSemin Ophthalmol200520422322916352493
- GassJDNew observations concerning choroidal osteomasInt Ophthalmol1979127184553048