
Abstract
Central nervous system dysfunction is an important cause of morbidity and mortality in patients with human immunodeficiency virus type 1 (HIV-1) infection and acquired immunodeficiency virus syndrome (AIDS). Patients with AIDS are usually affected by HIV-associated encephalitis (HIVE) with viral replication limited to cells of monocyte origin. To examine the molecular mechanisms underlying HIVE-induced dementia, the GSE4755 Affymetrix data were obtained from the Gene Expression Omnibus database and the differentially expressed genes (DEGs) between the samples from AIDS patients with and without apparent features of HIVE-induced dementia were identified. In addition, protein–protein interaction networks were constructed by mapping DEGs into protein–protein interaction data to identify the pathways that these DEGs are involved in. The results revealed that the expression of 1,528 DEGs is mainly involved in the immune response, regulation of cell proliferation, cellular response to inflammation, signal transduction, and viral replication cycle. Heat-shock protein alpha, class A member 1 (HSP90AA1), and fibronectin 1 were detected as hub nodes with degree values >130. In conclusion, the results indicate that HSP90A and fibronectin 1 play important roles in HIVE pathogenesis.
Introduction
Central nervous system dysfunction is an important cause of mortality and morbidity in patients with human immunodeficiency virus type 1 (HIV-1) infection and acquired immunodeficiency virus syndrome (AIDS).Citation1,Citation2 Mild neurocognitive disorder and motor dysfunction as outcomes of HIV-associated dementia (HAD) may develop in association with opportunistic infections, neoplasms, and cerebrovascular disease.Citation3,Citation4 Patients with HAD usually suffer from HIV-associated encephalitis (HIVE) with viral replication limited to cells of monocyte origin.Citation5
The mechanisms of brain injury in HIV-1 infection may be multiple. At the center of the HIVE pathology, brain inflammatory infiltration includes activation of microglia, perivascular or parenchymal monocytes, multinucleated giant cells, and lymphocytes.Citation6,Citation7 Furthermore, HIVE and HAD may be accompanied by significant loss of neurons and presynaptic terminals, formation of abnormal dendrites, followed by the altered expression of neuronal growth factors, proinflammatory chemokines, and cell death genes identified as possible mechanisms of brain injury.Citation7,Citation8
According to the current data, changes in gene expression occurring in the brains of AIDS patients may induce development of brain atrophy, mild gliosis, and impaired blood–brain barrier permeability along with alterations in neuronal HIV-1 chemokine co-receptors.Citation9,Citation10 In these cases, HIVE/HAD pathology exhibits remarkable gene expression profiles as a result of HIV-altered neuronal signal transduction and astrocyte function together with stimulated apoptosis through CXCR4 receptors, independent of CD4 binding.Citation11,Citation12
Rigorous laboratory investigations of HIV-1 infection conducted over the past two decades have identified various factors and genes involved in the pathogenesis of HIVE, including T-cell receptor-mediated signaling, subcellular trafficking, transcriptional regulation, and a variety of cellular metabolic pathways.Citation13 In particular, increasing evidence has demonstrated that different serological markers such as tumor necrosis factor alpha, monocyte chemo-attractant protein 1, interleukin-6, and high-sensitivity C-reactive and soluble CD14 proteins are responsible for the pathogenic progression of HAD, leading to severe metabolic alterations and accelerated senescence.Citation14 However, despite recent advances in the elucidation of the HIV-1 pathophysiology, the molecular mechanisms involved in HIVE-induced dementia remain poorly understood.
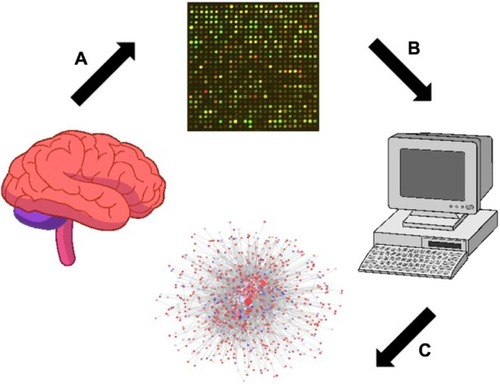
Therefore, in the present study, microarrays were utilized to identify the differentially expressed genes (DEGs) between the samples from AIDS patients with and without apparent features of HIVE-induced dementia according to the scheme depicted in . Gene ontology (GO) enrichment analysis was performed, and a protein–protein interaction (PPI) network was created by mapping the DEGs to the PPI data. The results provided from this investigation may facilitate a better understanding of the detailed molecular mechanisms underlying HIVE-induced dementia and thus assist in the selection of appropriate and effective treatment strategies for patients with neuro-AIDS.
Figure 1 Scheme of the brain tissue analysis from AIDS patients with and without apparent features of HIVE-induced dementia using the Affymetrix microarray platform.
Abbreviations: HIVE, HIV-associated encephalitis; DEGs, differentially expressed genes; PPI, protein-protein interaction.
Materials and methods
Affymetrix microarray data
The transcriptional profile of GSE4755 (Torres-Munoz JE, unpublished data, 2006) was obtained from the National Center of Biotechnology Information Gene Expression Omnibus (GEO) database,Citation15 which is based on the Affymetrix Human Genome U95 annotation data (chip hgu95) that was assembled using data from public repositories. In total, four specimens (n=4) were available based on the Agilent RNA 6000 Assay Platform. A00-44 and D03-046 samples correspond to AIDS patients with premortem histories of HIVE and dementia. DME01-1991 and DME02-0053 samples correspond to AIDS patients without premortem history of HIVE and dementia. HIVE status was confirmed by microscopic observation. RNA of HIV-positive patients was determined by a viral load quantification method using Gag-primers.
Data preprocessing
Probe cell intensity data (CEL files) (Affymetrix Inc., Santa Clara, CA, USA) were converted into expression values, and background correction was performed by the robust multiarray average algorithmCitation16 using the default settings within the Bioconductor environment.Citation17 Measurements of multiple probe sets obtained from the same genes were averaged.
Analysis of DEGs
For the GSE4755 data set, the LIMMA package (Linear Models for Microarray Data) of the Bioconductor softwareCitation17 was implemented to identify relevant DEGs between the two groups of AIDS patients.Citation18,Citation19 Only DEGs with a P-value less than 0.05 were selected for further analysis. All previous steps in Affymetrix data preprocessing and DEG analysis were achieved via execution of the in-house script in the R scripting language interface (Table S1).
GO and Kyoto Encyclopedia of Genes and Genomes pathway analysis
The Kyoto Encyclopedia of Genes and Genomes (KEGG) databaseCitation20,Citation21 contains the information on the networked molecules and genes. The database for annotation, visualization, and integrated discovery (DAVID) was used to analyze list of genes derived from high-throughput genomic experimentsCitation22 and to identify over-presented GO categories in biological processes with a P-value less than 0.05.
PPI network construction
To demonstrate the potential PPI correlations, all DEGs were mapped on the compiled data set of human interactome for the PPI network construction and microarray data enrichments analysis. The human interactome kindly provided by Dr C Laudanna from the Laboratory of Cell Trafficking and Signal Transduction (University of Verona, Verona, Italy) represents nonredundant, undirected, and no-loop physical protein– protein binary interaction data set in Cytoscape sif format comprising HGNC (HUGO Gene Nomenclature Committee)-curated protein IDs compiled from different sources. Next, a PPI network was constructed by the Cytoscape v2.8 software platformCitation23 based on the PPI correlations.
Molecular complex detection analysis
The molecular complex detection (MCODE) algorithm,Citation24 a well-known automated method to find highly interconnected subgraphs, detects densely connected regions in large PPI networks that may represent molecular complexes. In the present study, clustered subnetworks of highly intra-connected nodes (n>20) in the network were searched using a Cytoscape AllegroMCODE plug-in. Next, the identified subnetworks were used for functional enrichment analysis.
Results and discussion
Determination of DEGs
To obtain the DEGs between the different groups of AIDS patients with different race, age, and sex backgrounds, publicly available microarray data sets were retrieved from the GEO repository using the Agilent RNA 6000 Assay Microchip technology. Fresh frozen autopsied human brain samples were prepared as 0.8–1.0 cm3 fragments for microarray gene expression analysis from frontal cortex dissections, which were validated by quantitative real-time polymerase chain reaction (Torres-Munoz JE, unpublished data, 2006). Prior to DEG determination, the microarray raw data were tested for quality assessment purposes, comparing it to a synthetic array created by taking probe-wise medians. Quality problems are most apparent either from an MA-plot where the loess smoother oscillates a great deal or if the variability of the log fold change (M) values seems greater than those of other arrays in the data set.
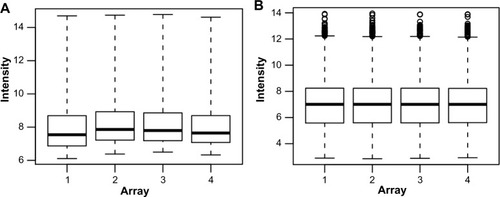
All analyzed microarrays revealed no distorted or aberrant loess lines on the MA-plots, which often indicate the absence of potential quality problems. The median and interquartile range curves appeared on each plot are close to the zero line representing good data quality (). Subsequently, data preprocessing was performed to eliminate the effect of background noise and to normalize and summarize expression values per each probe set of the database (). The samples have 1,528 overlapping genes with a P-value less than 0.05, and no distinct set of DEGs was detected through a screening of 12,625 genes identified in all samples of AIDS patients with and without HIVE-induced dementia.
Figure 2 MA-plots of Affymetrix microarrays (n=4) plotted with common pseudo-array reference and represented each gene with a dot for AIDS patients with (A and B) and without (C and D) HIVE-induced dementia.
Abbreviations: AIDS, acquired immunodeficiency virus syndrome; HIV, human immunodeficiency virus; HIVE, HIV-associated encephalitis; IQR, interquartile range.
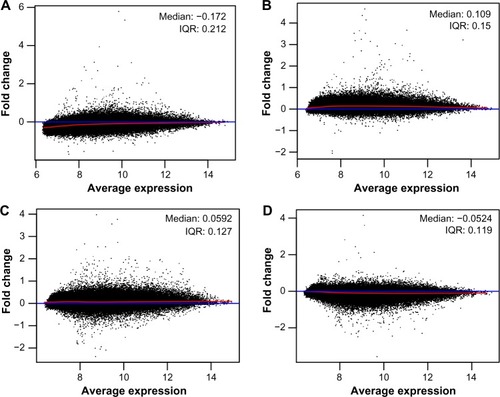
Figure 3 Box-plots of raw (A) and RMA-normalized (B) data from four replicate Affymetrix arrays.
Abbreviation: RMA, robust multiarray average.
GO enrichment analysis of DEGs
GEO analysis has become a commonly utilized approach for functional annotation of large-scale genomic data.Citation25 To investigate the functional changes in the pathological course of HIV-1 infection, the DEGs were mapped to the DAVID database. DAVID is one of the most popular tools in the field of high-throughput functional annotation software cited more than 2,000 publications.Citation26 This project provided three structural networks of defined terms to describe the gene product attributes: biological process, molecular function (MF), and cellular compartment (CC).
In the present investigation, the majority of the enriched genes were upregulated in the samples from AIDS patients with and without HIVE-induced dementia. The DEGs were most commonly associated with CC and MF, including plasma membrane/nonmembrane-bound organelle involvement and nucleotide/nucleoside binding (). To visualize the category relationships by “induced” graphs for the top GO:0005886, GO:0044459GO, and GO:0000166 terms with the highest counts of DEGs in the samples from AIDS patients, the biograph function and the getmatrix method from the MATLAB Bioinformatics Toolbox (MathWorks, Natick, MA, USA) were used. They return a square matrix of relationships between GO terms for the each GO object where the relations of GO CC or MF with cellular parts and metabolic processes are shown ().
Figure 4 “Induced” graphs of the enriched GO categories for GO:0005886 (A), GO:0044459GO (B), and GO:0000166 (C) terms with highest counts of DEGs in samples from AIDS patients with and without HIVE-induced dementia.
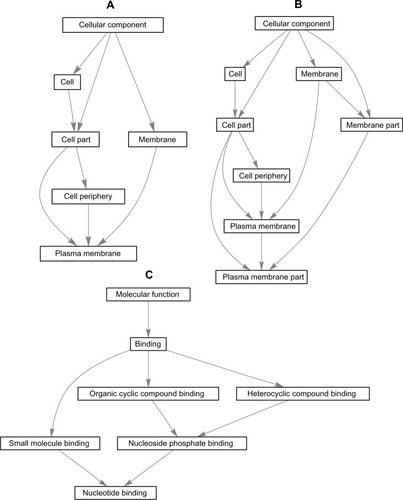
Table 1 Top ten significantly enriched GO terms with high counts of DEGs in samples from AIDS patients with and without HIVE-induced dementia
To gain further insights into the biological pathway changes, the online biological classification tool incorporated in the DAVID database was used.Citation22 The main goal of the pathway analysis was to identify the pathways that were significantly enriched in the pathological process represented in the brain samples of AIDS patients. Significant enrichment of those DEGs in multiple KEGG terms was observed. The most significantly enriched pathways for DEGs in samples of AIDS patients with and without HIVE-induced dementia were ErbB (erythroblastic leukemia viral oncogene) and MAPK (mitogen-activated protein kinase) signaling pathways with high numbers of genes especially involved in the latter pathway in particular. The GO terms were significantly overrepresented for DEG-related biological phenomena, such as nucleic acid and cellular metabolic processes. From the results of the KEGG pathway enrichment analysis, it is clear that the majority of enriched GO terms of DEGs from the samples of AIDS patients were correlated with cell signaling pathways, endocytosis-mediated, and cell–cell adhesion mechanisms (). Some pathways, such as neurotrophin signaling pathway and the pathways involved in colorectal cancer, suggested that neuronal death features of HIV-related brain damage and high prevalence of neoplastic tumors of the gastrointestinal tract are also present. The last finding is also consistent with various published data reporting an elevated risk and earlier age of onset of colonic neoplasia in the HIV/AIDS population.Citation27–Citation30
Table 2 Top ten enriched KEGG pathways of DEGs with low P-values in samples of AIDS patients with and without HIVE-induced dementia
Construction of PPI network
Network analysis has been shown to be a powerful tool to understand biological responses in health and disease.Citation31 In the PPI network, the nodes are proteins and the edges are functional interactions. To construct the PPI network and maximize the coverage of the genome, PPI data were obtained from the human interactome as an example of a genome-scale functional network, or “human reference network”. This reference interactome network represents nonredundant, undirected, and no-loop physical protein–protein binary interaction data set comprising 16,018 unique HGNC-curated protein IDs with 299,760 binary interactions compiled from different databases and literature. The network is generic, and the same regardless of the tissue, genotype, and pathologic state. To obtain correct and relevant PPIs, only DEGs related to AIDS patients were mapped on the reference network, and the rest was deleted. The new “local” network was further refined by removing duplicated edges and self-loops comprising only 949 nodes and 4,789 edges () to reveal highly expressed genes with minimal (P-value ≥1.33E−10) and maximal (P-value ≤0.006) P-values. The resulting PPI network was not weighted, since each PPI occurred only once. Since the resulting network was too large to provide more specific and detailed information, it proved necessary to divide the network into subnetworks, each of which represented protein subcomplexes or functional modules.
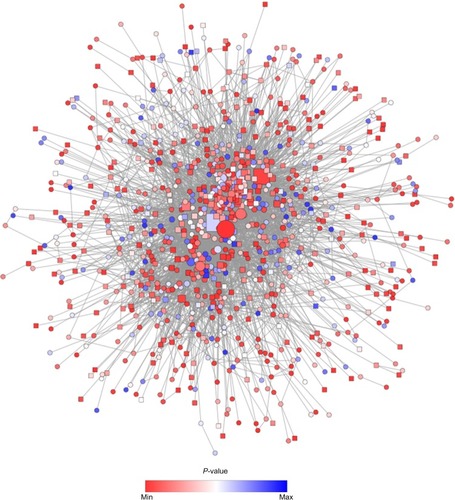
Figure 5 PPI network constructed from the list of DEGs on the basis of human interactome using spring embedded layout.
Abbreviations: PPI, protein–protein interaction; DEGs, differentially expressed genes; FC, fold change; min, minimum; max, maximum.
In order to achieve this, the new network was analyzed using the AllegroMCODE plug-in and implementing the MCODE algorithm with a k-core value of 2.0, node score cutoff of 0.2, maximum depth from the seed node of 100 and graphics-processing-unit-based parallelization to find clusters efficiently. The MCODE method performed a typical seed-growth-style-clustering algorithm, which ranks the subnetworks with clusters according to the average number of connections per protein in the complex as node score. A total of 22 subnetworks were found, among which six were detected with the intra-connection nodes >20 and node score >2.0 ( and ). All clustered subnetworks were varied in size containing a total of 166 proteins and 706 PPIs. The clusters were mutually inclusive indicating that nodes were shared between the individual clusters. In each subnetwork, the score was mainly determined by a node score cutoff value to define the number of nodes in a subnetwork. The functions of these subnetworks were primarily corresponded to immune response, regulation of cell proliferation and cellular response to inflammation.
Figure 6 Subnetworks identified from the local PPI network using unweighted force-directed layout.
Abbreviations: PPI, protein–protein interaction; DEGs, differentially expressed genes; FC, fold change.
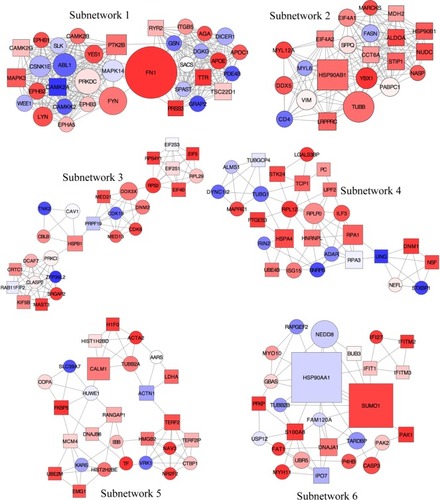
Table 3 Statistics for top six subnetworks identified by MCODE method in PPI network for AIDS patients with and without HIVE-induced dementia
Next, the degree of each node in the network was calculated with a degree-sorted circle layout algorithm, which identified hubs as nodes with a degree value of >55 (). The degree corresponded to the number of edges connecting all of the nodes in the network. A higher value for the degree indicated a highly connected network, which was likely to be more robust.
Table 4 Top 15 hub nodes identified in PPI network for DEGs from samples of AIDS patients with and without HIVE-induced dementia
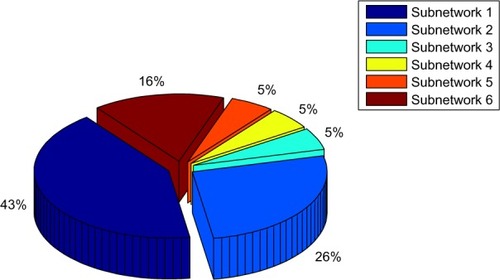
Subnetworks 1, 2, and 6 were determined as cytoskeleton- and protein folding-associated networks containing the highest percentage of hubs of highly expressed genes (). On the other hand, subnetworks 3–5 were defined to associate with RNA modifications, protein synthesis, and inflammatory processes.
Figure 7 Total percentage of hubs identified for six subnetworks to detect main DEGs associated with different cellular processes.
Heat-shock protein alpha (90 kDa), class A member 1 (HSP90AA1), and fibronectin 1 (FN1) were detected as “ superhubs” with a degree value of >130. Previously, members of the HSP90 family have been reported as interacting with a large number of viral proteins including HIV-1 Pr55(Gag) and Gag-Pol proteins.Citation32,Citation33 In particular, positional proteomics analysis identified the cleavage of cytosolic HSP90AA1 at 473–474 and 491–492 amino acid residues by the HIV-1 protease.Citation34 Moreover, hyperthermia-increased expression of HSP90 proteins in CD4+ T-cells were found to enhance HIV-1 Tat-mediated transactivation of the retroviral long terminal repeats stimulating single-cycle HIV-1 infection.Citation35
On the other hand, FN1, a high-molecular weight (~440 kDa) glycoprotein, was also found to interact with the structural and regulatory proteins of HIV-1, including envelope surface glycoproteins (gp120, 160, and 41), Nef/Tat, and Gag-Pol proteins.Citation36–Citation41 Notably, HIV-1 gp120 induces phosphorylation of FN1 and enhances the physical association between this protein and Robo4 in human lymphatic endothelial cells.Citation41 Additionally, the FN1 molecule modulates the effects of the HIV-1 Tat protein on endothelial cells and murine Kaposi’s sarcoma-like cells.Citation42
Contrary to the previous report of Petito et al,Citation43 we did not find any evidence of up-regulated gene expression profiles for CD8+ and cytotoxic T lymphocyte-associated genes at the systems biology level in autopsied AIDS brains with and without HIVE probably because of the differences in brain samples taken from different parts of the brain. The absence of DEGs participated in T-cell recruitment and associated with neurological lesions in the temporal lobe was due to the remote location of these lesions from the frontal cortex sampled for RNA extraction.
Furthermore, our findings showed that a number of proteins associated with the hub DEGs might be also used as markers to suspect the development and progression of AIDS or HIVE and dementia, and confirm some adverse effects of antiretroviral therapy. In particular, some of the identified proteins (SUMO1, FYN, and NEDD8) were found to be involved in the HIV-1 covalent modification and replicationCitation44,Citation45 and HIV-associated lipodystrophy.Citation46 The NEDD8 protein is a significant parameter to monitor during disease because, in AIDS patients receiving anti-HIV therapy, this protein has a considerable relevance as anti-HIV medications cause lipodystrophy in the long term.
Conclusion
The present study analyzed the gene expression profiles and pathways that may be involved in the progression of neuro-AIDS in patients with or without apparent features of HIVE-induced dementia by using a comprehensive bioinformatics analysis. To achieve this goal, the GSE4755 Affymetrix data were extracted from the GEO database to identify DEGs associated with the disease. In the next step, a PPI network was created by mapping relevant DEGs into the PPI data to pinpoint the interactions for these DEGs involved in this process. The results indicated the expression of 1,528 DEGs, which were mainly involved in the immune response, regulation of cell proliferation, cellular response to inflammation, signal transduction, and viral replication cycle. The data also show that the subnetworks one, two, and six were determined to contain the maximum number of hubs mainly relating to the regulation of cellular metabolism and response to inflammation. It is important because skewing of cellular metabolism/inflammation plays a significant part in progression to AIDS and also in neurodegeneration. The discovery of HSP90 proteins that play vital role in CD4+ T-cells were found to enhance HIV-1 Tat-mediated transactivation of the retroviral long terminal repeats stimulating single-cycle HIV-1 infection is an important one in the context of HIV-1. It was also determined that HSP90AA1 and FN1 molecules might play important roles in the mechanism of HIVE since they were defined to be as hub nodes with degree values >130. However, further studies are required to confirm these observations and determine their clinical utility in the therapeutic management of HIV-related neurological syndromes.
Acknowledgments
Special thanks are extended to Dr Nitin Saksena from American Medical Global Exchange Organization (Sydney, Australia) and Anna Poon from the City College of New York (New York, USA) for their assistance in the paper writing. The authors are grateful to the IZKF (Interdisziplinäres Zentrum für Klinische Forschung der Universität Würzburg) and the BMBF (Bundesministerium für Bildung und Forschung) for the support of this work by providing grants (BMBF01, EO1004) to Carola Förster.
Supplementary material
Table S1 R script to define and analyze differentially expressed genes (DEGs) from four Affymetrix microarrays
Disclosure
The authors report no conflicts of interest in this work.
References
- BerheTMelkamuYAmareAThe pattern and predictors of mortality of HIV/AIDS patients with neurologic manifestation in Ethiopia: a retrospective studyAIDS Res Ther201291122490062
- LumaHNTchaleuBCTemfackEHIV-associated central nervous system disease in patients admitted at the Douala General Hospital between 2004 and 2009: a retrospective studyAIDS Res Treat2013201370981023533732
- HeatonRKFranklinDREllisRJHIV-associated neurocognitive disorders before and during the era of combination antiretroviral therapy: differences in rates, nature, and predictorsJ Neurovirol201117131621174240
- ValcourVPaulRChiaoSWendelkenLAMillerBScreening for cognitive impairment in human immunodeficiency virusClin Infect Dis201153883684221921226
- MasliahEDeTeresaRMMalloryMEHansenLAChanges in pathological findings at autopsy in AIDS cases for the last 15 yearsAIDS2000141697410714569
- BellJEThe neuropathology of adult HIV infectionRev Neurol (Paris)1998154128168299932303
- BisselSJWangGBonneh-BarkayDSystemic and brain macrophage infections in relation to the development of simian immunodeficiency virus encephalitisJ Virol200882105031504218337567
- KaufmannWECerebrocortical changes in AIDSLab Invest19926632612641538582
- de VriesHEKuiperJde BoerAJVan BerkelTJBreimerDDThe blood–brain barrier in neuroinflammatory diseasesPharmacol Rev19974921431559228664
- VallatAVDe GirolamiUHeJLocalization of HIV-1 co-receptors CCR5 and CXCR4 in the brain of children with AIDSAm J Pathol199815211671789422534
- ZhengJGhorpadeANiemannDLymphotropic virions affect chemokine receptor-mediated neural signaling and apoptosis: implications for human immunodeficiency virus type 1-associated dementiaJ Virol199973108256826710482576
- GaleyDBeckerKHaugheyNDifferential transcriptional regulation by human immunodeficiency virus type 1 and gp120 in human astrocytesJ Neurovirol20039335837112775419
- MinagarAShapshakPDuranEMHIV-associated dementia, Alzheimer’s disease, multiple sclerosis, and schizophrenia: gene expression reviewJ Neurol Sci20042241–231715450765
- KoetheJRDeeKBianACirculating interleukin-6, soluble CD14, and other inflammation biomarker levels differ between obese and nonobese HIV-infected adults on antiretroviral therapyAIDS Res Hum Retroviruses20132971019102523469772
- EdgarRDomrachevMLashAEGene expression omnibus: NCBI gene expression and hybridization array data repositoryNucleic Acids Res200230120721011752295
- IrizarryRAHobbsBCollinFExploration, normalization, and summaries of high density oligonucleotide array probe level dataBiostatistics20034224926412925520
- GentlemanRCCareyVJBatesDMBioconductor: open software development for computational biology and bioinformaticsGenome Biol2004510R8015461798
- SmythGKLinear models and empirical Bayes methods for assessing differential expression in microarray experimentsStat Appl Genet Mol Biol20043 Article3
- WettenhallJMSmythGKlimmaGUI: a graphical user interface for linear modeling of microarray dataBioinformatics200420183705370615297296
- OgataHGotoSFujibuchiWKanehisaMComputation with the KEGG pathway databaseBiosystems1998471–21191289715755
- KanehisaMThe KEGG databaseNovartis Found Symp20022479110112539951
- DennisGJrShermanBTHosackDADAVID: database for annotation, visualization, and integrated discoveryGenome Biol200345P312734009
- ShannonPMarkielAOzierOCytoscape: a software environment for integrated models of biomolecular interaction networksGenome Res2003132498250414597658
- O’DriscollPMerenyiEKarmonikCGrossmanRSOM and MCODE methods of defining functional clusters in MRI of the brainConf Proc IEEE Eng Med Biol Soc201473473725570063
- HulseggeIKommadathASmitsMAGlobaltest and GOEAST: two different approaches for Gene Ontology analysisBMC Proc20093Suppl 4S1019615110
- HuangWShermanBTLempickiRASystematic and integrative analysis of large gene lists using DAVID bioinformatics resourcesNat Protoc20094445719131956
- CappellMSYaoFChoKCColonic adenocarcinoma associated with the acquired immune deficiency syndromeCancer19886236166193390798
- MonfardiniSVaccherEPizzocaroGUnusual malignant tumours in 49 patients with HIV infectionAIDS1989374494522504249
- RavalliSChabonABKhanAGastrointestinal neoplasia in young HIV antibody-positive patientsAm J Clin Pathol19899144584612929501
- FordRMMcMahonMMWehbiMAHIV/AIDS and colorectal cancer: a review in the era of antiretroviralsGastroenterol Hepatol (N Y)20084427427821960912
- SharanRIdekerTModeling cellular machinery through biological network comparisonNat Biotech200624427433
- ZhangFZangTWilsonSJJohnsonMCBieniaszPDClathrin facilitates the morphogenesis of retrovirus particlesPLoS Pathog201176e100211921738476
- LowJSFassatiAHsp90: a chaperone for HIV-1Parasitology201414191192120225004926
- ImpensFTimmermanEStaesAA catalogue of putative HIV-1 protease host cell substratesBiol Chem2012393991593122944692
- RoeschFMezianeOKulaAHyperthermia stimulates HIV-1 replicationPLoS Pathog201287e100279222807676
- BarillariGGendelmanRGalloRCEnsoliBThe Tat protein of human immunodeficiency virus type 1, a growth factor for AIDS Kaposi sarcoma and cytokine-activated vascular cells, induces adhesion of the same cell types by using integrin receptors recognizing the RGD amino acid sequenceProc Natl Acad Sci U S A19939017794179457690138
- TorreDPuglieseAFerrarioGMariettiGFornoBZeroliCInteraction of human plasma fibronectin with viral proteins of human immunodeficiency virusFEMS Immunol Med Microbiol1994821271318173552
- BozziniSFalconeVConaldiPGHeparin-binding domain of human fibronectin binds HIV-1 gp120/160 and reduces virus infectivityJ Med Virol199854144539443108
- PuglieseATorreDBaccinoFMCandida albicans and HIV-1 infectionCell Biochem Funct200018423524111180285
- ShoemanRLHartigRHausesCTraubPOrganization of focal adhesion plaques is disrupted by action of the HIV-1 proteaseCell Biol Int200226652953912119179
- ZhangXYuJKuzontkoskiPMZhuWLiDyGroopmanJESlit2/Robo4 signaling modulates HIV-1 gp120-induced lymphatic hyperpermeabilityPLoS Pathog201281e100246122241990
- WuZCavallaroUMarchisioPCSoriaMRMaierJAFibronectin modulates the effects of HIV-1 Tat on the growth of murine Kaposi’s sarcoma-like cells through the down-regulation of tyrosine phosphorylationAm J Pathol19981526159916059626063
- PetitoCKTorres-MunozJEZielgerFMcCarthyMBrain CD8+ and cytotoxic T lymphocytes are associated with, and may be specific for, human immunodeficiency virus type 1 encephalitis in patients with acquired immunodeficiency syndromeJ Neurovirol200612427228316966218
- HohashiNHayashiTFusakiNThe protein tyrosine kinase Fyn activates transcription from the HIV promoter via activation of NF kappa B-like DNA-binding proteinsInt Immunol1995711185118598580083
- GurerCBerthouxLLubanJCovalent modification of human immunodeficiency virus type 1 p6 by SUMO-1J Virol200579291091715613319
- EspositoVManenteLPernaARole of NEDD8 in HIV-associated lipodystrophyDifferentiation200977214815319281774