
Abstract
Objective
The purpose of this study is to develop a novel data-driven hybrid model by fusing ensemble empirical mode decomposition (EEMD), seasonal autoregressive integrated moving average (SARIMA), with nonlinear autoregressive artificial neural network (NARNN), called EEMD-ARIMA-NARNN model, to assess and forecast the epidemic patterns of TB in Tibet.
Methods
The TB incidence from January 2006 to December 2017 was obtained, and then the time series was partitioned into training subsamples (from January 2006 to December 2016) and testing subsamples (from January to December 2017). Among them, the training set was used to develop the EEMD-SARIMA-NARNN combined model, whereas the testing set was used to validate the forecasting performance of the model. Whilst the forecasting accuracy level of this novel method was compared with the basic SARIMA model, basic NARNN model, error-trend-seasonal (ETS) model, and traditional SARIMA-NARNN mixture model.
Results
By comparing the accuracy level of the forecasting measurements including root-mean-square error, mean absolute deviation, mean error rate, mean absolute percentage error, and root-mean-square percentage error, it was shown that the EEMD-SARIMA-NARNN combined method produced lower error rates than the others. The descriptive statistics suggested that TB was a seasonal disease, peaking in late winter and early spring and a trough in autumn and early winter, and the TB epidemic indicated a drastic increase by a factor of 1.7 from 2006 to 2017 in Tibet, with average annual percentage change of 5.8 (95% confidence intervals: 3.5–8.1).
Conclusion
This novel data-driven hybrid method can better consider both linear and nonlinear components in the TB incidence than the others used in this study, which is of great help to estimate and forecast the future epidemic trends of TB in Tibet. Besides, under present trends, strict precautionary measures are required to reduce the spread of TB in Tibet.
Introduction
Tuberculosis (TB) is a chronic communicable disease caused by the bacillus Mycobacterium tuberculosis, it is a major cause of ill-health, ranking among the 10 leading causes of morbidity and mortality globally.Citation1 The WHO estimated that about 10.0 million people developed TB in 2019 around the globe.Citation2 Furthermore, there were an estimated 1.4 million deaths associated with TB in 2019, leading to an annual approximately 1.8% and 2.8% reductions between 2015 and 2019 in the incidence and death rates, respectively, worldwide.Citation2 Currently, the global case notifications were mainly reported from 30 high TB burden countries, accounting for around 87% of the worldwide totals.Citation2 Of them, ranking the third is China, where the proportion of the reported cases reaches 8.4% in the world.Citation2 Moreover, China also has the second share (14%) of the global burden of drug-resistant TB in 2019, despite progress in cutting TB incidence with an average annual percent change of 3.2% between 1990 and 2017.Citation3 However, recent years have been witnessing a risk of resurgence in the TB incidence in some regions in China, attributable to climate change, alcohol use disorders, diabetes, HIV infection, smoking, and undernourishment, which have suppressed the progress of the end TB strategy with a target of 90% and 95% reductions in the TB incidence and death rates, respectively, in the period 2015–2035.Citation1,Citation2,Citation4,Citation5 To accelerate progress towards such an ambitious goal, accurately estimating and forecasting the past, current, and future epidemic trends of TB play a pivotal role in forming the targeted prevention and control measures and in adjusting the present interventions.
There is a large volume of studies forecasting the epidemiological trends of communicable diseases using different statistical techniques, such as the seasonal autoregressive integrated moving average (SARIMA) method,Citation6 exponential smoothing method,Citation7 generalized regression neural network (GRNN) method,Citation8 nonlinear autoregressive neural network (NARNN) method,Citation9 backpropagation neural network (BPNN) method,Citation1 multivariate linear regression method,Citation10 and Elman and Jordan recurrent neural networks.Citation11 Among them, the most frequently used linear method is the SARIMA model,Citation12–Citation15 whereas the nonlinear method is the NARNN model.Citation5,Citation9,Citation12,Citation16 However, there are various factors affecting and limiting the epidemiological patterns of diseases.Citation1,Citation17,Citation18 For this reason, the epidemics of communicable diseases are often characterized by linear and nonlinear patterns.Citation19 However, the above-mentioned statistical techniques are often insufficient to capture either tendencies or randomness in the time series, which may limit the generalization of the findings from the mentioned models. Therefore, to improve the prediction accuracy and reliability, an alternative approach is expected to be customized for use with both the above two traits included in the object series. Inspired by such an idea, many studies have adopted a hybrid technique comprising a linear model and a nonlinear model to yield more accurate prediction by integrating each model’s superiority.Citation9,Citation20,Citation21
Over the last years, wavelet analysis has become a popular method capable of decomposing the data into different high-scale and low-frequency components (linear trait) and low-scale and high-frequency components (nonlinear trait) particularly when target series shows complex nonstationary and nonlinear characteristics.Citation22 More recently, a new wavelet analysis approach-ensemble empirical mode decomposition (EEMD) was developed by adding noise to overcome the mode mixing disadvantage of the traditional empirical mode decomposition (EMD).Citation23 Importantly, different from the most commonly used discrete wavelet transform techniques that may generate different decomposition results since they are required to predetermine basis functions,Citation24 EEMD is a self-adaptive, intuitive, direct, and empirical decomposition method for the nonstationary and nonlinear time series.Citation23 Considering the superiority of the EEMD technique in decomposing the data and the worsening epidemic trends of TB in Tibet with the highest TB morbidity in China in the past years,Citation25 we thus proposed a novel forecasting method (designated as EEMD-SARIMA-NARNN hybrid method) by integrating the SARIMA and NARNN models based on the EEMD technique to capture both the tendencies and randomness in the time series simultaneously. Specifically, the EEMD technique was first applied to decompose the TB incidence series into several Intrinsic Mode Functions (IMFs) components representing the different nonlinear parts of the data and a residue component denoting the tendency of the data. Second, using the NARNN and SARIMA methods to model the IMFs and residue components, respectively. Finally, the forecasting values from the IMFs and residue components were aggregated as the predicted results from the EEMD-SARIMA-NARNN hybrid technique. By doing so, the linear and nonlinear parts contained in the TB incidence series can be considered by this data-driven mixture method simultaneously. Whilst we also compared the fitted and predicted results from the basic SARIMA model, basic NARNN model, and the traditional SARIMA-NARNN mixture model with that from our proposed novel hybrid method to judge the forecasting performance of this novel data-driven method.
Materials and Methods
Study Area and Data Source
Tibet is located in the southwest of the People’s Republic of China. It is one of the five ethnic autonomous regions in China, and its average elevation is above 4000 m, known as the “roof of the world”. Tibet covers 1228.4 km2. At the end of 2019, the resident population was 3.506 million.
The monthly incident cases between January 2006 and December 2017 reported to the Center for Disease Control and Prevention (CDC) were taken from the National Notifiable Infectious Disease Surveillance System (NNIDSS), and the population data during the same period from the Bureau of statistics of Tibet Autonomous Region (http://tjj.xizang.gov.cn/). A total of 144 observations across 12 years were aggregated. Generally, it is required to use preferably 100 observations or more to develop object models so that a reliable and stable result is obtained.Citation26 Therefore, the observations used in this research were partitioned into two parts including a training dataset comprising 132 observations (from January 2006 to December 2016) and a testing dataset comprising 12 observations (from January to December 2017).
Ethics Approval and Consent to Participate
The study protocol was approved by the study institutional review board of the Xinxiang Medical University (No: XYLL-2019,072), and consent is not needed for this study since we only collected the reported monthly TB cases publicly available without the detailed individual information.
A New Hybrid Model of EEMD-SARIMA-NARNN
EEMD Technique
In the past, albeit EMD technique shows remarkable superiority in signal analysis, particularly for the data produced in noisy nonlinear and non-stationary processes, there are two major weaknesses including the edge-effects and mode-mixing,Citation20,Citation23,Citation27 especially for the mode-mixing disadvantage, which not only results in the mixing of different scale vibration modes but can even cause the loss of the physical meaning of each IMFs.Citation28 The EEMD method was thus developed based on the EMD algorithm to overcome the barriers of the original technique.Citation23 In the EEMD approach, it uses a powerful method of ensemble mean to improve the accuracy of measurements.Citation23 Namely, it defines the actual individual IMFs components as the average of an ensemble of experiments, each IMF component is composed of the signal and noise of finite-amplitude.Citation20 The decomposition procedure of the EEMD approach can be in the form as below.
Initially, add white noise w(t) to the given time series x(t), and the obtained new series can be expressed as
Secondly, decompose the produced series into IMFs with the help of the EMD algorithm.
Thirdly, repeat the above two steps using various white noise series, the resulting results were added to the original series each time.
Finally, average the ensemble of the corresponding IMFs generated by the EMD decomposition technique.
In the process of decomposition, the numbers of the ensemble and the amplitude of the added white noise play a pivotal role in the obtained final results.Citation29 Fortunately, a well-demonstrated statistical rule helps to determine these two key parametersCitation23:
where N represents the numbers of the ensemble, is the amplitude of the added white noise, and
signifies the standard deviation of the error. Prior studies have found that the parameter settings with the ensemble numbers of 100 and the amplitude of added white noise of 0.2 times standard deviation can generate a satisfactory result.Citation23,Citation30
EEMD-SARIMA-NARNN Hybrid Model
To this end that makes full use of the possible linear and nonlinear information contained in the target series, inspired by the idea of “decomposition and ensemble” of the EEMD technique and the powerful ability to extract nonlinear information of the NARNN model,Citation31 the EEMD-SARIMA-NARNN hybrid model was thus proposed (Figure S1). In this project, the time series of TB morbidity was decomposed into different IMFs subseries and residue terms. Then, each of IMFs subseries was predicted using a suitable NARNN model, while the residue term was forecasted with an appropriate SARIMA model. As such, the final results can be derived by integrating the resulting values of the SARIMA model with the counterparts of the NARNN approaches. By doing so, the hybrid model can then attain a capacity that unearths all possible components included in the data. The specified equation of a SARIMA-NARNN combined model can be written as
where represents the estimates using the proposed hybrid method,
is the estimates of residue terms using the SARIMA method,
refers to the estimates of IMFs subseries using the NARNN method.
Furthermore, the SARIMA method, NARNN method, and traditional SARIMA-NARNN method were created according to the steps described in supplementary material.
Statistical Analysis
The TB epidemic trends and changes were measured with average annual percentage change (AAPC) based on the joinpoint regression program (Version 4.8.0.1). The basic SARIMA method was constructed with R software (version 3.4.3, R Development Core Team, Vienna, Austria), and the EEMD, basic NARNN, SARIMA-NARNN, and EEMD-SARIMA-NARNN methods were developed using MATLAB software (Version R2014a, MathWorks, Natick, MA, USA). The Lagrangian Multiplier (LM) method was used to test the conditional heteroskedastic behavior and volatility (ARCH effect) of the residual series from the selected four models.Citation32 The root-mean-square error (RMSE), mean absolute deviation (MAD), mean error rate (MER), mean absolute percentage error (MAPE), and root-mean-square percentage error (RMSPE) were chosen to assess the predictive accuracy levels among models. The lower the indices’ values are, the better the models are.
where Xi signifies the observed TB values,is the estimates using the chosen approaches,
refers to the mean of all the observed TB values, and N stands for the number of simulations and forecasts.
Results
Descriptive Analysis
During the period 2006–2017, the reported TB cases totaled 45,025 with notified 3753 cases annually, leading to annualized and monthly incidence rates of 121.9 and 10.2 per 100,000 persons, respectively. As illustrated in Figure S2, when the seasonal-trend decomposition procedure based on Loess (STL) technique was applied to the TB morbidity series, it was found that the TB epidemic showed a drastic increase by a factor of 1.7 from 2006 to 2017, with AAPC=5.8 (95% confidence intervals: 3.5–8.1; Z=5.8, P<0.001) (Figure S3). The highest TB morbidity rate was noted in 2017 (152.0 cases per 100,000 people), it has increased 2.4-fold compared with 2008 when the morbidity rate was lowest (64.7 cases per 100,000 people). Besides, it was observed that the TB morbidity had notable seasonal effects, with a peak occurred in January until August, especially in January and March, and a trough in September until December, particularly in December (Figures S2 and S4).
The Best-Fitting SARIMA Method
The original TB incidence series showed a unit root (ADF=−1.3, P=0.2) and marked seasonal effects (Figure S2), indicating a nonstationary series, and thus seasonally differencing once to remove the seasonal variation of the data. By doing so, the differenced data met the prerequisite of the SARIMA model development, being stationary (ADF=−3.4, P=0.001). Afterward, by plotting the ACF and PACF graphs for the stationary series, the autocorrelations at lags 1, 2, and 3 and partial autocorrelations at lags 1 and 2 were found to touch the significance levels (Figure S5), and we observed that the values of the key parameters (p, q, P, and Q) of SARIMA model exceeded 2, the model’s parameter suggested no statistical significance, and thereby we selected several plausible models with the key parameters were between 0 and 2. demonstrates that the SARIMA(2,0,0)(2,1,0)12 model seems to provide adequate modeling for the object series since this model presented the lowest values of performance indices (AIC=409.2, CAIC=409.7, and BIC=423.2) among the possible nine models, and statistical test of the estimated parameters for this method was indicated significantly different (). Moreover, both the Ljung–Box Q test and LM test showed a P-value greater than 0.05 (, Tables S1 and S2), suggesting that the residuals behaved like white noise and the ARCH effect had been removed from the residuals. The above tests mean that the SARIMA(2,0,0)(2,1,0)12 model is appropriate for describing this time series. Therefore, this model is taken as the best.
Table 1 The Identified Nine Plausible SARIMA Methods and Their Information Criteria
Table 2 Statistical Test of the Estimated Parameters for the Optimal SARIMA (2,0,0)(2,1,0)12 Method
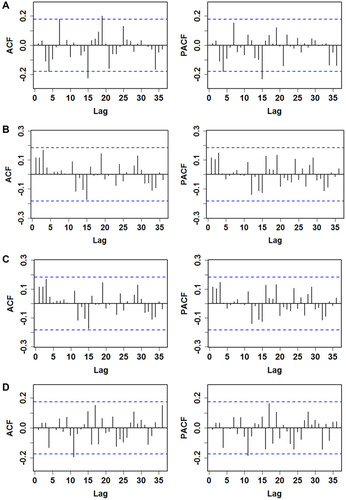
Figure 1 Estimated autocorrelogram and partial autocorrelogram of the residual sequence to forecast the TB epidemic patterns using (A) SARIMA model, (B) basic NARNN model, (C) traditional SARIMA-NARNN hybrid model, and (D) novel EEMD-SARIMA-NARNN hybrid model. As seen, the estimated autocorrelations and partial autocorrelations of the errors from the different models almost fell into the 95% confidence intervals (CIs) with few exceptions, such as the autocorrelations at lags 15 and 19 and partial autocorrelations at lags 15 in (A), and autocorrelations and partial autocorrelations at lag 11 in (D), these are also reasonable because higher-order autocorrelations and partial autocorrelations easily exceed the 95 CIs by chance.
The Best-Fitting NARNN Method
As described in previous studies, the ANNs models with hidden units between 10 and 20 and feedback delays between 3 and 7 can often provide a satisfactory prediction and ease overfitting to a certain degree.Citation33–Citation37 Therefore, we trained a series of networks with the mentioned-above ranges of hidden units and feedback delays by trial and error so that a preferred model was discovered. By doing so, the NARNN (16, 6) model with 16 hidden units and 6 feedback delays tended to be indicated the optimal in that this network structure produced the lowest MSE values in the training (0.6), validation (4.5), and testing (3.8), and all R values were greater than 0.8 in the training (1.0), validation (0.8), testing (0.8), and the whole data (0.9) ( and Figure S6). Also, as shown in Figure S7, the modeling results of this model agreed pretty well with the observed values as most of the errors were between −1 and 1. Additionally, the Ljung–Box Q and LM-test statistics for the residual sequence yielded by this model showed a P-value greater than 0.05 (Tables S1 and S2), and the sample autocorrelation and partial autocorrelation for the in-sample forecast errors at different lags failed to exceed the significance bounds (), implying that the in-sample forecast errors showed a white noise and no ARCH effect. Thus, we are confident that the NARNN (16, 6) model was considered optimal in this study.
Table 3 The Estimated Parameters of the Optimal NARNN Models for the Original Series and Decomposed Series Using the EEMD Method
The Best-Fitting Traditional SARIMA-NARNN Mixture Method
In the process of constructing the traditional SARIMA-NARNN method, the residual series from the SARIMA model was utilized to train the best NARNN model. Similarly, we found that the NARNN (19, 6) method with 19 hidden units and 6 feedback delays appeared to be abundant for modeling the object series via repeated modeling as this model had a relatively great R-value and a relatively low MSR value in the training, validation, and testing data (). Further, we investigated the residual series from the SARIMA(2,0,0)(2,1,0)12-NARNN (16, 6) mixture model using the Ljung–Box Q and LM tests, showing that this residual series belonged to a white noise series and also no ARCH effect was noted in the residuals (Tables S1 and S2). Besides, the sample autocorrelations and partial autocorrelations for the in-sample forecast errors inside the 95% uncertainty bounds also indicated that the errors met the assumption of uncorrelatedness (). Thereby, the SARIMA(2,0,0)(2,1,0)12-NARNN (16, 6) mixture model is considered the best-performing in this work.
The Best-Fitting Novel EEMD-SARIMA-NARNN Mixture Method
The EEMD technique was employed to decompose the TB morbidity series. As listed in , the original series was decomposed into six different IMFs subseries and a residue term. Subsequently, the residue term was modeled using the SARIMA method and the IMFs terms were modeled with different NARNN methods, and the resulting results showed that the SARIMA (1,2,0)(1,0,1)12 method was the most suitable for modeling the residue term and NARNN(17, 5), NARNN(16, 5), NARNN(15, 5), NARNN(16, 6), NARNN(14, 4), and NARNN(14, 5) models were taken to be the best methods for modeling the IMF1~IMF6 subseries (–), respectively, and the diagnostic test results for the best SARIMA model and different NARNN models are shown in and S8-S14. Further checking results for the residuals from the new EEMD-SARIMA-NARNN mixture method are given in Tables S1-S2 and . The P-values for LM and Ljung–Box Q tests were greater than 0.05 (Tables S1-S2), suggesting that there was no ARCH effect in the errors and there was little evidence of non-zero autocorrelations in the in-sample forecast errors at various lags, which could also be verified by the ACF and PACF plots as the sample autocorrelations and partial autocorrelations at different lags almost fell into the 95% significance bounds (). The above results intimated that this new data-driven mixture model can capture the short-term dependencies of the data and is adequate for forecasting the data.
Table 4 Statistical Test of the Estimated Parameters for the Optimal SARIMA (1,2,0)(1,0,1)12 Method
Figure 2 Intrinsic mode functions (IMFs) and residue components of the original TB incidence series using the EEMD.
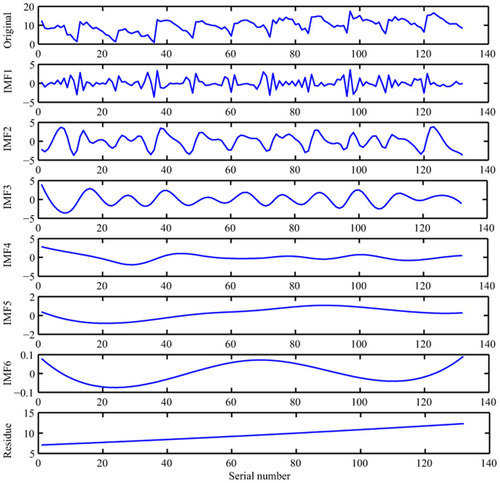
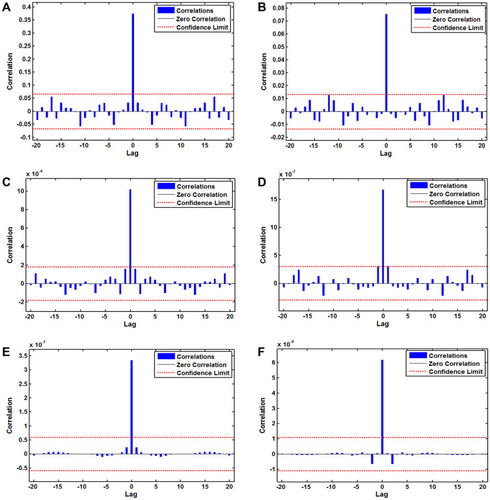
Figure 3 Estimated autocorrelogram of the residual sequence to forecast the six intrinsic mode functions (IMFs) decomposed by the EEMD method using the SARIMA-NARNN hybrid model. (A) IMF1, (B) IMF2, (C) IMF3, (D) IMF4, (E) IMF5, and (F) IMF6. For the estimated autocorrelations of the residual series from the different IMFs, all of them are inside of the 95 CIs except for the one at lag zero, meaning that there is no correlated serial in the residuals of the best-fitting SARIMA-NARNN hybrid model. Thereby, there appears to be adequate and reasonable for forecasting upcoming epidemiological trends using these best-fitting models.
Assessing the Predictive Accuracy Levels Among Models
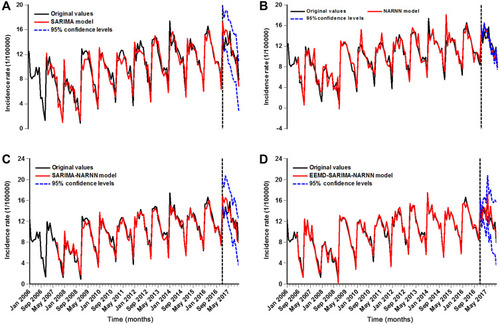
We used the preferred individual models to predict the testing data, and then comparing the predictive accuracy levels among models from two aspects of the training and forecasting horizons based on five measures including RMSE, MAD, MER, MAPE, and RMSPE. The comparative results showed that our proposed EEMD-SARIMA-NARNN mixture model produced lower values of the above five measures compared with other methods used in this study both in training and forecasting horizons (). Likewise, visible in , it makes sense that this new mixture technique can better capture the temporal dependency structure of the TB incidence series than the others.
Table 5 Comparisons of the Fitted and Forecasted Accuracy Levels Among the Optimal Four Methods
Figure 4 Time series plot showing the comparative results between original observations and fitted and predicted values using the selected best-fitting (A) SARIMA model, (B) NARNN model, (C) traditional SARIMA-NARNN hybrid model, and (D) novel EEMD-SARIMA-NARNN hybrid model (The curve at the left of the vertical black dotted line represents the fitted values, whereas the curve at the right denotes the forecasted values). As shown, the produced curve from the EEMD-SARIMA-NARNN hybrid model is closer to the actual both in the fitted and predicted aspects compared with the curves from the other models.
Discussion
Accurately estimating the epidemics of infectious diseases acts as a basis for the decision-making process and the rational allocation of limited health resources under dynamic demand.Citation1 The importance and originality of this work are that it creates a novel and more effective forecasting model for TB incidence series prediction by integrating the linear characteristics of a SARIMA method and nonlinear characteristics of the NARNN model based on the EEMD technique. By comparing the performance indicators of this novel model comprising RMSE, MAD, MER, MAPE, and RMSPE with the basic SARIMA model, basic NARNN model, and the traditional SARIMA-NARNN mixture model, it was observed that this new data-driven hybrid model showed better superiority than the others both in the fitted and predicted aspects. Often, the MAPE value is considered a useful measure to assess the forecasting accuracy of a model, with a value less than 10% indicating a highly accurate forecast, and a value less than 20% suggesting a good approximation to the observed values.Citation38 Exhilaratingly, our proposed novel hybrid technique provided a highly accurate forecast for the TB morbidity series as the MAPE showed a value less than 10% both in the simulated and predicted horizons, which further reinforces the usefulness of our proposed new method as a helpful forecasting tool. Also, we used the TB incidence data in Qinghai province to provide an external validation for the predictive ability of our proposed hybrid method,Citation12 Tables S3-S5 and Figures S15-S16 exhibit the resulting results, suggesting a same finding as our current work that the EEMD-SARIMA-NARNN mixture method produces more accurate approximation to the TB incidence data in Qinghai. Besides, recent work of our research group indicates that the error-trend-seasonal (ETS) model can also accurately estimate and forecast the epidemic patterns of TB incidence,Citation4 and thus we further compared the mimic and predicted abilities between our proposed hybrid technique and ETS model. The modeling results displayed that the ETS(A,AD,A) model is supposed to be considered the preferred (Tables S6-S7). Similarly, visible in Table S8, the EEMD-SARIMA-NARNN hybrid technique also significantly outperforms the optimal ETS model. Therefore, this novel data-driven hybrid technique can be recommended as an effective and valuable tool in analyzing and estimating the temporal trends of the TB incidence in Tibet. Moreover, although the SARIMA model, NARNN model, ETS model, and SARIMA-NARNN mixture model produced a relatively low predictive performance relative to our proposed hybrid technique, they are also shown to have a good potential to model the TB epidemics because they gave a MAPE value less than 20% both in the mimic and predictive aspects, this is in good agreement with prior researches that used the above common models to analyze the temporal patterns of other infectious diseases (eg COVID-19,Citation39 typhoid and paratyphoid fevers,Citation40 schistosomiasis,Citation41 and hand-foot-mouth diseaseCitation42). Also, our proposed hybrid model can be used to estimate the current intervention effects for TB, if this model estimates a significantly higher incidence than the actual, meaning that the current interventions play an important role. Otherwise, additional or optimized measures are essential, such as optimization of the current tools, the pursuit of universal health coverage and social protection, the introduction of new vaccine and new prophylaxis, and the increase of the funding for TB.Citation2
The SARIMA model has been recommended as a versatile tool for estimating and forecasting time series with marked seasonality and periodicity, and for a non-stationary time series, after differencing or making a transformation with logarithm or square root, this model can also be used and can achieve satisfactory forecasting. For instance, Chen et al developed a SARIMA method to estimate the epidemiological trends of the influenza incidence, they found that the SARIMA(0,1,0) (0,1,2)12 method showed a MAPE value of 10.597% for predicting the influenza incidence in the urban area of Shenyang, and the SARIMA(1,1,1) (1,1,0)12 method had a MAPE value of 19.414% in the rural area.Citation43 Gao et al observed that the SARIMA(0,1,7)(1,0,1)12 method displayed a good performance for forecasting the cumulative incidences of typhoid (MAPE=13.257%) and paratyphoid fevers (MAPE=19.501%).Citation40 Although the SARIMA model displays a good forecasting performance, it cannot describe the nonlinear information included in the TB morbidity in that this model assumes that there is a linear link between successive values of the time series.Citation4 However, different from the SARIMA model, the dynamic NARNN method has been deemed as a promising alternative to address any nonlinear issue without any constraints because of its short-run memory function besides the common properties of static BPNN and GRNN.Citation9,Citation44,Citation45 Thereby, researchers developed the traditional SARIMA-NARNN mixture model to take advantage of each method’s potentials, and yet recent studies found that such a conventional combined mode may fail to model seasonal or trend variations effectively based on the unpreprocessed time series as the conventional model may not capture the linear and nonlinear components reasonably well,Citation46 namely, the conventional hybrid models do not necessarily overmatch their individual predictions.Citation19,Citation46 Also, as evidenced by our and other work, the traditional SARIMA-NARNN or other conventional mixture models (such as SARIMA-BPNN and SARIMA-GRNN) cannot offer a performance improvement over the basic NARNN and ETS methods on the testing data.Citation19,Citation47–Citation49 For this reason, our proposed data-driven hybrid model is more reasonably customized for forecasting the different components via decomposing the target series into different linear and nonlinear traits based on the EEMD method. As expected, this hybrid technique is shown to be mechanically more robust and accurate for forecasting the TB incidence in Tibet compared with the others. Given its superiority and the low-cost data collection, this data-driven EEMD-SARIMA-NARNN combined technique seems to be transferable to analyze the epidemiological trends of the TB incidence in other regions or other types of infectious diseases, even of all-time series data, whereas much work is still required to investigate its efficiency and usefulness. Besides, of note, some new advanced deep mining methods (such as long short-term memory neural network (LSTM) and convolutional neural network (CNN)) have currently been applied to predict the dengue cases,Citation50 daily land surface temperature,Citation28 and ICD-9 codes of medical records,Citation51 and these studies suggested that the LSTM and CNN also showed high accuracy for forecasting the target series. Therefore, further work is supposed to compare the forecasting ability between our proposed combined method and the above deep mining methods.
In this work, we discovered that the TB morbidity exhibited marked seasonal variations, predominantly peaking in late winter and early spring and a trough in autumn and early winter. Such a seasonal pattern is similar to previous findings from across China and most of the southwest regions of China (such as Qinghai, Xizang, and Yunnan),Citation5,Citation12,Citation52 along with the results obtained in Japan and Spain.Citation53,Citation54 A preceding review to examine the seasonal variability based on 12 studies also supports further evidence that the peak patterns of TB are predominantly seen during the spring and summer seasons.Citation55 And yet in disagreement with that in Eastern Cape, the United States, Korea, Mongolia, northern India, and Kuwait.Citation9,Citation56–Citation58 In this study, an interesting finding is that the TB incidence series in Tibet displayed a primarily exclusive semi-annual seasonal pattern with longer high-risk seasons from January until August and low-risk seasons from September until December per year, which is inconsistent with those observed in earlier studies.Citation5,Citation12,Citation52,Citation55 Seemingly, various factors are related to the mechanisms underlying TB high-risk seasonal behavior. Firstly, Tibet, as a famous tourist city, attracts hundreds of thousands of persons every year, with tourists being over 40 million in 2019.Citation59 Among them, the persons touring during the TB high-risk months approximately accounting for most of them. Large-scale population movements may drive the transmission of TB,Citation60 which is also in keeping with the temporal patterns present in the high-risk months in the spatial-temporal sequence. Secondly, current studies have shown that meteorological parameters may play a pivotal role in the spread of TB.Citation1,Citation61 A study found that the TB incidence showed a decreased trend with the increases in temperature and precipitation in Qinghai.Citation62 Another study suggested that wind speed is positively correlated with the TB incidence in Jinghong city of Yunnan.Citation61 The climate of Tibet is characterized by low pressure, strong wind, heavy rainfall, and relatively low temperature (annual mean temperature is 8°C), this climate type may increase the likelihood of contracting TB in the high-risk seasons as people tend to move indoors or crowded spaces for carrying out their activities and work.Citation9 Thirdly, it is thought that vitamin D levels may be closely associated with the seasonal variation of TB, this is mediated through the elevated risk of activation of latent TB because of late winter nadirs in vitamin D levels.Citation52,Citation56 The reduced sunshine in winter causes vitamin D deficiency, which further influences the potential of macrophages to kill the bacillus Mycobacterium tuberculosis in vitro.Citation56,Citation63 Fourthly, Lunar New Year, the foremost festival in China, may also play an important role in the seasonal peak patterns of TB since this festival is followed by the largest scale collective on the Tibet migrates, particularly in January and February per year. Given that there is an incubation of around 4–8 weeks from infection to medical diagnosis,Citation64 this is wholly in agreement with the maximum peak in March. Besides, it can be seen that there are lower reported cases in February than in January and March. This is derived from the fact that people do not tend to seek medical advice during the Lunar New Year period. Finally, in recent years, more and more activities involving the knowledge-attitude-behavior and new control modes of TB were implemented on World Tuberculosis Day in Tibet, which can enhance public awareness of TB and they are more willing to access healthcare. Besides, an investigation into other factors driving the seasonal variation should go on.
In contrast with the fact that the TB morbidity is falling per year at the rates of about 1.6% and 3% since 2005 in the world and China, respectively,Citation2 the TB incidence was demonstrated to display a rapidly increasing trend in Tibet, with AAPC=5.8 from 2006 to 2017. To achieve the 2035 target of the End TB Strategy for 90% reductions in the TB incidence compared with 2015, the WHO estimates that the downtrend in the TB incidence requires to be accelerated at the rates of around 5% by 2020, 10% by 2025, and 17% between 2025 and 2035 globally.Citation2,Citation65 The current epidemic patterns of TB in Tibet has been an extremely daunting challenge for reaching the aim of a world free of TB during different periods.Citation65 Many reasons may be responsible for such an increasing trend in the TB epidemics in Tibet. Firstly, TB is an infectious disease of poverty; Tibet has poor essential health-care services and low socio-economic conditions, with the GDP ranking the last among 31 provinces and municipalities of China in 2019,Citation59 which may be the most important trigger for the rapid rise in the TB incidence. Secondly, local meteorological and environmental factors may also be important contributors. Thirdly, Buddhist monks and nuns that account for a significant proportion of the population in Tibet have poor health-care knowledge and they frequently undertake their religious activities in relatively small temples, irrespective of the time of the year, which facilitates the continued transmission among people.Citation66 Fourthly, in recent years, the laboratory equipment and testing ability are continuously improved, and new techniques and methods of molecular biology detection and rapid diagnosis are popularized to improve the level of patient discovery in Tibet. Fifthly, around 80% of TB patients in Tibet had been resident in farming and pastoral areas,Citation66 and many TB patients do not know that they can be examined and treated free of charge. Faced with the catastrophic costs for TB patients and their households, they often choose not to access healthcare, which further helps the spreading of TB among people. Finally, a study showed that the public awareness of core information on TB prevention and treatment was only 34%, significantly lower than the national average level (57.0%),Citation67 such a low public awareness may be a contributory factor in relation to the elevated TB incidence in Tibet. Besides, some other reasons (such as alcohol use disorders, diabetes, HIV infection, smoking, and undernourishment) may also play a role. Confronted with such a worsening tendency, some additional or comprehensive intervention strategies must be taken to combat TB in Tibet.
The present study was subject to some potential weaknesses. Firstly, the time series of the TB incidence was derived from a passive monitoring system, and therefore the underreporting may be inevitable. Secondly, we only used a dataset spanning 12 years to construct the models and some detailed information (such as sex and age) of the TB cases cannot be extracted, which limits further sensitivity analysis for our model. Thirdly, there is currently still in the absence of a guidance to determine the suitable key parameters of ANNs (such as hidden units and feedback delays). In applications, a series of experiments need to be performed by trial and error until the best performance indices are detected. Fourthly, incorporating potential influencing factors of TB into the EEMD-SARIMA-NARNN method may favor the improvement of the forecasting performance, and yet this failed to be done in our work. Fifthly, whether this novel mixture method can also achieve a high-accuracy prediction for other infectious diseases or time series, further research should be undertaken to explore its potential use. Finally, in applications, the newly reported TB cases should be added into the model in time to make sure of its forecasting accuracy level.
Conclusions
Our proposed novel data-driven EEMD-SARIMA-NARNN hybrid method can better capture the dynamic dependence characteristics of the TB incidence in Tibet compared with the basic SARIMA model, basic NARNN model, ETS model, and traditional SARIMA-NARNN combined method, which can be recommended as a helpful and instrumental policy-supportive tool for planning the health-care resources ahead of time and directing the intensity and type of current interventions required to end the TB epidemic. Besides, considering the ongoing increases in TB cases, some additional or comprehensive intervention strategies must be taken to combat TB in Tibet.
Data Sharing Statement
All the data supporting the findings of the work are contained within the study.
Author Contributions
All authors made substantial contributions to conception and design, acquisition of data, or analysis and interpretation of data; took part in drafting the article or revising it critically for important intellectual content; agreed to submit to the current journal; gave final approval of the version to be published; and agree to be accountable for all aspects of the work.
Acknowledgments
We appreciate the Chinese CDC for providing the monthly number of TB cases. This project was supported by the Innovation and Entrepreneurship Training Project for University Students of Henan Province (S202010472007) and Xinxiang Medical University (XYXSKYZ201932) and the Key Scientific Research Project of Universities in Henan (21A330004).
Disclosure
The authors report no conflicts of interest in this work.
References
- Li ZQ, Pan HQ, Liu Q, Song H, Wang JM. Comparing the performance of time series models with or without meteorological factors in predicting incident pulmonary tuberculosis in eastern China. Infect Dis Poverty. 2020;9(1):151. doi:10.1186/s40249-020-00771-733148337
- WHO. Global tuberculosis report 2020. Available from: https://apps.who.int/iris/handle/10665/336069. Accessed 1225, 2020.
- Ding C, Wang S, Shangguan Y, et al. Epidemic trends of tuberculosis in China from 1990 to 2017: evidence from the global Burden of Disease Study. Infect Drug Resist. 2020;13:1663–1672. doi:10.2147/idr.s24969832606817
- Wang Y, Xu C, Ren J, et al. Secular seasonality and trend forecasting of tuberculosis incidence rate in China using the advanced error-trend-seasonal framework. Infect Drug Resist. 2020;13:733–747. doi:10.2147/IDR.S23822532184635
- Wang Y, Xu C, Zhang S, et al. Temporal trends analysis of tuberculosis morbidity in mainland China from 1997 to 2025 using a new SARIMA-NARNNX hybrid model. BMJ Open. 2019;9(7):e024409. doi:10.1136/bmjopen-2018-024409
- Li Z, Wang Z, Song H, et al. Application of a hybrid model in predicting the incidence of tuberculosis in a Chinese population. Infect Drug Resist. 2019;12:1011–1020. doi:10.2147/idr.s19041831118707
- Zhang YQ, Li XX, Li WB, et al. Analysis and predication of tuberculosis registration rates in Henan Province, China: an exponential smoothing model study. Infect Dis Poverty. 2020;9(1):123. doi:10.1186/s40249-020-00742-y32867846
- Wang YW, Shen ZZ, Jiang Y. Comparison of autoregressive integrated moving average model and generalised regression neural network model for prediction of haemorrhagic fever with renal syndrome in China: a time-series study. BMJ Open. 2019;9(6):e025773. doi:10.1136/bmjopen-2018-025773
- Adeboye A, Davies O, Akinwumi O, James N, Ruffin M. Seasonality and trend forecasting of tuberculosis prevalence data in Eastern Cape, South Africa, using a hybrid model. Int J Environ Res Public Health. 2016;13(8):757. doi:10.3390/ijerph13080757
- Zhang X, Zhang T, Young AA, Li X. Applications and comparisons of four time series models in epidemiological surveillance data. PLoS One. 2014;9(2):e88075. doi:10.1371/journal.pone.008807524505382
- Wu W, An SY, Guan P, Huang DS, Zhou BS. Time series analysis of human brucellosis in mainland China by using Elman and Jordan recurrent neural networks. BMC Infect Dis. 2019;19(1):414. doi:10.1186/s12879-019-4028-x31088391
- Wang Y, Xu C, Li Y, et al. An advanced data-driven hybrid model of SARIMA-NNNAR for tuberculosis incidence time series forecasting in Qinghai Province, China. Infect Drug Resist. 2020;13:867–880. doi:10.2147/IDR.S23285432273731
- Tian CW, Wang H, Luo XM. Time-series modelling and forecasting of hand, foot and mouth disease cases in China from 2008 to 2018. Epidemiol Infect. 2019;147:e82. doi:10.1017/S095026881800362X30868999
- Weng RX, Fu HL, Zhang CL, et al. Time series analysis and forecasting of chlamydia trachomatis incidence using surveillance data from 2008 to 2019 in Shenzhen, China. Epidemiol Infect. 2020;148:e76. doi:10.1017/s095026882000068032178748
- Qiu H, Zeng D, Yi J, et al. Forecasting the incidence of acute haemorrhagic conjunctivitis in Chongqing: a time series analysis. Epidemiol Infect. 2020;148:e193. doi:10.1017/S095026882000182X32807257
- Wang KW, Deng C, Li JP, Zhang YY, Li XY, Wu MC. Hybrid methodology for tuberculosis incidence time-series forecasting based on ARIMA and a NAR neural network. Epidemiol Infect. 2017;145(6):1118–1129. doi:10.1017/S095026881600321628115032
- Pan A, Liu L, Wang C, et al. Association of public health interventions with the epidemiology of the COVID-19 outbreak in Wuhan, China. JAMA. 2020;323(19):1915. doi:10.1001/jama.2020.613032275295
- Lin YJ, Lin HC, Yang YF, et al. Association between ambient air pollution and elevated risk of tuberculosis development. Infect Drug Resist. 2019;12:3835–3847. doi:10.2147/IDR.S22782331827330
- Taskaya-Temizel T, Casey MC. A comparative study of autoregressive neural network hybrids. Neural Net. 2005;18(5–6):781–789. doi:10.1016/j.neunet.2005.06.003
- Zhang X, Zhang Q, Zhang G, Nie Z, Gui Z, Hybrid A. Model for annual runoff time series forecasting using Elman neural network with ensemble empirical mode decomposition. Water-Sui. 2018;10(4):416. doi:10.3390/w10040416
- Wang H, Tian CW, Wang WM, Luo XM. Time-series analysis of tuberculosis from 2005 to 2017 in China. Epidemiol Infect. 2018;146(8):935–939. doi:10.1017/S095026881800111529708082
- Deb M, Chakrabarty TK. A wavelet based hybrid SARIMA-ETS model to forecast electricity consumption. Elect J Appl Statistical Anal. 2017;10(2):408–430.
- Wu Z, Huang NE. Ensemble empirical mode decomposition: a noise-assisted data analysis method. Adv Adapt Data Anal. 2009;01(01):1–41. doi:10.1142/s1793536909000047
- Huang NE, Shen Z, Long SR. A new view of nonlinear water waves: the Hilbert spectrum. Annu Rev Fluid Mech. 1999;31(1):417–457.
- Zuo Z, Wang M, Cui H, et al. Spatiotemporal characteristics and the epidemiology of tuberculosis in China from 2004 to 2017 by the nationwide surveillance system. BMC Public Health. 2020;20(1):1284. doi:10.1186/s12889-020-09331-y32843011
- Bartholomew D, Box GEP, Jenkins GM. Time Series Analysis: Forecasting and Control. 5th ed. Hoboken, New Jersey: John Wiley and Sons Inc.; 2015:14.
- Qiu X, Ren Y, Suganthan PN, Amaratunga GAJ. Empirical mode decomposition based ensemble deep learning for load demand time series forecasting. Appl Soft Comput. 2017;54:246–255.
- Zhang X, Zhang Q, Zhang G, et al. Data-driven model for daily land surface temperature forecasting using long short-term memory neural network based on ensemble empirical mode decomposition. Int J Environ Res Public Health. 2018;15(5):1032. doi:10.3390/ijerph15051032
- Zhou Q, Jiang H, Wang J, Zhou J. A hybrid model for PM2.5 forecasting based on ensemble empirical mode decomposition and a general regression neural network. Sci Total Environ. 2014;496:264–274. doi:10.1016/j.scitotenv.2014.07.05125089688
- Jian Z, Yan R, Gao RX, Feng Z. Performance enhancement of ensemble empirical mode decomposition. Mech Syst Signal Process. 2010;24(7):P.2104–2123.
- Wang W, Chau K, Xu D, Chen X. Improving forecasting accuracy of annual runoff time series using ARIMA based on EEMD decomposition. Water Resources Manage. 2015;29(8):2655–2675.
- Wang Y, Xu C, Wu W, et al. Time series analysis of temporal trends in hemorrhagic fever with renal syndrome morbidity rate in China from 2005 to 2019. Sci Rep. 2020;10(1):9609. doi:10.1038/s41598-020-66758-432541833
- Liu Q, Li Z, Ji Y, et al. Forecasting the seasonality and trend of pulmonary tuberculosis in Jiangsu Province of China using advanced statistical time-series analyses. Infect Drug Resist. 2019;12:2311–2322. doi:10.2147/idr.s20780931440067
- Lam KC, Oshodi OS. Forecasting construction output: a comparison of artificial neural network and Box-Jenkins model. Eng Construction Arch Manage. 2016;23(3):302–322.
- Maleki A, Nasseri S, Aminabad MS, Hadi M. Comparison of ARIMA and NNAR models for forecasting water treatment plant’s influent characteristics. Ksce J Civil Eng. 2018;(6):1–13.
- Thoplan R. Simple v/s sophisticated methods of forecasting for Mauritius monthly tourist arrival data. Int J Stat Appl. 2014;4(5):217–223. doi:10.5923/j.statistics.20140405.01
- Zhou L, Jing X, Yu L, et al. Using a hybrid model to forecast the prevalence of schistosomiasis in humans. Int J Environ Res Public Health. 2016;13(4):355. doi:10.3390/ijerph1304035527023573
- Pao HT. Forecasting energy consumption in Taiwan using hybrid nonlinear models. Energy. 2009;34(10):1438–1446. doi:10.1016/j.energy.2009.04.026
- Saba AI, Elsheikh AH. Forecasting the prevalence of COVID-19 outbreak in Egypt using nonlinear autoregressive artificial neural networks. Process Saf Environ Protection. 2020;141:1–8. doi:10.1016/j.psep.2020.05.029
- Gao J, Li J, Wang M. Time series analysis of cumulative incidences of typhoid and paratyphoid fevers in China using both Grey and SARIMA models. PLoS One. 2020;15(10):e0241217. doi:10.1371/journal.pone.024121733112899
- Yu XY, Chen Z, Qi LX. Comparative study of SARIMA and NARX models in predicting the incidence of schistosomiasis in China. Mathematical Biosci Eng. 2019;16(4):2266–2276. doi:10.3934/mbe.2019112
- Yu L, Zhou L, Tan L, et al. Application of a new hybrid model with seasonal auto-regressive integrated moving average (ARIMA) and nonlinear auto-regressive neural network (NARNN) in forecasting incidence cases of HFMD in Shenzhen, China. PLoS One. 2014;9(6):e98241. doi:10.1371/journal.pone.009824124893000
- Chen Y, Leng K, Lu Y, et al. Epidemiological features and time-series analysis of influenza incidence in urban and rural areas of Shenyang, China, 2010-2018. Epidemiol Infect. 2020;148:e29. doi:10.1017/S095026882000015132054544
- Wang Y, Xu C, Zhang S, et al. Development and evaluation of a deep learning approach for modeling seasonality and trends in hand-foot-mouth disease incidence in mainland China. Sci Rep. 2019;9(1):8046. doi:10.1038/s41598-019-44469-931142826
- Nury AH, Hasan K, Alam MJB. Comparative study of wavelet-ARIMA and wavelet-ANN models for temperature time series data in northeastern Bangladesh. J King Saud Univ. 2017;29(1):47–61.
- Qi ZM. Neural network forecasting for seasonal and trend time series. Eur J Oper Res. 2005;501–514.
- Zhou L, Zhao P, Wu D, Cheng C, Huang H. Time series model for forecasting the number of new admission inpatients. BMC Med Inform Decis Mak. 2018;18(1):39. doi:10.1186/s12911-018-0616-829907102
- Wei W, Jiang J, Gao L, et al. A new hybrid model using an autoregressive integrated moving average and a generalized regression neural network for the incidence of tuberculosis in Heng County, China. Am J Trop Med Hyg. 2017;97(3):799–805. doi:10.4269/ajtmh.16-064828820678
- Wu W, Guo J, An S, et al. Comparison of two hybrid models for forecasting the incidence of hemorrhagic fever with renal syndrome in Jiangsu Province, China. PLoS One. 2015;10(8):e0135492. doi:10.1371/journal.pone.013549226270814
- Xu J, Xu K, Li Z, et al. Forecast of dengue cases in 20 Chinese cities based on the deep learning method. Int J Environ Res Public Health. 2020;17:2. doi:10.3390/ijerph17020453
- Hsu JL, Hsu TJ, Hsieh CH, Singaravelan A. Applying convolutional neural networks to predict the ICD-9 codes of medical records. Sensors (Basel, Switzerland). 2020;20:24. doi:10.3390/s20247116
- Wubuli A, Li Y, Xue F, Yao X, Upur H, Wushouer Q. Seasonality of active tuberculosis notification from 2005 to 2014 in Xinjiang, China. PLoS One. 2017;12(7):e0180226. doi:10.1371/journal.pone.018022628678873
- Sumi A, Kobayashi N. Time-series analysis of geographically specific monthly number of newly registered cases of active tuberculosis in Japan. PLoS One. 2019;14(3):e0213856. doi:10.1371/journal.pone.021385630883581
- Rios M, Garcia JM, Sanchez JA, Perez D. A statistical analysis of the seasonality in pulmonary tuberculosis. Eur J Epidemiol. 2000;16(5):483–488. doi:10.1023/a:100765332997210997837
- Fares A. Seasonality of tuberculosis. J Glob Infect Dis. 2011;3(1):46–55. doi:10.4103/0974-777X.7729621572609
- Willis MD, Winston CA, Heilig CM, Cain KP, Walter ND, Mac Kenzie WR. Seasonality of tuberculosis in the United States, 1993-2008. Clin Infect Dis. 2012;54(11):1553–1560. doi:10.1093/cid/cis23522474225
- Kim EH, Bae JM. Seasonality of tuberculosis in the Republic of Korea, 2006-2016. Epidemiol Health. 2018;40:e2018051. doi:10.4178/epih.e201805130486553
- Thorpe LE, Frieden TR, Laserson KF, Wells C, Khatri GR. Seasonality of tuberculosis in India: is it real and what does it tell us? Lancet. 2004;364(9445):1613–1614. doi:10.1016/s0140-6736(04)17316-915519633
- Tibet Autonomous Region Department of Tourism Development. Available from: http://lyfzt.xizang.gov.cn/. Accessed 1225, 2020.
- Li X, Li T, Tan S. Males, ages ≥ 45 years, businessperson, floating population, and rural residents may be considered high-risk groups for tuberculosis infection in Guangzhou, China: a review of 136,394 tb confirmed cases. Rev Inst Med Trop Sao Paulo. 2013;55(5):366–368. doi:10.1590/s0036-4665201300050001324037294
- Xiao Y, He L, Chen Y, et al. The influence of meteorological factors on tuberculosis incidence in Southwest China from 2006 to 2015. Sci Rep. 2018;8(1):10053. doi:10.1038/s41598-018-28426-629968800
- Rao HX, Zhang X, Zhao L, et al. Spatial transmission and meteorological determinants of tuberculosis incidence in Qinghai Province, China: a spatial clustering panel analysis. Infect Dis Poverty. 2016;5(1):45. doi:10.1186/s40249-016-0139-427251154
- Ganmaa D, Uyanga B, Zhou X, et al. Vitamin D supplements for prevention of tuberculosis infection and disease. N Engl J Med. 2020;383(4):359–368. doi:10.1056/NEJMoa191517632706534
- Rao H, Shi X, Zhang X. Using the Kulldorff’s scan statistical analysis to detect spatio-temporal clusters of tuberculosis in Qinghai Province, China, 2009-2016. BMC Infect Dis. 2017;17(1):578. doi:10.1186/s12879-017-2643-y28826399
- WHO. The End TB Strategy. 2014. Available from: https://wwwwhoint/tb/End_TB_brochurepdf. Accessed 1225, 2020.
- Bureau of statistics of Tibet Autonomous Region. Statistical Yearbook of Tibet 2020. Available from:http://tjj.xizang.gov.cn/. Accessed 1225, 2020.
- Guo J, Wang J. Sorangza. A survey of the knowledge of core information on tuberculosis prevention and control in Tibet Autonomous Region. World Latest Med Inf. 2020;19(73):217–219.