
Abstract
Purpose
We evaluated the differences between patients with SARS-CoV-2 Omicron variant infections and Fever outpatients, so that prevention and control measures can be taken in time.
Patients and Methods
This study retrospectively analyzed 65 patients with SARS-CoV-2 Omicron variant. Sixty-nine age- and sex-matched Fever outpatients were enrolled during the same period of time. We also reanalyzed data from 81 SARS-CoV-2 Wild-Type-infected patients. We compared the clinical characteristics and initial indexes of routine tests among the 3 groups.
Results
A total of 93.8% of the patients with Omicron infections had clinical symptoms, and the major symptoms were cough, fever and pharyngalgia. Pharyngalgia was a specific manifestation in Omicron group compared to Wild-Type group. The white blood cell of the Omicron group was lower than that of the Fever group [5.0 (3.6–6.1) vs 10.1 (7.6–12.9) ×109/L, P < 0.001]. The neutrophil count in Omicron group was lower than that in Fever and Wild-Type group [2.6 (1.8–3.9) vs 8.1 (5.9–10.9), P < 0.001; 2.6 (1.8–3.9) vs 3.4 (2.5–4.7) ×109/L, P < 0.001]. The white blood cell and neutrophil counts were lower in Omicron group than in the Fever group. The top 5 major symptoms were fever, cough, pharyngalgia, headache and expectoration.
Conclusion
There are differences between the patients with Omicron infections and Fever outpatients, both in clinical manifestations and initial routine hematology indicators. We hope to provide some clues for early identification combined with a history of living in the epidemic area.
Introduction
As of 24th July 2022, SARS-CoV-2 had infected over 570 million people, with more than 6.3 million deaths. SARS-CoV-2 continues to evolve by acquiring mutations as it continues to spread among humans. The number of infections caused SARS-CoV-2 B.1.1.529 Variant named Omicron is growing rapidly.Citation1 Omicron now accounted for 52.3% of the newly confirmed SARS-CoV-2 infections.Citation2 The Omicron variant seriously affects vaccine-induced immunity from serum neutralization.Citation3 It represents a serious threat to the control of the pandemic and treatment of the COVID-19 disease.Citation4
In European countries, researchers consider Omicron infections to be associated with significantly milder disease in the early phase compared to the Delta variant infections. Recent reports have revealed that Omicron exhibits a longer cycle of viral shedding and a decreased replication capacity, resulting in substantially attenuated lung pathology.Citation5,Citation6 Individuals infected with Omicron are asymptomatic or show mild symptoms, such as acute odynophagia, severe pharyngalgia and fever, similar to acute upper respiratory tract infections (URTIs), but few have radiographic changes in the lungs.Citation7,Citation8 URTIs usually associated with Influenza-like Illness (ILI), are defined as “Fever” (temperature of 37.8 °C or greater) and a cough and/or a sore throat without a known cause other than influenza.Citation9
As mainland China has a large population base and the proportion of elderly individuals (≥60 years), a large amount of resources have been invested to respond to Omicron.Citation10 Due to the hidden symptoms similar to those of URTIs, which mainly presents as fever, the strong spread of Omicron imposes new challenges to disease control.Citation11,Citation12 It is pressing to make a preliminary judgment on these two diseases through a fast method.
Numerous studies have shown that clinical symptoms and routine blood parameters can be used as potential biomarkers for predicting disease progression in patients with SARS-CoV-2 Wild-Type infections.Citation13,Citation14 Specific clinical manifestations and laboratory parameters may contribute to early risk stratification and prognosis in COVID-19 patients. But, the analysis of clinical symptoms and routine blood parameters for Omicron is limited.Citation15–17 Here, we investigated the initial manifestations and hematological parameters of 65 patients with Omicron infections and matched 69 age- and sex-matched Fever outpatients, aiming to identify the differences between these two diseases and provide data support for the early identification of Omicron infections.
Materials and Methods
Cohort Selection
A total of 157 patients infected with SARS-CoV-2 Omicron variant in Taizhou Public Health Center from March 29, 2022, to April 18, 2022, were enrolled in the study (named the Omicron group). Clinical diagnosis and classifications were made according to the Chinese management guideline for COVID-19 (version 9.0).Citation18 A total of 144 SARS-CoV-2 Wild-Type infected patients in Taizhou Public Health Center from January 16, 2020, to April 1, 2020, were also enrolled in the study (named the Wild-Type group). Patients under 18 years old with concomitant disease and no data were excluded, leaving 65 Omicron and 81 Wild-Type patients in the study (see ).
Figure 1 Flow chart of the study.
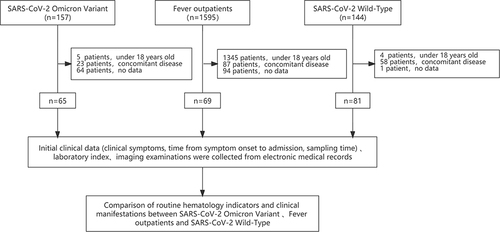
We also included 1595 patients with fever who visited the Fever Clinic Department of Enze Medical Center from April 6, 2022, to April 30, 2022, as Fever group. All patients were identified as not having SARS-CoV-2 infection by negative results from a nucleic acid amplification test (NAAT). The exclusion criteria were as follows: (1) patients aged under 18 years; (2) patients with concomitant disease, including cancer, autoimmune diseases, enteritis, hypertension and diabetes; and (3) patients with incomplete information records. The remaining 69 patients were included. Fever patients were age- and sex-matched with patients in the Omicron group (see ).
At the same time, initial clinical data (including clinical symptoms, the time from symptom onset to admission, and sampling time) and data from imaging examinations were collected from electronic medical records. The endpoint of follow-up was May 7, 2022.
This study obtained approval from the Medical Ethics Committee of Taizhou Hospital, Zhejiang Province, China, and informed consent was obtained from each enrolled subject.
Biological Detection and Clinical Information Record
Two milliliters of peripheral blood samples treated with EDTA-K2 anticoagulant were measured for blood routine tests. The white blood cell count, neutrophil, lymphocyte, monocyte and eosinophil counts were detected using a Sysmex 2100D hematology analyzer (Kobe, Japan) in Omicron group and Wild-Type group, while in the Fever group, a Sysmex XE2100 routine hematology analyzer (Kobe, Japan). C-reactive protein analyzer PA-990 (Lifotronic, China) and Automatic real-time detection analyzer for specific proteins Ottoman-1000 (Upper, China) in Omicrongroup and Fever group and Wild-Type group, respectively.
The Nucleic Acid Extraction Reagent (Magnetic Beads) (Wuhan Easydiagnosis Biomedicine, China) and Automatic Nucleic Acid Extraction and Purification Instrument (Wuhan Easydiagnosis Biomedicine, China) were used to extract nucleic acids from the samples according to the manuals. Real-time PCR (RT-PCR) was performed using a COVID-19 (SARS-CoV-2) Nucleic Acid Test Kit (Wuhan Easydiagnosis Biomedicine, China) and a 7500 Real-Time PCR System (Applied Biosystems, USA) according to the manuals to determine the nucleic acid level of SARS-CoV-2. The results were interpreted by professionals. Ct values ≥38 were interpreted as negative results.
Clinical data for these patients were curated from the electronic medical record system, including epidemiological characteristics, sex, age, BMI, symptoms, chest CT results, the number of days from onset to admission and length of stay. The clinical symptoms included fever (temperature >37 °C), cough, pharyngalgia, headache, expectoration, stuffiness, muscle soreness, chest tightness and diarrhea.
Statistical Analysis
Categorical variables are reported as numbers (percentages), and the continuous variables are expressed in the median (interquartile range [IQR]). We included more than 15% of the clinical symptoms in the Omicrongroup and Fever groups for subsequent statistical analysis of routine blood indicators. The chi square or Fisher’s exact test was used to measure the differences between categorical variables. The difference of routine blood index was detected by the Mann–Whitney U-test. IBM SPSS 26 software (SPSS Inc., Chicago, IL, USA) was used for data analysis, and P < 0.05 was considered statistically significant.
Results
Clinical Information of the Study Cohorts
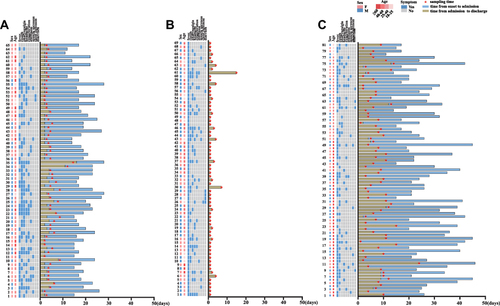
The study included 65 patients infected with the Omicron variant, 69 age- and sex-matched Fever outpatients, as well as 81 patients infected with the SARS-CoV-2 prototype strain. The basic characteristics of the study subjects are shown in and . The median ages were 33.0 years for the Omicron group, 36.0 years for the Fever group and 44.0 years for the Wild-Type group. A total of 53.8% of the patients in the Omicron group were male. The mean days from symptom onset to hospitalization were 2 days for the Omicron group, 1 day for the Fever group, and 7 days for the Wild-type group. The length of stay in the Omicron group was shorter than that in the Wild-Type group. A total of 93.8% of the patients with Omicron infections had clinical features, and the major symptom was cough, followed by fever, pharyngalgia, headache, and expectoration. The rates of cough were higher than those in the Fever group (58.4% vs 26.1%; P < 0.001). Compared to the Wild-Type group, the Omicron group was more likely to have pharyngalgia and headache (49.2% vs 11.1%, P < 0.001; 29.2% vs 9.9, P = 0.005). Imaging examinations were performed for 41 patients in the Omicron group, among them, a total of 36.6% had abnormal chest radiographs, which was much lower than that in the Wild-Type group (100%, P < 0.001). The common radiological findings were pulmonary plaques or ground-glass opacities. Six patients in the fever group had abnormal chest radiographs among Fever group.
Table 1 Baseline Characteristics of the Patients
Figure 2 Clinical symptoms, time of patients progression. (A) Omicron group; (B) Fever group; (C) Wild-Type group.
Comparison of Initial Peripheral Blood Cells Indices and CRP Levels of the Omicron, Fever and Wild-Type Groups
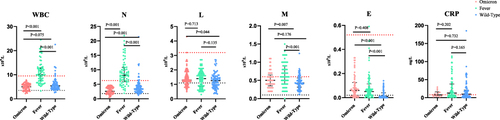
The white blood cell count of Omicron patients was lower than that of Fever group [5.0 (3.6–6.1) vs 10.1 (7.6–12.9) ×109/L, P < 0.001]. The white blood cell count of all patients in the Omicron group was no more than 7.8×10⁹/L (range from 2.1×10⁹/L to 7.8×10⁹/L), and 4 patients had counts than 3×10⁹/L, while 72.4% of the Fever outpatients had counts above 7.8×10⁹/L. The neutrophil count were lower in the Omicron group than those in the Fever and Wild-Type group [2.6 (1.8–3.9) vs 8.1 (5.9–10.9), P < 0.001; 2.6 (1.8–3.9) vs 3.4 (2.5–4.7) ×109/L, P = 0.001]. The lymphocyte count and eosinophil count in the Omicron group were higher than those in Wild-Type patients [1.4 (1.1–1.9) vs 1.3 (0.9–1.5)×109/L, P = 0.044; 0.06 (0.02–0.13) vs 0.01 (0.00–0.04)×109/L, P < 0.001] (see , ).
Figure 3 Comparison of initial indexes of peripheral blood cell indices and CRP of Omicron, Fever and Wild-Type. The count of white blood cell, neutrophil, lymphocyte, monocyte, eosinophil between and CRP of Omicron, Fever and Wild-Type group were 5.0 (3.6–6.1) vs 10.1 (7.6–12.9) vs 5.4 (4.3–6.4)×109/L, 2.6 (1.8–3.9) vs 8.1 (5.9–10.9) vs 3.4 (2.5–4.7)×109/L, 1.3 (1.1–1.9) vs 1.4 (0.9–1.8) vs 1.3 (0.9–1.5)×109/L, 0.5 (0.4–0.7) vs 0.6 (0.4–0.9) vs 0.4 (0.3–0.6)×109/L, 0.06 (0.02–0.13) vs 0.05 (0.02–0.11) vs 0.01 (0.00–0.04)×109/L, 7.8 (4.3–16.3) vs 12.9 (5.0–37.9) vs 9.9 (3.8–21.5) mg/L.
Comparison of Initial Peripheral Blood Cells Indices Between the Omicron and Fever Patients with Different Symptoms
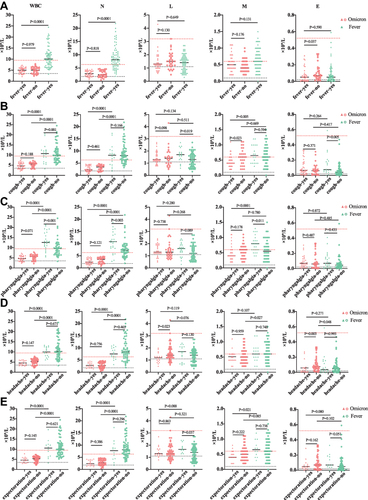
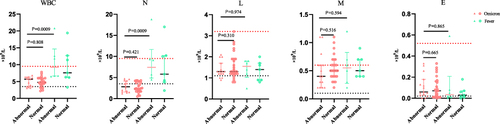
We compared initial peripheral blood cell indices between the Omicron and Fever group for the following 5 major symptoms as fever, cough, pharyngalgia, headache, and expectoration (see ). The white blood cell count and neutrophil count were lower in the Omicron group than Fever group for the 5 major symptoms (fever, cough, pharyngalgia, headache, and expectoration, P < 0.001). Patients with Omicron infections and headache had lower lymphocyte and eosinophil counts [1.2 (0.9–1.3) vs 1.4 (1.2–1.9) ×109/L, P = 0.023; 0.02 (0.01–0.06) vs 0.08 (0.05–0.14) ×109/L, P = 0.023]. The monocyte count was lower in patients with cough [0.4 (0.3–0.6) vs 0.6 (0.4–0.8) ×109/L, P = 0.023]. Moreover, patients with fever had lower eosinophil counts (0.05 (0.01–0.09) vs 0.07 (0.04–0.15) ×109/L, P = 0.037).
Figure 4 Comparison of initial peripheral blood cell indices between Omicron and Fever in different symptom. (A) The patient presents with fever, The count of white blood cell, neutrophil, lymphocyte, monocyte and eosinophil of Omicron group were 5.0 (3.8–6.0) vs 5.0 (3.5–6.3) ×109/L; 2.9 (1.9–3.9) vs 2.5 (1.6–4.1).×109/L; 1.3 (1.0–1.6) vs 1.5 (1.2–1.9)×109/L; 0.5 (0.4–0.7) vs 0.4 (0.3–0.6)×109/L; 0.05 (0.01–0.09) vs 0.07 (0.04–0.15)×109/L. (B) The patient presents with cough, The count of white blood cell, neutrophil, lymphocyte, monocyte and eosinophil of Omicron group were 4.7 (3.4–6.0) vs 5.6 (4.3–6.1).×109/L; 2.4 (1.8–3.9) vs 3.4 (1.9–4.0)×109/L; 1.3 (1.2–1.8) vs 1.4(0.9–1.9)×109/L; 0.4 (0.3–0.6) vs: 0.6(0.4–0.8)×109/L; 0.4 (0.3–0.6) vs 0.6(0.4–0.8)×109/L. (C) The patient presents with pharyngalgia, The count of white blood cell, neutrophil, lymphocyte, monocyte and eosinophil of Omicron group were 4.6 (3.4–5.7) vs 5.6 (4.1–6.4).×109/L; 2.4 (1.7–3.8) vs 3.5 (1.9–4.1)×109/L; 1.3 (1.2–1.9) vs 1.3(1.0–1.7)×109/L; 0.4 (0.3–0.6) vs 0.6 (0.4–0.7)×109/L, 0.07 (0.03–0.13) vs 0.06 (0.01–0.15)×109/L. (D): The patient presents with headache, The count of white blood cell, neutrophil, lymphocyte, monocyte and eosinophil of Omicron group were 4.4 (3.5–5.8) vs 5.4 (4.0–6.3) ×109/L; 2.6 (1.8–3.7) vs 2.7 (1.8–4.0)×109/L; 1.2 (0.9–1.3) vs 1.4 (1.2–1.9)×109/L; 0.5 (0.4–0.6) vs 0.5 (0.3–0.7)×109/L; 0.02 (0.01–0.06) vs 0.08 (0.05–0.14)×109/L. (E) The patient presents with expectoration, The count of white blood cell, neutrophil, lymphocyte, monocyte and eosinophil of Omicron group were 4.6 (3.4–5.6) vs 5.4 (3.9–6.3)×109/L; 2.4 (1.7–3.9) vs 2.8 (1.9–4.0)×109/L; 1.3 (1.2–1.7) vs 1.3 (1.0–1.9)×109/L; 0.4 (0.4–0.6) vs 0.5 (0.3–0.7)×109/L; 0.05 (0.03–0.08) vs 0.07 (0.02–0.15)×109/L.
Comparison of the Peripheral Blood Cell Indices in Omicron Patients with Varying Lung Imaging results
We compared initial peripheral blood cell indices between the Omicron group and the Fever group in patients with varying chest radiographs (see ). Patients with abnormal chest radiographs in the Omicron group had lower white blood cell and neutrophil counts in Omicron group than those in the Fever group [4.8 (3.8–6.0) vs 5.7 (3.5–6.3)×109/L, 3.0 (1.6–4.2) vs 2.4 (1.7–3.9) ×109/L]. In the Omicron group, there was no statistical significance of routine blood indices in patients whether with abnormal chest radiographs.
Figure 5 Comparison of the peripheral blood cell indices in of Omicron patients and Fever with variant Lung imaging. The count of white blood cell, neutrophil, lymphocyte, monocyte and Eosinophil of Omicron patients with opposite Lung imaging were 5.7 (3.5–6.3) vs 4.8 (3.8–6.0)×109/L; 3.0 (1.6–4.2) vs 2.4 (1.7–3.9) ×109/L; 1.3 (1.2–1.7) vs 1.3 (1.2–1.9)×109/L; 0.4 (0.2–0.6) vs 0.5 (30.4–0.7)×109/L; 0.06 (0.03–0.18) vs 0.07 (0.01–0.16)×109/L.
Discussion
In this study, we included age- and sex-matched patients with Omicron infections (n = 65) and Fever outpatients (n = 69) during the same period, and their initial clinical features and laboratory tests were compared to identify the distinctions. We found interesting differences between patients with Omicron infections and Fever outpatients. The main clinical manifestations of Omicron patients were cough and pharyngalgia, and their white blood cell count was much lower.
Lindsey Wang et alCitation19 found that all patients generally showed mild symptoms as pharyngalgia, fever, headache and cough in 14,054 patients with Omicron infections in the USA. Studies have emphasized that Omicron may have rhinophilia due to a spike D614G mutation leading to higher upper respiratory tract virtual loads present and upper respiratory symptoms such as cough and pharyngalgia.Citation20 Our data showed that the proportion of patients with symptoms in the Omicron group was lower than that in the Fever group, and the main manifestations were cough and pharyngalgia analogously. These mild clinical features were consistent with recent other study on the Omicron variant.Citation21,Citation22 Obviously, the rate of cough in the Omicron group was higher than that in the Fever group. Compared with the Wild-Type group, the Omicron group was more likely to have pharyngalgia and headache. The difference of early clinical symptoms is helpful for clinicians to make a preliminary judgment on patients primarily performed with fever.Citation23
The routine blood indicators of the three groups showed that the white blood cell counts of the Omicron group were all below 7.8 ×10⁹/L. The neutrophil count of the Omicron group was significantly much lower than those of Fever and Wild-Type group. The distributions of white blood cell count are extremely similar between Omicron group and the Wild-Type group,Citation11,Citation24–27 which was consistent with the characteristics of SARS-COV-2 infection. As the CRP level was the most effective blood value in determining the progression of the COVID-19,Citation28,Citation29 our data showed a reduction of CRP levels in the Omicron group, although the difference was not statistically significant. Such a trend of CRP levels could prove that Omicron infections had milder conditions than those in the Fever group and Wild-Type group. For fever patients, the specific reduction in the white blood cell count and neutrophil count can help clinicians make a preliminary judgment for the disease early identification.
In this study, we also found that the white blood cell count and neutrophil count in the Omicron group were lower than those in patients with the same top 5 symptoms in Fever group, and the lymphocyte and eosinophil counts of patients in Omicron group with headache were significantly reduced. A consensus trend was also found in the Omicron group with abnormal CT imaging features, although the difference was not statistically significant. Previous studies on blood routine indices of patients with Wild-Type SARS-COV-2 showed that lymphocyte and eosinophil counts in severe patients were significantly reduced compared with those in non-severe patientsCitation28,Citation30. Therefore, due to the almost continuous COVID-19 pandemic, we proposed that more attention should be given to Fever outpatients who are with headache and abnormal CT imaging features .
However, this study also has some limitations. First, it had a small sample from a single center, so external validation is required in large sample and multicenter studies. It would be more accurate and objective to establish a parametric rating scale with enough indicators for distinguishing Omicron infections from Fever outpatients with enough indicators. Second, the pathogenesis of the Fever outpatients could not be determined due to a lack of etiological tests. Third, routine hematology indicators are the only available laboratory data, and further research is required.
Conclusions
Since Omicroninfections are more likely to manifest as URTI, many European countries have adopted a strategy of herd immunity and coexistence with the virus. Regardless, our study provided a new insight for answering the question: is Omicron variant infection equal to URTI? We collected and analyzed the real-world clinical data, and found that there were differences between Omicron infections and Fever outpatients. Omicron infections had a higher incidence of cough and pharyngalgia and a lower white blood cell count. As the COVID-19 prevention and control are difficult, patients with fever are encouraged to undergo NAATs, this research provides a basic reference for the stratified management of Fever outpatients. Our work could reduce the pressures on the Fever Clinic. Although Omicron infections could be diagnosed through NAATs, we hope our study can provide some clues for early identification combined with a history of living in the epidemic area.
Ethical Approval Information
The study was conducted according to the guidelines of the Declaration of Helsinki and approved by the Institutional Medical Ethics Review Board of Taizhou Hospital of Zhejiang Province (No: K20220133; date of approval: 31 January 2022).
Author Contributions
All authors made a significant contribution to the work reported, whether that is in the conception, study design, execution, acquisition of data, analysis and interpretation, or in all these areas; took part in drafting, revising or critically reviewing the article; gave final approval of the version to be published; have agreed on the journal to which the article has been submitted; and agree to be accountable for all aspects of the work.
Disclosure
The authors declare no competing interests.
Acknowledgments
We would like to thank the nurses in Taizhou Hospital of Zhejiang Province for sampling specimens and thank the patients for being enrolled in this study.
References
- Kawaoka Y, Uraki R, Kiso M, et al. Characterization and antiviral susceptibility of SARS-CoV-2 Omicron/BA.2. Res Sq. 2022. doi:10.21203/rs.3.rs-1375091/v1
- Wang L, Berger NA, Kaelber DC, et al. Incidence rates and clinical outcomes of SARS-CoV-2 infection with the omicron and delta variants in children younger than 5 years in the US. JAMA Pediatr. 2022;176(8):811–813. doi:10.1001/jamapediatrics.2022.0945
- Koelle K, Martin MA, Antia R, et al. The changing epidemiology of SARS-CoV-2. Science. 2022;375(6585):1116–1121. doi:10.1126/science.abm4915
- Zhang X, Zhang W, Chen S. Shanghai’s life-saving efforts against the current omicron wave of the COVID-19 pandemic. Lancet. 2022;399(10340):2011–2012. doi:10.1016/S0140-6736(22)00838-8
- He X, Hong W, Pan X, et al. SARS-CoV-2 Omicron variant: characteristics and prevention. MedComm. 2021;2(4):838–845. doi:10.1002/mco2.110
- Planas D, Saunders N, Maes P, et al. Considerable escape of SARS-CoV-2 Omicron to antibody neutralization. Nature. 2022;602(7898):671–675. doi:10.1038/s41586-021-04389-z
- Shuai H, Chan JF, Hu B, et al. Attenuated replication and pathogenicity of SARS-CoV-2 B.1.1.529 Omicron. Nature. 2022;603(7902):693–699. doi:10.1038/s41586-022-04442-5
- Jia L, Xu M, Hao M, et al. Comparison of microbial composition and diversity in the upper respiratory tract between SARS-CoV-2 and influenza virus infections[J]. Sci China Life Sci. 2022;65(7):1469–1472. doi:10.1007/s11427-021-2092-1
- Influenza Surveillance: purpose and methods. Available from: https://www.cdc.gov/flu/weekly/overview.htm. Accessed August 18, 2022.
- Cai J, Deng X, Yang J, et al. Modeling transmission of SARS-CoV-2 Omicron in China. Nat Med. 2022;28(7):1468–1475. doi:10.1038/s41591-022-01855-7
- Dejnirattisai W, Huo J, Zhou D, et al. SARS-CoV-2 Omicron-B.1.1.529 leads to widespread escape from neutralizing antibody responses. Cell. 2022;185(3):467–484. doi:10.1016/j.cell.2021.12.046
- Torjesen I. Covid-19: omicron may be more transmissible than other variants and partly resistant to existing vaccines, scientists fear. BMJ. 2021;375:n2943. doi:10.1136/bmj.n2943
- Lu G, Wang J. Dynamic changes in routine blood parameters of a severe COVID-19 case[J]. Clin Chim Acta. 2020;508:98–102. doi:10.1016/j.cca.2020.04.034
- Huyut M, Üstündağ H. Prediction of diagnosis and prognosis of COVID-19 disease by blood gas parameters using decision trees machine learning model: a retrospective observational study. Med Gas Res. 2022;12(2):60–66. doi:10.4103/2045-9912.326002
- Huyut MT, Velichko A. Diagnosis and Prognosis of COVID-19 disease using routine blood values and LogNNet neural network. Sensors. 2022;22(13):4820. doi:10.3390/s22134820
- Zhou K, Sun Y, Li L, et al. Eleven routine clinical features predict COVID-19 severity uncovered by machine learning of longitudinal measurements. Comput Struct Biotechnol J. 2021;19:3640–3649. doi:10.1016/j.csbj.2021.06.022
- Bi X, Su Z, Yan H, et al. Prediction of severe illness due to COVID-19 based on an analysis of initial fibrinogen to albumin ratio and Platelet count. Platelets. 2020;31(5):674–679. doi:10.1080/09537104.2020.1760230
- Diagnosis and Treatment Protocols for COVID-19 (9th trial edition). Available from: http://www.gov.cn/xinwen/2022-06/28/5698168/files/9585944023424f45a4b4d522b5f5c034.pdf. Accessed August 18, 2022.
- Wang L, Berger NA, Kaelber DC, et al. Comparison of outcomes from COVID infection in pediatric and adult patients before and after the emergence of Omicron. medRxiv. 2022. doi:10.1101/2021.12.30.21268495
- Korber B, Fischer WM, Gnanakaran S, et al. Tracking changes in SARS-CoV-2 Spike: evidence that D614G increases infectivity of the COVID-19 Virus. Cell. 2020;182(4):812–827. doi:10.1016/j.cell.2020.06.043
- Kim M, Lee B, Choi YY, et al. Clinical characteristics of 40 patients infected with the SARS-CoV-2 Omicron Variant in Korea. J Korean Med Sci. 2022;37(3):e31. doi:10.3346/jkms.2022.37.e31
- Chu H, Yuen K. Pathogenicity of SARS‐CoV‐2 Omicron. Clin Transl Med. 2022 May;12(5):e880. doi:10.1002/ctm2.880
- Carreno JM, Alshammary H, Tcheou J, et al. Activity of convalescent and vaccine serum against SARS-CoV-2 Omicron. Nature. 2022;602(7898):682–688. doi:10.1038/s41586-022-04399-5
- Chen N, Zhou M, Dong X, et al. Epidemiological and clinical characteristics of 99 cases of 2019 novel coronavirus pneumonia in Wuhan, China: a descriptive study. Lancet. 2020;395(10223):507–513. doi:10.1016/S0140-6736(20)30211-7
- Mannar D, Saville JW, Zhu X, et al. SARS-CoV-2 Omicron variant: antibody evasion and cryo-EM structure of spike protein-ACE2 complex. Science. 2022;375(6582):760–764. doi:10.1126/science.abn7760
- Huang C, Wang Y, Li X, et al. Clinical features of patients infected with 2019 novel coronavirus in Wuhan, China. Lancet. 2020;395(10223):497–506. doi:10.1016/S0140-6736(20)30183-5
- Wu Y, Huang X, Sun J, et al. Clinical Characteristics and Immune Injury Mechanisms in 71 Patients with COVID-19. mSphere. 2020;5(4). doi:10.1128/mSphere.00362-20
- Huyut MT, Ilkbahar F. The effectiveness of blood routine parameters and some biomarkers as a potential diagnostic tool in the diagnosis and prognosis of Covid-19 disease[J]. Int Immunopharmacol. 2021;98:107838. doi:10.1016/j.intimp.2021.107838
- Sun C, Xie C, Bu GL, et al. Molecular characteristics, immune evasion, and impact of SARS-CoV-2 variants. Signal Transduct Target Ther. 2022;7(1):202. doi:10.1038/s41392-022-01039-2
- Zheng Y, Zhang Y, Chi H, et al. The hemocyte counts as a potential biomarker for predicting disease progression in COVID-19 a retrospective study[J]. Clin Chem Lab Med. 2020;58:1106–1115. doi:10.1515/cclm-2020-0377