
Abstract
Objective
To investigate whether benchtop auto-analyzers (AAs) and arterial blood gas (ABG) analyzers, for measuring electrolyte levels of patients admitted to intensive care units (ICU), are equal and whether they can be used interchangeably.
Materials and method
This study was conducted on 98 patients admitted to the ICU of the Institute of Medicine, Kathmandu, Nepal between 15 October and 15 December 2016. The sample for AA was collected from the peripheral vein through venipuncture, and that for ABG analyzer was collected from radial artery simultaneously. Electrolyte levels were measured with ABG analyzer in the ICU itself, and with benchtop AA in the central clinical biochemistry laboratory.
Results
The mean value for sodium by AA was 144.6 (standard deviation [SD] 7.63) and by ABG analyzer 140.1 (SD 7.58), which was significant (p-value <0.001). The mean value for potassium by AA was 3.6 (SD 0.52) and by ABG analyzer 3.58 (SD 0.66). The Bland-Altman analysis with the 95% limit of agreement between methods were −4.45 to 13.11 mmol/L for sodium and the mean difference was 4.3 mmol/L and −1.15 to 1.24 mmol/L for potassium and the mean difference was 0.04 mmol/L. The United States Clinical Laboratory Improvement Amendments accepts a 0.5 mmol/L difference in measured potassium levels and a 4 mmol/L difference in measured sodium levels, in the gold standard measure of the standard calibration solution. The passing and Bablok regression with 95% confidence interval has an intercept of zero and slope one for both sodium and potassium, and the 95% of random difference is −6.32 to 6.32 for sodium and −0.84 to 0.84 for potassium, showing no significant deviation from linearity.
Conclusion
It can be concluded that AA and ABG analyzers may be used interchangeably for measurement of potassium in the Institute of Medicine, while the same cannot be concluded for the measurement of sodium, because of the significant difference in sodium measurement by the two instruments.
Video abstract
Point your SmartPhone at the code above. If you have a QR code reader the video abstract will appear. Or use:
Introduction
Ion-selective electrode (ISE) is the most routinely used method for electrolyte estimation in clinical laboratories. There are two types of ISE measurements based on sample preparation. Direct ISE uses an undiluted sample to interact with ISE membrane, and the devices based on indirect ISE use preanalytical dilution. Direct ISE may use whole blood as in the case of an arterial blood gas (ABG) analyzer, or may use serum as in the case of benchtop auto-analyzers (AAs).
Studies using different devices have reported different results. It is, therefore, important to determine the concordance of electrolyte values obtained by various methods. Moreover, there are a lot of studies comparing the results of electrolytes in an arterial sample processed by an ABG analyzer, and serum sample processed by a benchtop AA, both of which use the direct ISE method without any need for pre-dilution of the sample. The present study was done with the objective to investigate whether the results from ABG analyzers and AAs are equal when used to assess electrolyte levels (sodium and potassium), in the Institute of Medicine (IOM), Kathmandu.
Materials and method
A cross-sectional observational study was conducted for a period of 2 months, ie, 10 October to 10 December 2016, in the Central Biochemistry Laboratory and intensive care unit (ICU) of IOM. Ethical clearance to conduct the study was obtained from the Institutional Research Board of IOM reference number 293(6-11-E)2/073/074. Oral consent was taken from patients to be part of this research. The sample from patients admitted to the ICU was included in the study. We maintained a record of electrolyte results from ABG analyzers and benchtop AA for those cases from whom simultaneous arterial and venous blood was drawn. The serum sample was obtained by withdrawing 3 mL of venous blood in a plain vacutainer through venipuncture under aseptic conditions. The arterial sample was collected in a 2 mL plastic syringe in a sterile environment. The syringe was flushed thoroughly with a solution of liquid heparin (1:10,000), which was removed completely before drawing the sample. Quality control was ensured by having the blood samples collected by trained staff of the ICU and analyzed on a benchtop AA located in the central laboratory, and ABG machine located in the ICU under similar environmental conditions, and calibrated using standard protocol.
ABG samples received in heparinized syringes were processed immediately for electrolytes, and the samples received in vacutainers for serum were centrifuged within 30 minutes after collection. Electrolytes were measured with a benchtop AA (Fully Automated Electrolyte Analyzer EX-D, JOKOH CO. LTD, Japan) and with an ABG analyzer (pHox Ultra, Nova Biomedical, Waltham, MA, USA). Both instruments work on the principle of direct ISE. The reference ranges for sodium and potassium were taken as 135–145 mmol/L and 3.5–5.2 mmol/L, respectively.
Statistical analysis was done using MedCalc statistics software version 17.2. Agreement between the two analyzers was assessed using the Bland-Altman approach.Citation1,Citation2 Limit of agreement was defined as mean bias ± 2 standard deviation (SD). We used a mountain plot to compare different distributions between methods as a complementary plot to Bland-Altman findings.Citation3 The mountain plot provides information about the distribution of the differences between methods.Citation1 If two assays are unbiased with respect to each other, the mountain will be centered over zero and long tails in the plot reflect large differences between the methods.Citation4 Passing and Bablok plot was used to estimate agreement between two methods and to check for linear model validity.Citation5–Citation7
Results
The mean sodium level measured by ABG analyzer and benchtop AA was 140.1 (±7.58) mmol/L and 144.6 (±7.63) mmol/L, respectively, as shown in .Citation1 A Bland-Altman comparison of AA and ABG analyzer for the sodium measurement results revealed that the limits of agreement were between −4.45 to 13.1 and the mean difference was 4.3 mmol/L ().Citation8 Similarly, for potassium the limit of agreement ranged from −1.15 to 1.24 and the mean difference was 0.04 mmol/L. The mountain plot is shown in as a complementary plot to Bland-Altman plot.Citation1,Citation5 Likewise, Passing and Bablok regression with 95% confidence interval (CI) has an intercept of zero, showing no systematic differences and slope one, showing no proportional differences in both sodium and potassium measurements by the two instruments.Citation5–Citation7 The 95% CI is −6.32 to 6.32 for sodium and −0.84 to 0.84 for potassium. The cumulative sum test for linearity shows a p-value 0.10 for sodium and 0.85 for potassium, signifying no significant deviation from linearity (). The United States Clinical Laboratory Improvement Amendments (US CLIA) accepts a 0.5 mmol/L difference in measured potassium levels and a 4 mmol/L difference in measured sodium levels, in the gold standard measure of the standard calibration solution. In this scenario, even though the methods of measurement of the two instruments are comparable, the mean difference of sodium between AA and ABG analyzer was 4.3 mmol/L, which is not within the acceptable limit for sodium as defined by the US CLIA.
Figure 1 Bland-Altman plot of sodium (A) and potassium (B).
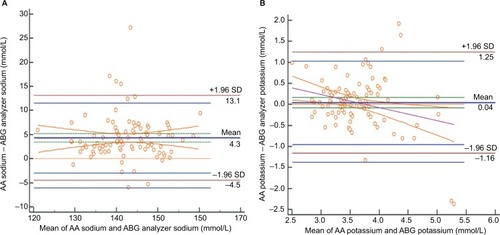
Figure 2 Mountain plot for sodium (A) and potassium (B).
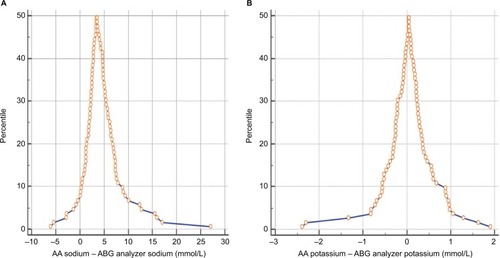
Figure 3 Passing and Bablok regression analysis of sodium (A) and potassium (B).
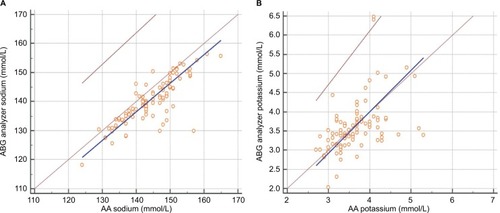
Table 1 Comparision of statistics obtained from AA and ABG analyzer for sodium and potassium
Discussion
From the dawn of civilization, human beings have been developing new technologies for the benefit of society. Similarly, automation has brought a revolution to the biochemistry analyzing process. The discovery of new techniques has provided options to choose various instruments for analyzing data of the analytes. Thus, we need to analyze variations among different methods used in hospitals for the benefit of the patient.
Electrolyte abnormalities are one of the common reversible causes of morbidity and mortality in patients admitted to the ICU. Moreover, signs and symptoms of electrolyte disorder may be nonspecific in ICU patients. The levels of electrolytes need to be monitored on a regular basis in these patients, which are ordered in ABG or serum sample, as per the convenience of sampling and requirement. The results of both types of measurements are used in an interchangeable manner with the assumption that they are equal. On average, 150–160 samples for electrolyte estimation are ordered every day in the biochemistry lab, and 40–50 samples are ordered every day for ABG analysis in ICU in the IOM. We included only those patients from whom simultaneous arterial and venous blood could be drawn.
Various types of instruments are available for measurement of electrolytes, and every institution should establish their own protocol for acceptance of the results obtained by these instruments. The use of different techniques is not a limitation in the present study, as we have compared results of two instruments using the direct ISE method.
The mean difference for potassium between AA and ABG was 0.04 mmol/L. The magnitude of difference in our study was consistent with the literature data, as reported earlier.Citation9 The US CLIA accepts a 0.5 mmol/L difference in measured potassium levels, and a 4 mmol/L difference in measured sodium levels, in the gold standard measure of the standard calibration solution. The value for potassium was within the acceptable limits of the US CLIA.Citation10 Furthermore, there was a strong correlation between the results of the two instruments, concomitant with the acceptable 95% limits of agreement in the Bland-Altman analysis. The mean difference in the measurement of sodium by the two instruments is 4.3 mmol/L, which is not within the acceptable limits as per the US CLIA. The use of different heparin volumes for flushing ABG sampling syringes dilute the whole blood and lower the levels of measured electrolytes in ABG testing, which could provide a meaningful explanation for lower values of electrolytes measured by the ABG machine. Since the normal range for sodium is higher than potassium, sodium values might be largely affected by dilution, giving lower values in ABG machine than AA. The study agrees with previous studies that sodium values obtained from ABG machines are not reliable for making clinical decisions.Citation11 The small sample size and use of different volumes of heparin for ABG samples, are limitations of the study.
Conclusion
It can be concluded that benchtop AAs and ABG analyzers may be used interchangeably for measurement of potassium in the IOM, while the same cannot be concluded for the measurement of sodium because of the significant difference in sodium measurements by the two instruments.
Disclosure
The authors report no conflicts of interest in this work.
References
- AltmanDGBlandJMMeasurement in medicine: the analysis of method comparison studiesStatistician198332307317
- FernandezRFernandezGValidating the Bland-Altman Method of AgreementWest Users SAS Softw 2009 Proc1986117 Available from: http://www.wuss.org/proceedings09/09WUSSProceedings/papers/pos/POS-Fernandez.pdfAccessed January 9, 2017
- KrouwerJSMontiKLA simple, graphical method to evaluate laboratory assaysEur J Clin Chem Clin Biochem19953385255288547437
- medcalc.org [homepage on the Internet]Software M. MedCalc2017Accessed April 24, 2017
- LinnetKPerformance of Deming regression analysis in case of misspecified analytical error ratio in method comparison studiesClin Chem1998445102410319590376
- MartinRFGeneral deming regression for estimating systematic bias and its confidence interval in method-comparison studiesClin Chem200046110010410620577
- DesignEPassing-Bablok Regression for Method Comparison:1 −12 Available from: https://ncss-wpengine.netdna-ssl.com/wp-content/themes/ncss/pdf/Procedures/NCSS/Passing-Bablok_Regression_for_Method_Comparison.pdfAccessed January 9, 2017
- GiavarinaDUnderstanding Bland Altman analysisBiochem Med (Zagreb)201525214115126110027
- ZhangJBLinJZhaoXDAnalysis of bias in measurements of potassium, sodium and hemoglobin by an emergency department-based blood gas analyzer relative to hospital laboratory autoanalyzer resultsPloS One2015104e012238325849375
- EhrmeyerSSLaessigRHLeinweberJEOryallJJ1990 Medicare/CLIA final rules for proficiency testing: minimum intralaboratory performance characteristics (CV and bias) needed to passClin Chem19903610173617402170059
- MorimatsuHRocktäschelJBellomoRUchinoSGoldsmithDGutteridgeGComparison of point-of-care versus central laboratory measurement of electrolyte concentrations on calculations of the anion gap and the strong ion differenceAnesthesiology20039851077108412717128