Abstract
Bone marrow transplantation (BMT) was introduced as a treatment option 15 years ago for severe, drug-resistant multiple sclerosis (MS). Up until now, BMT has been undertaken in relatively few patients worldwide, with moderate success, and recent studies suggest that patients with early, highly aggressive MS benefit most from this treatment. In this work, we determined peripheral blood lymphocyte populations in a patient (patient A) with remitting–relapsing multiple sclerosis (RR-MS), refractory to conventional treatments, and who underwent BMT, relapsed, and has been treated with natalizumab for the last 22 months. Eleven other RR-MS patients in the acute phase of the disease, untreated or treated with interferon-beta, and 20 healthy subjects served as controls. Natalizumab treatment in patient A resulted in lymphocytosis and increased levels of CD20+/CD20+CD5+ B cells and T regulatory cells (Tregs). The patient maintained relatively low levels of T cells, T helper cells, memory T helper cells, and naive cytotoxic T cells, and very low levels of naive T helper cells and natural killer cells throughout. The Tregs of patient A post-treatment with natalizumab responded well in culture to a peptide mapping to a myelin basic protein antigenic epitope (mean 42% increase) compared with Tregs of healthy controls (mean 15% increase) whereas Tregs of the RR-MS controls or patient A prenatalizumab treatment either did not respond or responded adversely to the peptide (mean 3% and 21% decreases, respectively). Since the beginning of natalizumab treatment, patient A has had no relapses, and his Expanded Disability Status Score has improved. From the parameters studied, Treg responsiveness to autoantigens seems to be an important differentiating factor in RR-MS progression.
Introduction
Multiple sclerosis (MS) is a chronic inflammatory disorder of the central nervous system. Derangement of cellular immunity is central in the pathophysiology of MS. MS is predominantly characterized by local T cell and macrophage infiltration and autoantibody production, leading to demyelination and loss of neurologic function. MS is an autoimmune disease triggered by CD4+ T cells, mainly Th1. More recently, Th17 cells have been shown to be involved in MS. Antigens within the myelin sheath, such as myelin basic protein, proteolipid protein, and myelin oligodendrocyte glycoprotein, have been described as the main targets of self-reactive CD4+ T cells and autoantibodies.Citation1–Citation3
T regulatory cells (Tregs), especially thymus-derived natural Tregs (CD4+CD25+FoxP3+ T cells), are of major importance in the maintenance of immune tolerance to self- and alloantigens.Citation4 Impairment of the inhibitory function of natural Tregs seems to play an important role in MS disease pathogenesis.Citation5
MS usually affects young adults aged 20–40 years, although it can begin earlier or later in life. Women are affected almost twice as often as men. The most common symptoms include sensory disturbances in the limbs, optic nerve dysfunction, pyramidal tract dysfunction, bladder or bowel dysfunction, sexual dysfunction, ataxia, and diplopia. The course of MS can follow four clinical patterns, ie, relapsing–remitting MS (RR-MS) accounting for 80%–90% of MS cases at onset, secondary progressive MS, primary progressive MS, and progressive relapsing MS.Citation1
Results from autologous bone marrow transplantation (BMT) or stem cell transplantationCitation6 applied to >400 MS patients between 1995 and 2008 showed improvement in more than 60% of the patients for at least three years post-transplantation, with a mortality risk of 2%–10%. The accumulated experience from these trials helped clarify certain important points, ie, stem cell transplantationCitation6 works better with early aggressive MS, whereas when this treatment is applied to patients with progressive MS and long disease duration, it has minor or moderate results, and intermediate-intensity pretransplant conditioning regimens work equally as well as toxic high-intensity regimens.Citation7–Citation10
Results from heterologous stem cell transplantationCitation6 are very few (about five published cases). In all these cases, stem cell transplantation was performed to treat a hematologic malignancy with concurrent MS. MS improved in three of these patients, whereas in two patients it remained active.Citation11
Natalizumab is a new drug that is being used as monotherapy for relapsing forms of severe MS refractory to conventional treatments.Citation12 Natalizumab contains humanized neutralizing IgG4k monoclonal antibodies to leukocyte a4 integrins, which include a4β7 and a4β1, found on lymphocytes and monocytes. By blocking a4 integrins, natalizumab blocks lymphocyte and monocyte trafficking to the sites of inflammation.Citation12
In this work we sought to determine changes in lymphocyte subsets in the peripheral blood of an RR-MS patient refractory to conventional treatments and BMT who responded to natalizumab, with emphasis on the size and function of the patient’s Treg population. The patient’s data are compared with data obtained from 11 RR-MS patients, under no treatment or treated with interferon (IFN)-β, and 20 healthy controls, in order to get a clear idea of the cell populations that can be considered as major players in the pathogenesis of this complex disease.
Methods
Patient A: Case presentation
In 1998, a previously healthy 23-year-old man without a family history of neurologic disorders was admitted to our hospital because of numbness and weakness of the right leg and urinary urgency and incontinence. Ten days earlier, he had experienced the same symptoms in the left leg. One month earlier, he had also experienced loss of vision in the right eye that resolved rapidly, spontaneously, and completely.
A neurologic examination revealed decreased strength, hypopallesthesia, and hyperreflexia in the left leg, absent abdominal reflexes, no plantar response bilaterally, and a positive Hoffmann’s sign on the right.
Brain and spinal cord magnetic resonance imaging (MRI) with contrast showed an 8 mm lesion in the right parietal lobe and several lesions in the cervical medulla with demyelinating characteristics. Laboratory tests, including blood chemistry, and immunologic, rheumatologic, and thyroid screening, were normal. Examination of the cerebrospinal fluid, including IgG index, was normal. Multimodal evoked potentials showed alterations in visual responses.
The patient was given steroid treatment with intravenous methylprednisolone 500 mg/day for five days, with tapering, and the symptoms gradually subsided.
Two months later, the diagnosis of MS was confirmed on the basis of occurrence of a new clinical episode characterized by numbness and weakness of the left leg. He began receiving 30 μg of IFNβ-1α intramuscularly once weekly.
In the following seven months, the patient experienced several clinical recurrences involving the pyramidal, cerebellar, sensory, and oculomotor functional systems, that remitted after high doses of steroids. The therapy was changed to IFN-1β, but the recurrences continued about once per one or two months for the following year.
In May 2000, the patient underwent elective autologous BMT, and for one year he had no new clinical episodes. After one year, he started 30 μg of IFNβ-1α intramuscularly once weekly as prophylactic treatment. The treatment was changed again to IFNβ-1α 44 μg subcutaneously every second day because of two new clinical episodes but the recurrences continued.
In May 2003, the patient began treatment with mitoxandrone that lasted for two years. During this period, and for the following two years, he was free of symptoms and recurrences, without receiving any additional treatment.
In March 2007, the patient started having new episodes that, from then on, occurred every three months, with difficulty in walking, numbness of the lower extremities, urinary urgency and incontinence, and sexual dysfunction. He received treatment with high doses of intravenous steroids during each clinical episode without complete recovery.
In November 2007, the patient was hospitalized for a new clinical evaluation. The Expanded Disability Status Score (EDSS) score at this time was 5.5. Brain MRI with contrast showed nonenhancing foci with increased signal, characteristic of MS, in both the temporal lobes, the brainstem, the corpus callosum, and periventricularly, especially in the left cerebral hemisphere, and one enhancing lesion in the left occipital lobe. Spinal cord MRI with contrast revealed several enhancing and nonenhancing lesions from A2 to T1. Immunologic testing was normal. It was decided to start treatment with natalizumab, which was well tolerated. He has been receiving natalizumab for 22 months, with no new clinical episodes and a slight improvement in the EDSS score (4.5–5.0).
Controls
Eleven other patients with RR-MS were studied in parallel. All were patients at the Neurology Clinic of the Patras University Hospital, and did not suffer from any additional ailments. A second control group consisted of 20 healthy volunteers. Samples of heparinized peripheral blood (3 mL) were drawn from patient A at various time points (see Results section) and from controls only once. Clinical and laboratory parameters of the control subjects are shown in .
Table 1 Clinical and demographic data for MS patients and healthy controls
Informed consent was obtained from all participants in the study. Patras University Hospital abides by the Helsinki Declaration on ethical principles for medical research involving human subjects.
Methods
Immunophenotyping of peripheral blood mononuclear cells
Blood samples drawn from the study subjects were incubated with fluorescent-labeled antihuman monoclonal antibodies (mAbs) CD3-FITC, CD4-FITC, CD8-FITC, CD25-PE, CD45RA-PE, CD45RO-PE, CD20-FITC, CD5-PE, CD56-PE, HLA B7-PE, Vβ3-PE, Vβ5-FITC, Vβ8-FITC, Vβ9-FITC, Vβ23-FITC, and FoxP3-PC5. All mAbs were from BD Biosciences/Pharmingen (San Diego, CA); CD4-FITC was from Beckman Coulter (Fullerton, CA); CD8-FITC was from Daco A/S (Glostrup, Denmark); FoxP3-PC5 was from eBioscience (San Diego, CA). All experimental procedures were carried out following the manufacturers’ instructions for fluorescent activated cell sorting analysis in whole blood. Negative controls consisted of isotype-matched irrelevant antibodies, substituting specific antibodies at equivalent concentrations. Flow cytometric acquisition and analysis were performed on at least 50,000 acquired events (gated on lymphocytes) per sample, using a Coulter EPICS-XL-MCL cytometer. The data were analyzed using FlowJo V7.5 software (Tree Star Inc., Ashland, OR).
PBMC culture with myelin basic protein peptide
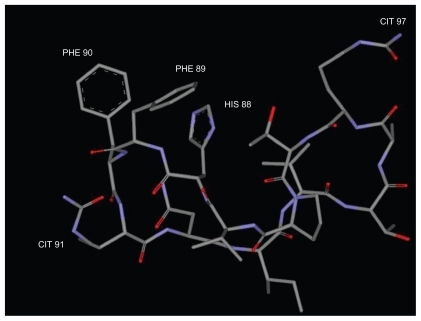
Peripheral blood mononuclear cells (PBMC) were isolated from patient A or controls by centrifugation over a Ficoll-Paque gradient (Pharmacia, Sweden). The cells were cultured O/N in RPMI1640 medium (GIBCO BRL, Gaithersburg, MD), containing 10% fetal bovine serum and 1% penicillin/streptomycin at a concentration of 106 cells/mL, in the presence or absence of peptide cP7 at a concentration 10 pg/mL/106 cells. Peptide cP7 () is a modified myelin basic protein antigenic epitope that elicits a very strong Th1 response by peripheral blood effector T cells of RR-MS patients in the acute phase of the disease before treatment or under continuous prophylactic therapy with IFN-β.Citation13
Figure 1 Lowest energy conformation of the peptide analog cP7 used in this work. cP7: cyclo (87–99) Cit91, Ala96, Cit97 MBP87–99: ValHisPhePheCit91 AsnIleValThrAla96 CitThrPro.
Immunophenotyping of cultured cells
At the end of culture, the cells (106 cells/mL in phosphate-buffered saline) were incubated with the mAbs CD4-FITC (Beckman Coulter), and CD25-PE (BD) and FoxP3-PC5 (eBioscience). All experimental procedures were carried out following the manufacturers’ instructions for cultured PBMC. Negative controls consisted of isotype-matched irrelevant antibodies, substituting specific antibodies at equivalent concentrations. Flow cytometric acquisition and analysis were performed on at least 50,000 acquired events (gated on lymphocytes) per sample, using a Coulter EPICS-XL-MCL cytometer. The data were analyzed using FlowJo V7.5 software (Tree Star Inc.).
Statistical analysis
The results are presented as mean values (±standard deviation, SD). Comparisons between groups were performed using the Student’s t test. The P values were calculated as two-tailed, and in all cases were considered statistically significant if P was ≤0.05.
Results
Phenotypic analysis of peripheral blood lymphocytes
The results of the phenotypic analysis performed on blood samples drawn from the MS and healthy controls are shown in . The differences between MS patients and controls that were statistically significant were the percentage of CD4+CD25+FoxP3+ T regulatory cells, that were about 64% lower in MS patients, HLA-B7 positive cells that were about 580% higher in MS patients, and the percentage of B cells (CD20) that were about 62% higher in MS patients. From the T cell receptor repertoire markers studied, Vβ5 was increased in MS patients compared with controls by about 30%, but the difference did not reach statistical significance.
Table 2 Cell surface immunophenotyping of peripheral blood lymphocytes of MS patients and healthy controls
Phenotypic analysis of peripheral blood lymphocytes in patient A before and after natalizumab
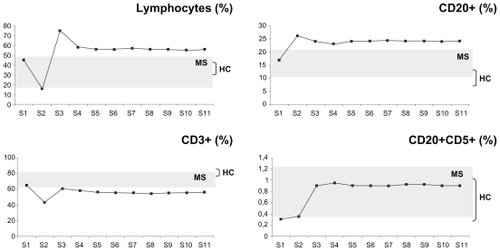
Blood samples were drawn from patient A 11 times, spanning a period of five months since the beginning of his treatment with natalizumab (points S1–S11, shown in –). The samples were invariably drawn once a month, immediately before and 24 hours after treatment administration, with the exception of point S3, where a blood sample was also drawn on day 15 after the first treatment. During this time period, the patient developed flu-like symptoms with fever twice; the first time soon after the first natalizumab administration (between points S2 and S3), and the second time 20 days after the second natalizumab administration (between points S5 and S6).
Figure 2 Plots of the changes in the percentages of patient’s A lymphocytes, T cells (CD3+), B cells (CD20+), and the CD20+CD5+ B cell subset before (time point S1) and at several time points spanning five months (S2–S11) postnatalizumab treatment. The samples were invariably drawn once a month, immediately before and 24 hours after treatment administration, with the exception of point S3 where a blood sample was also drawn on day 15 after the first treatment. During this time period, the patient developed flu-like symptoms with fever twice. The first time soon after the first natalizumab administration (between points S2 and S3), and the second time 20 days after the second natalizumab administration (between points S5 and S6). The plots are set against a background of the range of values obtained from the control RR-MS patients (MS, n = 11) and healthy controls (HC, n = 20).
– show plots of the changes in the percentages of patient A’s cell populations with time. Seven years after patient A underwent BMT, and immediately before receiving natalizumab treatment (point S1), he presented with diminished naive T helper (CD4+CD45RA+, ) and natural killer (CD3−CD56+, ) cell populations, whereas the rest of the populations studied were within the RR-MS control range ( and –).
Figure 3 Plots of the changes in the percentages of patient A’s T helper cells (CD3+CD4+), T helper naive cells (CD4+CD45RA+), T helper memory cells (CD4+CD45RO+), T cytotoxic cells (CD3+CD8+), T cytotoxic naive cells (CD8+CD45RA+), and T cytotoxic memory cells (CD8+CD45RO+) before (time point S1) and at several time points spanning five months (S2–S11) postnatalizumab treatment. The plots are set against a background of the range of values obtained from the control RR-MS patients (MS, n = 11) and healthy controls (HC, n = 20). For details on S1–S11 time points, compare with legend to .
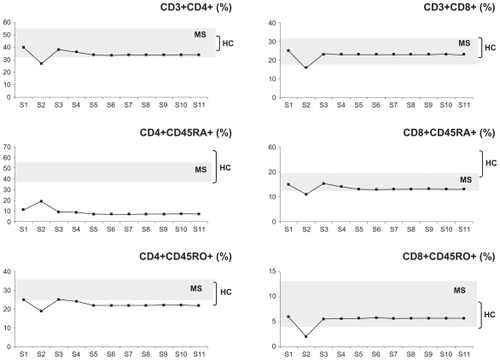
Figure 4 Plots of the changes in the percentages of patient A’s natural killer T cells (CD3−CD56+) and CD4+CD25+FoxP3+ T regulatory cells (Tregs) before (time point S1) and at several time points spanning five months (S2–S11) postnatalizumab treatment. The plots are set against a background of the range of values obtained from the control RR-MS patients (MS, n = 11) and healthy controls (HC, n = 20). For details on S1–S11 time points, compare with legend of .
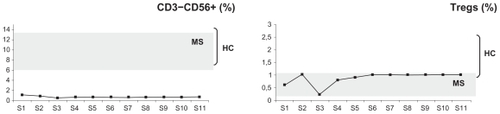
Natalizumab treatment in patient A resulted in lymphocytosis () and a relative increase in the percentages of CD20+ B cells (), the CD20+CD5+ B cell subset (), and CD4+CD25+FoxP3+ Tregs (). The patient maintained relatively low CD3+ T cells (), CD3+CD4+ T helper cells, CD4+CD45RO+ memory T helper cells, and CD8+CD45RA+ cytotoxic T cells (), and very low levels of naive CD4+CDRA+ T helper cells () and CD3−CD56+ natural killer cells () throughout.
Ability of Tregs to respond to the antigenic peptide cP7 in culture
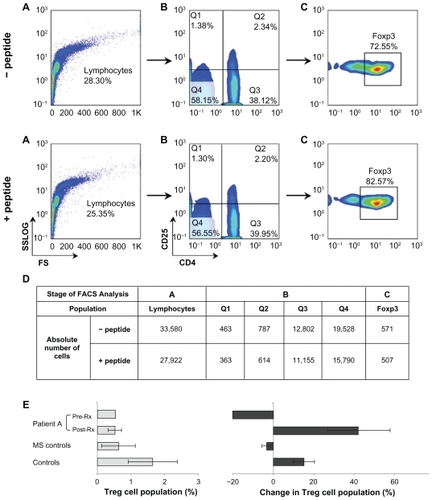
PBMC isolated from patient A and the controls were cultured O/N ± peptide cP7. The absolute numbers and percentages of CD4+CD25+FoxP3+ Tregs were determined as shown in . The results of the phenotypic analysis of all samples (patient A, MS patients, and healthy controls) are shown in . Incubation with the peptide increased the percentage of Tregs in control PBMC by an average of 15%, whereas it had no effect on or slightly decreased the percentage of RR-MS control Tregs by about 3%. In patient A, at time point S1 (prenatalizumab treatment) PBMC incubation with the peptide resulted in a 21% decrease of Tregs, whereas postnatalizumab treatment (from time point S2 onwards) PBMC incubation with the peptide increased the percentage of Tregs by an average of 42%.
Figure 5 Flow cytometric analysis to determine CD4+CD25+FoxP3+ T regulatory cell levels in PBMC isolated from patient A and the controls and cultured O/N ± peptide cP7. PBMC were stained with CD4, CD25, and, intracellularly, with FoxP3-specific mAbs, then analyzed on a Coulter EPICS-XL-MCL. A) The PBMC were gated on lymphocytes (based on forward and side light scatter) and B) analyzed for CD4 and CD25 expression. C) The double positive cells (Q2) were analyzed further for FoxP3 expression. The numbers in the A, B, C plots indicate the percentage of gated cells expressing the relevant marker. D) Shows the absolute number of cells per each population analyzed in A, B, and C. The results of the analysis of all samples (patient A, MS patients, n = 11, and HC, n = 20) are shown in E) Left-hand panel shows the percentage of CD4+CD25+FoxP3+ Tregs after O/N culture of PBMC in plain culture medium; right-hand panel shows changes in the percentage of CD4+CD25+FoxP3+ T cells after O/N culture with peptide cP7. Pretreatment, prenatalizumab treatment (point S1); post-treatment, postnatalizumab treatment (points S2–S11).
Discussion
The immune system of patient A was being influenced by three independent variables, ie, the disease, BMT, and treatment with natalizumab. Phenotypic analysis of patient A’s lymphocytes, seven years after BMT and before receiving natalizumab treatment, showed that most of the cell types studied were within or at the low end of the control RR-MS range, whereas his naive T helper and natural killer cell levels were very low. Muraro et alCitation14 showed that in seven patients with different types of MS (one with RR-MS) who underwent autologous hematopoietic stem cell transplantation and did not relapse during a two-year follow-up, there were no significant differences from pretherapy in the proportions of CD3+ T cells, CD19+/CD20+ B cells, natural killer (CD3−CD56+) cells, natural killer T cells (CD3+ CD56+), and CD14+ monocytes. The CD4+/CD8+ ratio was significantly decreased due to the greater impact of therapy on CD4+ T cells during the first months, but reverted towards baseline at one year and reached pretherapy levels at two years. They also showed a doubling of the frequency of naïve CD4+ T cells at the expense of memory T cells.
Natalizumab treatment of patient A resulted in lymphocytosis, reflecting the successful antagonism of a4 integrin.Citation12 Analysis of the lymphocyte populations of patient A revealed that lymphocytosis resulted mainly from increased levels of his CD20+ and CD20+CD5+ B cells, which may indicate an increase in the production of T cell-dependent and natural antibodies.Citation15,Citation16 Linberg et alCitation17 examined the gene expression profiles in peripheral blood cells of MS patients who had been treated with natalizumab for more than two years and compared them with placebo-treated patients. They reported sustained altered transcription patterns of several genes expressed in lymphocytes, neutrophils, or erythrocytes, in particular those genes involved in B cell activation and differentiation.
Patient A’s effector T cell levels remained unchanged postnatalizumab treatment, with his naive T helper cells and natural killer cells remaining at extremely low levels throughout the study period. Decreased levels of CD4+ T helper cells during natalizumab treatment have also been reported in earlier studies.Citation18,Citation19
Finally, in patient A, natalizumab treatment resulted in a stable increase of his natural (CD4+CD25+FoxP3+) Tregs. Nevertheless, their numbers remained low compared with Tregs of healthy controls, ie, within the RR-MS control range. In accordance with previous studiesCitation5 that have reported a lack of function of Tregs in MS, patient A’s Tregs before natalizumab treatment, when cultured with a strong myelin basic protein self-antigen, failed to respond and actually decreased in number, similar to Tregs from the RR-MS controls. In contrast, postnatalizumab treatment, patient A’s Tregs responded well to the self-antigen, maintaining a stable increase of about 42%, ie, patient A acquired functional Tregs.
Taken together, the results suggest that BMT failed to generate new T cells, natural killer cells, and Tregs in patient A, and this is probably the reason why this patient relapsed.
It has been reported that, in MS patients treated with natalizumab, there are increased numbers of circulating hematopoietic stem/progenitor cells that are chronically maintained.Citation20–Citation22 Although the fate of these circulating hematopoietic stem/progenitor cells and their clinical relevance for MS patients remain to be determined, it is possible that natalizumab treatment results in the generation of new lymphocytes and new functional Tregs in the patients and also in new myelinogenic or neural cells. These events may account for the improved clinical condition of patient A.
To our knowledge, this is the first work that reports improved Treg function in an RR-MS patient who received natalizumab treatment. According to a recent study, natalizumab treatment of 28 RR-MS patients resulted in a relative decrease in natural Tregs, and their impaired suppressive capacity was not restored.Citation23 Although a direct comparison cannot be made between patient A, who has a history of BMT, and typical RR-MS patients who are refractory to conventional treatments and are put on natalizumab, a possible explanation is that the peptide we used for the Treg functional assays is a citrullinated myelin basic protein peptide. It is becoming increasingly apparent that citrullination of self-antigens is a major mechanism in triggering autoimmune/inflammatory diseases such as MS.Citation6,Citation13,Citation24 Future work with RR-MS patients treated with natalizumab, in comparison to other types of treatment, will clarify whether natalizumab treatment results in the generation of functional Tregs in RR-MS patients in general.
Acknowledgment
We thank Dr Theodore Tselios for preparing .
Disclosure
The authors report no conflict of interests in this work.
References
- MouzakiATseliosTPapathanassopoulosPMatsoukasIChatzantoniKImmunotherapy for multiple sclerosis: Basic insights for new clinical strategiesCurr Neurovasc Res20041432534016181082
- MouzakiADeraosSChatzantoniKAdvances in the treatment of autoimmune diseases; cellular activity, type-1/type-2 cytokine secretion patterns and their modulation by therapeutic peptidesCurr Med Chem200512131537155015974986
- HedegaardCJKrakauerMBendtzenKLundHSellebjergFNielsenCHT helper cell type 1 (Th1), Th2 and Th17 responses to myelin basic protein and disease activity in multiple sclerosisImmunology2008125216116918397264
- SakaguchiSNaturally arising Foxp3-expressing CD25+CD4+ regulatory T cells in immunological tolerance to self and non-selfNat Immunol20056434535215785760
- CostantinoCMBaecher-AllanCHaflerDAMultiple sclerosis and regulatory T cellsJ Clin Immunol200828669770618763026
- PapanastasiouADChatzantoniKMouzakiACurrent therapeutic leads for the treatment of autoimmune diseases: Stem cell transplantation and inhibition of post-translational modifications of autoantigensExpert Opin Drug Discov200831012551265
- FagiusJLundgrenJObergGEarly highly aggressive MS successfully treated by hematopoietic stem cell transplantationMult Scler200915222923718805841
- ChenJTCollinsDLAtkinsHLFreedmanMSArnoldDLCanadian MS/BMT Study GroupMagnetization transfer ratio evolution with demyelination and remyelination in multiple sclerosis lesionsAnn Neurol200863225426218257039
- ShevchenkoYLNovikAAKuznetsovANHigh-dose immunosuppressive therapy with autologous hematopoietic stem cell transplantation as a treatment option in multiple sclerosisExp Hematol200836292292818468768
- FargeDLabopinMTyndallAAutologous hematopoietic stem cell transplantation for autoimmune diseases: An observational study on 12 years’ experience from the European Group for Blood and Marrow Transplantation Working Party on Autoimmune DiseasesHaematologica201095228429219773265
- LuJQStorekJMetzLContinued disease activity in a patient with multiple sclerosis after allogeneic hematopoietic cell transplantationArch Neurol200966111612019139309
- RansohoffRMNatalizumab for multiple sclerosisNew Engl J Med20073562622262917582072
- DeraosGChatzantoniKMatsoukasMTCitrullination of linear and cyclic altered peptide ligands from myelin basic protein (MBP) epitope elicits a Th1 polarized response by T cells isolated from multiple sclerosis patients: Implications in triggering diseaseJ Med Chem200851247834784219053745
- MuraroPADouekDCPackerAThymic output generates a new and diverse tcr repertoire after autologous stem cell transplantation in multiple sclerosis patientsJ Exp Med2005201580581615738052
- KantorABThe development and repertoire of B-1 cells (CD5 B cells)Immunol Today199112113893911723875
- BaumgarthNTungJWHerzenbergLAInherent specificities in natural antibodies: A key to immune defence against pathogen invasionSpringer Semin Immunopathol200526434736215633017
- LindbergRLAchtnichtsLHoffmannFKuhleJKapposLNatalizumab alters transcriptional expression profiles of blood cell subpopulations of multiple sclerosis patientsJ Neuroimmunol20081941–215316418178259
- StuveOMarraCMJeromeKRImmune surveillance in multiple sclerosis patients treated with natalizumabAnn Neurol200659574374716634029
- StuveOMarraCMBar-OrAAltered CD4+/CD8+ T-cell ratios in cerebrospinal fluid of natalizumab-treated patients with multiple sclerosisArch Neurol200663101383138717030653
- BonigHWundesAChangK-HLucasSPapayannopoulouTIncreased numbers of circulating hematopoietic stem/progenitor cells are chronically maintained in patients treated with the CD49d blocking antibody natalizumabBlood200811173439344118195093
- ZohrenFToutzarisDKlärnerVHartungH-PKieseierBHaasRThe monoclonal anti-VLA-4 antibody natalizumab mobilizes CD34+ hematopoietic progenitor cells in humansBlood200811173893389518235044
- JingDOelschlaegelUOrdemannRCD49d blockade by natalizumab in patients with multiple sclerosis affects steady-state hematopoiesis and mobilizes progenitors with a distinct phenotype and functionBone Marrow Transplant2010125 Epub ahead of print
- PutzkiNBaranwalMKTettenbornBLimmrothVKreuzfelderEEffects of natalizumab on circulating B cells, T regulatory cells and natural killer cellsEur Neurol201063531131720453514
- Carrillo-VicoALeechMDAndertonSMContribution of myelin autoantigen citrullination to T cell autoaggression in the central nervous systemJ Immunol201018462839284620164413