Abstract
Background:
Insulin action has been reported to be normal in type 1 diabetic patients. However, some studies have reported an insulin resistance state in these patients. The aim of this study was to investigate insulin resistance in a group of type 1 diabetic patients. We studied the insulin action in adipose tissue and analyzed the effects of duration of disease, body mass index (BMI), and glycosylated hemoglobin on insulin action at the receptor and postreceptor levels in adipocytes.
Methods:
Nine female type 1 diabetic patients with different durations of disease and eight nondiabetic female patients of comparable age and BMI were studied. 125I-insulin binding and U-[14C]-D-glucose transport was measured in a sample of subcutaneous gluteus adipose tissue obtained by open surgical biopsy from each subject.
Results:
The duration of disease was negatively correlated with both 125I-insulin binding capacity (r = −0.70, P < 0.05) and basal and maximum insulin-stimulated glucose transport (r = −0.87, P < 0.01, and r = −0.88, P < 0.01, respectively). Maximum specific 125I-insulin binding to the receptors in adipocytes was higher in the group of patients with a shorter duration of disease (P < 0.01). Basal and maximum insulin-stimulated glucose transport was significantly higher in the group with less than 5 years of disease (P < 0.01). No correlation was found between BMI and insulin action.
Conclusion:
Female type 1 diabetic patients have normal insulin action. There is a high glucose uptake in the early phase of the disease, although a longer duration of disease appears to be a contributing factor to a decrease in insulin action in these patients, and involving both receptor and postreceptor mechanisms.
Introduction
Type 1 diabetes is an organ-specific autoimmune disease caused by altered immune tolerance to specific proteins, with selective destruction of insulin-producing beta cells in genetically predisposed individuals.Citation1 In contrast, insulin resistance is considered to be the main pathophysiological factor for type 2 diabetes.Citation2
Type 1 diabetes patients have less cardiovascular disease than those who suffer from type 2 diabetes. However, a higher cardiovascular risk, as well as greater insulin resistance, has been reported in type 1 diabetes patients with a positive family history of type 2 diabetes compared with type 1 diabetic patients with no family history of type 2 diabetes.Citation3 Several authors have shown that both hyperinsulinism and insulin resistance could explain why patients with type 2 diabetes generally have more macrovascular disease than those with type 1 diabetes.Citation4,Citation5
Normal insulin action has been reported in type 1 diabetes.Citation3 In contrast, other studies have described insulin resistance in these individuals, with remission after a variable follow-up of disease. Prevention of insulin resistance in type 1 diabetes has recently been recommended. In overweight adult type 1 diabetes patients or in those with increased insulin resistance, insulin sensitizers could be adequate in addition to insulin therapy.Citation6 This rationale would lead to a diminished risk of macrovascular disease and subsequently to a lower cardiovascular risk in these patients.
We have studied insulin action in type 1 diabetes patients and evaluated the effect of glycemic control, body mass index (BMI), and time of duration of disease on insulin action in these patients.
Materials and methods
Patients
Nine female patients with type 1 diabetes were recruited from endocrine clinics. A fasting and glucagon-stimulated C-peptide level <1 ng/dL, as well as positivity for islet-cell (IA2) and anti-GAD65 antibodies, were used as diagnostic criteria for type 1 diabetes. The duration of disease ranged from 4 months to 10 years. None of the patients were on medications that could alter insulin action, apart from exogenous insulin itself. A group of eight healthy women matched for age and BMI, and with a normal glucose response to an oral glucose tolerance test 2 hours after an overload of glucose 75 g, comprised the control group. Their BMIs ranged from 20 to 28 kg/m2. The study was approved by the local ethics committee of the hospital and written informed consent was obtained from all the participants before entering the study.
Adipocyte isolation
An open surgical biopsy was performed in every patient to obtain subcutaneous gluteus adipose tissue for the measurement of 125I-insulin binding, and U-[14C]-D-glucose transport (New Research Products, Dupont de Nemours, GmbH, Bad Homburg, Germany). Adipocytes were isolated by the method described by Rodbel and modified by Pedersen et al,Citation7 and insulin binding was measured by the method described by Sinha et al.Citation8 Fat tissue in the gluteus region was digested with collagenase 1.5 mg/dL in 10 mmol HEPES Krebs-Ringer bicarbonate (KRB) buffer, pH 7.4, containing 3% bovine serum albumin-KRB buffer, for 30–45 minutes at 37°C, under a 95% oxygen/5% CO2 atmosphere with continuous shaking. Cells were filtered through a nylon mesh and washed with 1% bovine serum albumin-KRB buffer. An aliquot of the cell suspension was fixed overnight in 10% formalin-buffered phosphate to determine cell size. Another aliquot was stained with trypan blue to determine viability of the adipose cells.
Insulin binding to adipocytes
Fresh adipocytes were incubated with 10 mol/L 125I-insulin in the absence and presence, respectively, of increasing concentrations of unlabeled insulin (0–10−7 mol/L) at 22°C, in a final volume of 1 mL 3% bovine serum albumin-KRB buffer for 45 minutes. Aliquots of 250 μL were centrifuged through phthalate of bis-(2-ethyl-hexile), and cell-associated radioactivity was counted. Specific binding was determined after subtracting the nonspecific value obtained in the presence of 10−6 M of insulin.
Glucose transport
U-[14C]-D-glucose uptake by the cell as described by Kashiwagi et al was used for measuring glucose transport into the adipocyte.Citation9 Isolated adipocytes were incubated with 500 nmol/L U-[14C]-D-glucose in the absence and presence of insulin (0–10−7 mol/L) in a final volume of 1 mL 3% bovine serum albumin-KRB buffer for 60 minutes, at 37°C and under a 95% O2/5% CO atmosphere, with continuous shaking. Centrifugation was used to separate the cells and three 250 μL aliquots were used for the insulin binding assay. No specific glucose transport value was subtracted from each value.
Biochemical variables
Serum insulin and C-peptide levels were measured by a commercial radioimmunoanalysis kit (Incstar Corp, Stillwater, MN). Glycosylated hemoglobin (HbA1c) levels were measured by high-performance liquid chromatography (Diamat, Bio-Rad, Vienna, Austria) using a Merck-Hitachi model L9100 autoanalyzer. Both intra-assay and interassay variability were below 10%.
Statistical analysis
Data were analyzed using nonparametric tests. For the comparison between both individual data and between groups, and also between patient subgroups segregated by duration of disease, we used the Mann-Whitney U and Wilcoxon tests as indicated. The Spearman bivariate correlation analysis was used for assessment of the influence of diabetes duration and HbA1c levels on the different variables. Data are presented as means ± standard deviation, and a P value of <0.05 was considered to be statistically significant. Calculations were performed using the Statistical Package for Social Science (SPSS), version 12.0.
Results
Nine type 1 diabetic women (mean age 33 ± 12. years, BMI 23.9 ± 5.0 kg/m2, HbA1c 6.5 ± 0.9%), and eight healthy women of comparable age and BMI were studied. Clinical features of the study subjects are shown in .
Table 1 Clinical and analytical data for the study groups
Maximal insulin binding to adipocytes (5.8 ± 0.4 versus 6.4 ± 1.3% B/50,000 cells), basal glucose transport (71.7 ± 34 versus 54.38 ± 38 Fl/cel/s), and maximum insulin-stimulated (10−7 mol/L insulin) glucose transport (135.3 ± 74 versus 102.5 ± 47 Fl/cel/s) were similar in the type 1 diabetic and control groups ().
The whole group of type 1 diabetic patients was segregated into those with up to 5 years of diabetes (n = 5) and those with more than 5 years of diabetes (n = 4). Maximum specific 125I-insulin binding to the receptor in adipocytes (P < 0.01), basal glucose transport (P < 0.05), and maximal insulin-stimulated glucose transport (P < 0.01) were higher in the former group (, ).
Figure 1 Insulin action in the adipocyte: maximal insulin binding and basal and maximal glucose transport after stimulated insulin (10−7 mol/L) in type 1 diabetic patients with >5 years and ≤ of 5 years of diabetes.
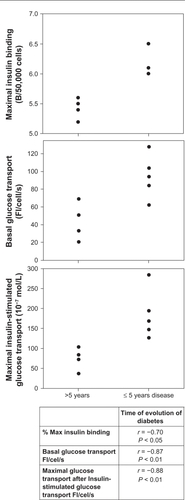
Table 2 Insulin binding, basal glucose transport, and insulin-stimulated glucose transport in adipocytes from type 1 diabetic patients according to duration of disease
When we compared both type 1 diabetes subgroups with the control group, we only found significant differences in basal and maximal glucose transport, showing higher values in type 1 diabetic patients with less than 5 years of disease duration (P < 0.05, ).
Glucose transport showed a significant negative correlation with duration of disease (r = −0.84, P < 0.01). There was a negative, but not significant, correlation between HbA1c level and insulin binding (r = −0.33, P < 0.37), as well as between HbA1c and both basal and maximum glucose-stimulated transport, although neither of them were significant (r = −0.42, P < 0.25, and r = −0.37, P < 0.32 for basal and maximum glucose transport, respectively, ).
Table 3 Correlations between several clinical and analytical parameters and insulin action in adipocyte tissue in type 1 diabetes patients
Discussion
Glucose uptake is regulated by insulin in the case of high plasma glucose. Insulin is then secreted and stimulates the uptake and storage of glucose, as well as its metabolism in skeletal muscle and adipose tissue, in order to maintain a constant glucose level. In our study, the group with a longer disease duration had higher insulin requirements for metabolic control. Furthermore, a significant positive correlation was found between the time of disease and the dose of insulin required for treatment, which suggests that the appearance of insulin resistance occurs during the course of disease and becomes higher with longer duration of disease. The required insulin dose in patients with type 1 diabetes constitutes a marker of insulin resistance.Citation10,Citation11 Other factors which influence insulin action, such as suboptimal control, overweight, counter-regulatory hormone excess, or ketoacidosis, have been suggested as mechanisms for insulin resistance in patients with type 1 diabetes.Citation12 In our study, there were no differences in BMI and metabolic control as assessed by the level of HbA1c, which could explain the difference in insulin action in type 1 diabetic patients with different durations of diabetes.
The first mechanism of insulin action is mediated by cell surface receptors which were described in 1971.Citation13 An alteration in the binding of insulin to its receptor could explain an impairment of insulin action in diabetic patients. Studies of insulin action in type 1 diabetes have observed normal restored insulin action in these individuals. Although muscle tissue is the major peripheral target organ of insulin, adipose tissue is another important one, and previous studies have demonstrated that glucose uptake induced by insulin in this tissue correlates with overall glucose utilization.Citation10,Citation11 Moreover, in vitro experiments show that a reversal of hyperglycemia normalizes the insulin action in fat cells following insulin treatment.Citation14 In addition, normal insulin sensitivity has also been reported in patients with type 1 diabetes in the preclinical stage of the disease. In subjects with newly diagnosed type 1 diabetes, a transient normalization of insulin action may occur after initial insulin treatment. In patients with type 1 diabetes, partial recovery of C-peptide secretion has been observed during the honeymoon period.Citation15,Citation16 We measured C-peptide levels, both at baseline and six minutes after stimulation with glucagon 1 mg intravenously, and an absence of insulin secretion was confirmed. Therefore, our results support the hypothesis that factors other than endogenous insulin secretion must contribute to the increase in daily insulin requirements over the duration of the disease.
High glucose transport in adipocytes as the cause of the honeymoon period, without changes in insulin secretion, has been reported.Citation17 An increase in basal glucose transport and maximally stimulated glucose transport during the early phase of diabetes could explain the low insulin requirement needed to achieve metabolic control during the first year of the disease. In conceptual agreement, we now report high glucose transport, both basal and maximal, in type 1 diabetic patients with a shorter duration of disease. We did not observe insulin resistance in our type 1 diabetic patients, because both basal and maximum insulin-stimulated glucose uptake were not decreased in type 1 diabetic patients when compared with the control group. Furthermore, we found a negative correlation between insulin action and duration of disease in type 1 diabetic patients.
A limitation of our study is the low number of patients. Our results indicate that a longer duration of diabetes could lead to a decrease in insulin action in type 1 diabetic patients. In the early phase of the disease, an increase in glucose transport and maximal insulin glucose transport could explain the lower dose of insulin needed in type 1 diabetic patients in clinical practice. Moreover, a normal insulin action explains the frequent hypoglycemia seen in type 1 diabetes versus type 2 diabetes patients with high levels of insulin and low episodes of hypoglycemia.
In summary, type 1 diabetic patients are not insulin-resistant, and the early phase of the disease is characterized by an increase in glucose transport, both basal and insulin-stimulated. Further studies with larger number of patients are needed to confirm our results.
Acknowledgements
This study was supported by a grant from the Spanish Health Institute “Instituto Nacional de Sanidad”. PI. PS09/00680 FIS; IP 050681.
Disclosure
The author reports no conflict of interest in this work.
References
- WildSRoglicGGreenASicreeRKingHGlobal prevalence of diabetes: estimates for the year 2000 and projections for 2030Diabetes Care2004271047105315111519
- ReavenGMBanting lecture 1988. Role of insulin resistance in human diseaseDiabetes198837159516073056758
- GrayRCowanPDuncanJPClarkeFReversal of insulin resistance in type 1 diabetes following initiation of insulin treatmentDiabet Med1986318232951129
- McGillMMolyneauxLTwiggSMYueDKThe metabolic syndrome in type 1 diabetes: does it matter?J Diabetes Complications200822182318191073
- MeigsJBRutterMKSullivanLMFoxCSD`AgostinoRBWilsonPWImpact of insulin resistance on risk of type 2 diabetes and cardiovascular disease in people with metabolic syndromeDiabetes Care200731219122517259468
- StrowigSRaskinPHThe effect of rosiglitazone on overweight subjects with type 1 diabetesDiabetes Care2005281562156715983301
- PedersenOHjollundEBeck-NielsenHLindskovHOSonneOGliemannJInsulin receptor binding and receptor-mediated insulin degradation in human adipocytesDiabetologia1981206366417021280
- SinhaMKTaylorLGPoriesWJFlickingerEGMeelheimDAtkinsonSLong-term effect of insulin on glucose transport and insulin binding in cultured adipocytes from normal and obese humans with and without non-insulin-dependent diabetesJ Clin Invest198780107310813308958
- KashiwagiAVersoMAAndrewsJVasquezBReavenGFoleyJEIn vitro insulin resistance of human adipocytes isolated from subjects with non-insulin-dependent diabetes mellitusJ Clin Invest198372124612546355180
- CiaraldiTPKoltermanOGOlefskyJMMechanism of the post-receptor defect in insulin actions in human obesity: Decrease in glucose transport system activityJ Clin Invest1981688758807026616
- CaslaAArrietaFGrantCCasanovaBRoviraAEffect of short-and long-term experimental hyperthyroidism on plasma glucose level and insulin secretion during an intravenous glucose load and on insulin receptor kinase activity, and insulin action in adipose tissueMetabolism1993428148218393952
- KilpatrickERigbyAAtkinSInsulin resistance, the metabolic syndrome, and complication risk in type 1 diabetesDiabetes Care20073070771217327345
- ShanikMXuYSkrhaJDanknerRZickYRothJInsulin resistance and hyperinsulinemia: is hyperinsulinemia the cart or the horse?Diabetes Care200831S262S26818227495
- BurenJLindmarkSRenstromFErikssonJIn vitro reversal of hyperglycemia normalizes insulin action in fat cells from type 2 diabetes patients: is cellular insulin caused by glucotoxicity in vivo?Metabolism20035223924512601640
- MadsbadSPrevalence of residual β cell function and its metabolic consequences in type I (insulin-dependent) diabetesDiabetologia1983241411476341142
- Yki-järvinenHKoivistoVInsulin sensitivity in newly diagnosed type 1 diabetics after ketoacidosis and after three months of insulin therapyJ Clin Endocrinol Metab1984593713786430945
- ArrietaFPulidoNSuarezAHigh glucose uptake by adipocytes in a type 1 diabetic patient with a partial honeymoon periodDiabet Med1998157887909737810
- WilliamsKErbeyJBeckerDArslanianSOrchardTCan clinical factors estimate insulin resistance in type 1 diabetes?Diabetes20004962663210871201
- KahnCRFreychetPRothJNervilleDMJrQuantitative aspects of the insulin receptor interaction in liver plasma membranesJ Biol Chem1971249224922574362069