 ?Mathematical formulae have been encoded as MathML and are displayed in this HTML version using MathJax in order to improve their display. Uncheck the box to turn MathJax off. This feature requires Javascript. Click on a formula to zoom.
Abstract
Background:
DLBS3233 is a standardized extract combination containing Lagerstroemia speciosa and Cinnamomum burmannii. The effect of DLBS3233 on glucose uptake, adiponectin secretion, and insulin signaling was examined in this study.
Methods:
3T3 Swiss albino preadipocytes and adipocytes were used to investigate gene expression detected using the reverse transcription polymerase chain reaction method. Immunoblotting assay and in vitro glucose uptake assay were also carried out in the experiment.
Results:
DLBS3233 was seen to increase phosphorylation at the tyrosine residue of the insulin receptor substrate. DLBS3233 was also found to enhance the expression of genes associated with increased insulin signaling and sensitivity, such as peroxisome proliferator-activated receptor gamma, phosphatidylinositol-3 kinase, Akt, and glucose transporter 4. In addition, glucose transporter 4 protein levels were seen to increase as a result of DLBS3233 administration. The combination of extracts also increased glucose uptake and adiponectin secretion, and decreased resistin secretion significantly relative to control cells. Moreover, DLBS3233 administered to insulin-resistant Wistar rats showed an ability to control blood sugar, insulin levels, and other lipoproteins, including high-density lipoprotein, low-density lipoprotein, triglycerides, and total cholesterol.
Conclusion:
DLBS3233, as a combination of herbal extracts, holds promise in the treatment of type 2 diabetes, and possibly also in prevention of the disease.
Introduction
In order to function, insulin binds to its receptor within the cell membrane. This mode of binding induces intracellular signaling pathway chain reactions, such as activation of glucose transporter enzymes and peroxisome proliferator-activated receptor gamma (PPARγ), peroxisome proliferator-activated receptor delta (PPARδ), and other transcription factors.Citation1 Minor inhibition of signal transduction level will cause a decrease in insulin sensitivity. Among many classes of diabetes medication, the currently accepted medical treatment for increasing insulin sensitivity is the thiazolidinediones (TZDs), including pioglitazone and rosiglitazone.Citation1 TZDs are substrates for the PPARγ transcription factor. Increasing the dosage of TZDs will increase gene expression of PPARγ, even though TZDs have been found to cause side effects, such as increased serum glutamic oxaloacetic transaminase and serum glutamic pyruvic transaminase levels (idiosyncratic acute hepatotoxicity) and some edema.Citation2
Moreover, an insulin-resistant state is commonly associated with lipoprotein abnormalities that are risk factors for atherosclerosis, including hypertriglyceridemia, high levels of very low-density lipoprotein, low levels of high-density lipoprotein (HDL), and low levels of low-density lipoprotein (LDL). These metabolic abnormalities, together with hypertension and type 2 diabetes mellitus, may cluster in the same individual, causing the metabolic syndrome X.Citation3
In this experiment, the biological activity of DLBS3233, a herbal extract combination containing Lagerstroemia speciosa and Cinnamomum burmannii, was investigated in a number of assays performed in 3T3-Swiss albino preadipocytes and Wistar rats. In this assay, pioglitazone was used as a positive control for the TZD class and glimepiride was used as a positive control for sulfonylureas. Previous studies showed that an extract from L. speciosa leaves could be used to decrease blood glucose levels in genetically diabetic rats and could also enhance glucose transport to adipocyte cells.Citation4–Citation6 According to Hattori et al,Citation5 the biological activity of L. speciosa is attributable to several of its active compounds (such as triterpene and corosolic acid) serving as insulin mimetics which can activate tyrosine kinase as an insulin receptor and inhibit tyrosine phosphatase. It is also believed that L. speciosa works as a glucose transport activator and adipogenesis inhibitor in 3T3 Swiss albino cells.Citation6 In recent years, several studies have reported that cinnamon extract has an antidiabetic effect in db/db mice and in type 2 diabetic patients.Citation7 We investigated further the combination of L. speciosa and C. burmannii to clarify the mechanism of action by which this combination decreases insulin resistance and increases glucose uptake.
Materials and methods
Materials
3T3 Swiss albino preadipocytes were obtained from the European Collection of Cell Culture (Salisbury, UK). Isobutyl-3-methylxanthine, dexamethasone, fetal calf serum, and trypsin-ethylenediamine tetra-acetic acid were purchased from Sigma Aldrich (St Louis, MO). Dulbecco’s Modified Eagle’s Medium (DMEM), L-glutamine, and penicillin/streptomycin were obtained from Gibco BRL (Carlsbad, CA) while Trizol® was from Invitrogen (Carlsbad, CA). A One Step RNA PCR Kit RT, RNasin, dNTP mix, oligo dT, MgCl2, Taq polymerase, GoTaq Green master mix, Track It DNA Ladder 100 bp, and 3-(4,5-dimethylthiazol-2-yl)-2,5-diphenyltetrazolium bromide (MTT) were purchased from Promega (Madison, WI) while anthrone, fructose, and glucose was from Merck (Whitehouse Station, NJ). L. speciosa was obtained from Cianjur, West Java, Indonesia, while C. burmanii was purchased from Kerinci, Jambi, Indonesia. Both of these plants were identified by Herbarium Bogoriense, Research Center for Biology, Indonesian Institute of Sciences (Reference 1261/IPH.1.02/If.8/XII/2009).
Phytochemical characterization of DLBS3233
DLBS3233 was prepared as a polar extract in which 450 g of dried C. burmanii plant and 150 g of dried L. speciosa plant were mixed. The mixture was extracted simultaneously using a percolation technique in warm water (1:8–10) at a temperature of 50–90°C. The micelles were then filtered and dried using a Rotavapor (Büchi, Flawil, Switzerland) at a temperature of 40–50°C, and subsequently dissolved in methanol for further study. The yield of this experiment was about 6.5%.
DLBS3233 was identified using thin layer chromatography. It was spotted on a 60 F254 silica gel plate and eluted using an eluent mixture of 1-butanol, acetic acid, water, chloroform, acetone, and formic acid (10:4:4:70:25:15). The eluent was allowed to move along the thin layer chromatography plate for a distance of 8 cm. Observation was done under ultraviolet light at 254 nm and 366 nm before and after a derivatization process using weak acid. In the chromatogram resulting from thin layer chromatography, it was observed that the components of DLBS3233 were extracted well. After the derivatization process was observed under ultraviolet light at 366 nm, a spot with Rf 0.6 showed that DLBS3233 contained a concentrate of C. burmanii and an Rf 0.3 of L. speciosa.
The presence of polyphenol in DLBS3233 was analyzed using a high-pressure liquid chromatography water 1525 binary high-pressure liquid chromatography pump with the Waters 2487 dual λ absorbance as a detector. The column used in this experiment was a Waters Atlantis dC18 (4.6 mm × 150 mm, 5.0 μm). Its absorbance was measured at 279 nm. The gradient elutions used were acetic acid 0.05 N and acetonitrile at a flow rate of 1 mL/min, with the ratio changed at 30 and 40 minutes. The polymer found in DLBS3233 is similar in chromatography to that found by Anderson et al,Citation8 and hence it is suggested that the polymer is a polyphenol type A.
Cell culture
3T3 fibroblast Swiss albino cells were maintained in high glucose DMEM containing 10% fetal calf serum, 2 mM L-glutamine, and 1% penicillin/streptomycin at 37°C in a humidified atmosphere of 5% CO2. Cells were subcultured every 3–4 days at approximately 90% confluency. Three days before treatment, the cells were grown to about 1 × 10⁴ cells/mL on 10 cm diameter plates.
Adipocyte cell differentiation
3T3 fibroblast Swiss albino preadipocytes were grown (day 0) in a differentiation medium 1 (high-glucose DMEM, fetal calf serum 10%, dexamethasone 0.25 μM, isobutyl-3-methylxanthine 0.25 mM, and insulin 1 μg/mL), at about 1 × 10⁴ cells/mL in a 75 mL flask. Under these conditions, lipid accumulation was apparent in 5% of cells. On day 2, the medium was changed to a new differentiation medium 1. On day 3, the dexamethasone and isobutyl-3-methylxanthine were removed, leaving insulin on the cells. Cells were maintained in differentiation medium 2 (high-glucose DMEM, fetal calf serum 10%, and insulin 1 μg/mL), and the medium was changed every 2–3 days. Differentiation was observed by a visual method using microscopy. The 3T3 Swiss albino adipocytes were found to be rounder in shape than the 3T3 Swiss albino preadipocytes. Under this supplemented condition, lipid droplets were observed in 15%–20% of the adipocytes, as assessed by oil red O staining (data not shown).
Immunoblotting with antiphosphotyrosine antibody
To analyze tyrosine phosphorylation at the insulin receptor, cells prepared in sample buffer were centrifuged at 5000 rpm for 10 minutes. The supernatants were subjected to electrophoresis on 8% sodium dodecyl sulfate gel. Proteins were electrophoretically transferred to a supported nitrocellulose membrane. The membrane was blocked with nonspecific proteins (Block I, 5% wt/vol powdered skimmed milk in phosphate-buffered saline). After primary blocking, the membrane was incubated overnight with fresh Block I and polyclonal anti-IRS-1 antibody. The next day, after the appropriate washes (phosphate-buffered saline followed by Tris/NaCI [50 mmol/L Tris, 150 mmol/L NaCI, pH 7.5]), the nitrocellulose membrane was incubated with the secondary antibody, ie, rabbit-antimouse horseradish peroxidase conjugate (Sigma). The blotted nitrocellulose membrane was treated with enhanced chemiluminescence substrates (ECL, Amersham, Arlington Heights, IL) and the membrane was used to expose X-ray films.
Insulin-resistant preadipocytes
In order to make an insulin-resistant cell, either preadipocytes or adipocytes were maintained for more than 2 weeks in very high-glucose DMEM containing 10 mg/mL glucose, 10% fetal calf serum, 2 mM L-glutamine, and 1% penicillin/streptomycin at 37°C in a humidified atmosphere of 5% CO2. Cells were subcultured every 3–4 days to reach approximately 90% confluency.
Extract administration
Before administration of the extract, the cell medium was changed to a serum-free medium. Both the extract (1–5 μg/mL) and positive controls (pioglitazone and glimepiride) were administered and incubated for 48 hours. Extracts of C. burmanii and L. speciosa was also administered separately to the cells in order to observe the effect of each plant alone compared with their combination.
RNA isolation
Total RNA was extracted using Trizol from 3T3 cells following the manufacturer’s instructions. In brief, the cells were lysed in Trizol reagent and extracted using chloroform, followed by isopropanol precipitation at 4°C for about 1–4 hours. The pellet was suspended by double-distilled H2O or nuclease-free water and stored at −20°C prior to use. Concentration and purity level (A260:A280) was determined by optical density measurement using a spectrophotometer (BioRad, Hercules, CA) at a 260 nm wavelength, and then the integrity of the RNA was verified using gel electrophoresis to detect the 28S and 18S ribosomal band.
Reverse transcription polymerase chain reaction
Prior to the reverse transcription process, RNA was incubated at 65°C for 10 minutes. The reverse transcription reaction was conducted in 25 μL of 1 μg RNA, 5 μL of 5 × buffer AMV reverse transcriptase, 0.5 μL of RNasin 40 U/μL, 2.5 μL of dNTP mix 10 mM, 1 μL of Oligo dT 500 μg/mL, 0.5 μL of AMV reverse transcriptase 10 U/μL, and double-distilled H2O until a total volume of 25 μL was obtained. Conditions for the reverse transcription step of RNA included hybridization at 30°C for 10 minutes, reverse transcription at 45°C for 45 minutes, denaturation at 99°C for 5 minutes, and continued at 6°C for 5 minutes. The reverse transcription product, ie, cDNA, was stored at −20°C prior to use.
Gene expression analysis
Analysis of gene expression was measured at the mRNA level. Polymerase chain reaction was performed to amplify the specific gene using specific oligonucleotide primers designed by Primer 3 software. The gene sequences were obtained from the GenBank database. Genes involved in insulin signal transduction (phosphatidylinositol-3 [PI3] kinase, Akt, PPARγ, glutamine transporter 4 (GLUT4), adiponectin, and resistin, the specific primers for which are shown in ) were detected using a reverse transcription polymerase chain reaction. The amplification reaction for the genes was carried out in a 25 μL mixture of solution containing 12.5 μL of Go Taq Green master mix, a pair of target genes with a final concentration of 0.9–1.2 μM, a pair of internal controls (beta actin) with a final concentration of 0.08–1.0 μM, 5 μL of cDNA, and double-distilled H2O. Polymerase chain reaction conditions for each target gene were similar to each other, and generally consisted of initial denaturation at 95°C for 3 minutes, 30–40 cycles of denaturation at 95°C for 30 seconds, primer annealing at 56–60°C for 30 seconds, and elongation at 72°C for 1 minute. When necessary, an additional elongation reaction was performed at 72°C for 10 minutes. Reverse transcription polymerase chain reactions were done using the PCR iCycler (BioRad). Target gene expression was expressed quantitatively, reflecting a ratio of the target gene product bands to an internal control band, and calculated according to the formula supplied in the manufacturer’s manual and using Image J Imaging System software (v 1.24; National Institutes of Health, Bethesda, MD).
Table 1 Primers used to amplify region of interest in PCR
Quantifications of GLUT4 protein
Total protein of 3T3 cells was extracted and separated by SDS-PAGE 10%. They were then transferred onto PVDF membranes (Millipore, Bedford, MA). HRP-conjugated secondary antibodies and chemiluminescence system were applied for the detection of blots. Images were acquired using an LSD-4000 chemiluminescence Imager (Fujifilm, Tokyo, Japan). Band intensities were quantified using Image J software (National Institutes of Health).
In vitro glucose uptake activity assay
Glucose uptake activity was analyzed by measuring the ratio of exogenously administered glucose concentrations with those found after a period of incubation. Measurement of glucose concentration was performed via the reaction of glucose with anthrone in strong sulfuric acid.Citation9 Cells were grown to about 1 × 10⁴ cells/mL in 6 cm diameter plates. 3T3-Swiss albino cells were maintained in high-glucose DMEM containing 10% fetal calf serum, 2 mM L-glutamine, and 1% penicillin/streptomycin at 37°C in a humidified atmosphere of 5% CO2. Briefly, confluent cells were washed twice with phosphate-buffered saline and incubated with 3 mL glucose solution 10 mg/mL with or without administration of DLBS3233 extract at 37°C for 0, 2, 4, and 6 hours. During incubation the cells took up glucose, enabling free glucose to be measured in the media, from which the concentration of glucose uptake could then be determined. The concentration of glucose taken up by the cells is described by the equation:
Anthrone was dissolved in H2SO4 prepared by adding concentrated acid to water. This anthrone solution is ready to be used after incubation for at least 2 hours and must be used within 24 hours. The reaction of anthrone and glucose was analyzed by the following procedure. Portions of the free glucose solutions in each well plate were transferred into test tubes. Each tube was placed in a water bath while anthrone reagent was added. The tubes were transferred to a boiling water bath for several minutes, and then stored in a dark room for a few minutes. The optical densities of the colored solutions were measured using a spectrophotometer (BioRad) at 625 nm. The increase in glucose uptake after administration of DLBS3233 was calculated according to the formula supplied in the manufacturer’s manual using Image J Imaging System software.
Animal experiment
Wistar rats (male, eight weeks old, 200–220 g) were obtained from D’Wistar (Bandung, Indonesia). The animal study was conducted with approval from the ethical institutional advisory committee as suggested by the Association for Assessment and Accreditation of Laboratory Animal Care (AAALAC). Animals were individually housed according to the guidelines of AAALAC and maintained at 25°C with a 12-hour light/dark cycle. The animals were given free access to water. They had been acclimatized for 1 week before treatment. The rats were separated into three groups. The first group (n = 7) comprised controls maintained on a standard diet. The second (n = 7) and third (n = 7) groups were maintained on a high-glucose diet for two weeks, with fructose 15% and glucose 10% to make them insulin-resistant. The third group was later treated with DLBS3233 at 9 mg/kg body weight for another 2 weeks. After the end of the treatment period, blood samples were collected from the tail vein of each rat to measure the random glucose level. Later, the rats in each group were fasted overnight, fed, and 2 hours later, blood samples were taken to measure postprandial glucose. Animals were fasted overnight again, blood samples were collected by cardiac puncture, and centrifuged at 8500 g for 25 minutes. The serum was separated out to measure the level of fasting glucose, insulin, triglycerides, total cholesterol, LDL, and HDL. An ultrasensitive rat insulin enzyme-linked immunosorbent assay (Mercodia, Uppsala, Sweden) and microplate reader (BioRad) were used to measure the insulin level. Other tests were carried out using a semiautomated clinical chemistry analyzer (Vital Scientific, the Netherlands). In addition, homeostasis model assessment was calculated by multiplying the glucose (mmol/L) by the insulin concentration, then dividing by a factor of 22.5.Citation10 The data were analyzed using one-way analysis of variance, and the significance level was measured by the post hoc Bonferroni test using Biostat software (Alexandria, VA).
Statistical analyses
Statistical differences in test and control samples were determined by Student’s t-test or ANOVA using Statview software (Abacus Concepts, Inc, Berkeley, CA). Data shown are from a representative experiment which was performed in duplicate or triplicate.
Results
Glucose uptake in normal and insulin-resistant preadipocytes/adipocytes
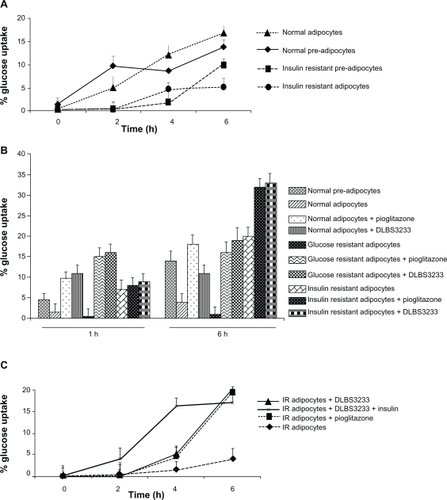
In order to study glucose uptake in different adipocyte conditions, the 3T3 fibroblast Swiss albino cells were allowed to differentiate into mature adipocytes so that they could be used as a cellular model of insulin resistance in diabetes. In the insulin-resistant condition, their glucose uptake capacity was used to simulate the actual phenomenon in the clinical setting. It was found that the insulin-resistant preadipocytes and mature adipocytes took up glucose at a much lower rate than their normal counterparts (). In addition, the onset of glucose uptake was found to be earlier in normal preadipocytes and adipocytes when compared with those that were insulin-resistant. This suggests that glucose transport impairment had occurred in the insulin-resistant preadipocytes and adipocytes, a clinically important phenomenon in predicting the onset of type 2 diabetes even in seemingly normal individuals.
Figure 1 DLBS3233 increases glucose uptake in 3T3 Swiss albino cells compared with untreated cells. A) Glucose uptake level of 3T3 Swiss albino preadipocytes and adipocytes in normal and insulin-resistant condition. B) Effect of DLBS3233 5 μg/mL and pioglitazone 0.02 μM on glucose uptake in normal and insulin-resistant 3T3 Swiss albino adipocytes. C) DLBS3233 5 μg/mL enhances glucose uptake activity of 3T3 Swiss albino insulin-resistant adipocytes as potently as pioglitazone in time-dependent manner. Results are mean value ± standard deviation of two independent experiments.
Effect of DLBS3233 versus pioglitazone on glucose uptake
In order to investigate the glucose transport profile in adipocytes, glucose uptake assays were performed in normal and insulin-resistant adipocytes at different times (1 and 6 hours) following exogenous glucose administration. In general, the uptake took place as early as 1 hour in most cells (A–J), and the longer the duration of exposure, the higher the uptake (1–6 hours, ). In addition, it was seen that the resistant cells took up less glucose than did the normal cells, a phenomenon seen previously in . Pioglitazone 0.02 μm was used as a positive control. Addition of pioglitazone to insulin-resistant adipocytes led to a 1.5-fold increase in glucose uptake compared with non-pioglitazone-treated adipocytes (I versus H). Similarly, addition of DLBS3233 to normal or insulin-resistant cells led to a 1.5–2.0-fold increase in glucose uptake compared with control cells (D versus B in normal cells; J versus H in their resistant counterparts). These data suggest that an insulin sensitizer works well for increasing glucose uptake into cells and thus lowers blood glucose levels.
Effect of DLBS3233 on glucose uptake in insulin-resistant adipocytes
The capacity for glucose uptake before treatment in 3T3 insulin-resistant Swiss albino adipocytes was found to be less than 5% (control cells). However, after DLBS3233 treatment, the uptake capacity was increased by about 20%, as shown in . Similar results were found when the cells were treated with pioglitazone. This suggests that DLBS3233 is as potent as pioglitazone in inducing glucose uptake.
Induction of PPARγ gene expression in 3T3 preadipocytes
In order to confirm the activity of DLBS3233 as a combination compared with each plant it is derived from, the effects of C. burmanii and L. speciosa on PPARγ gene expression were studied individually. It can be seen in that neither C. burmanii nor L. speciosa had any significant effect on PPARγ gene expression when used alone. The level of gene expression appeared to be similar after administration of both these plants compared with controls. These data suggest that, when used in combination, C. burmanii and L. speciosa interact with each other, causing the native characteristics of each extract to work synergistically to strengthen their pharmacological activity.
Figure 2 Peroxisome proliferator-activated receptor gamma gene expression after administration of Cinnamomum burmanii extract (A), Lagestroemia speciosa extract (B), and DLBS3233 (C) at various concentrations.
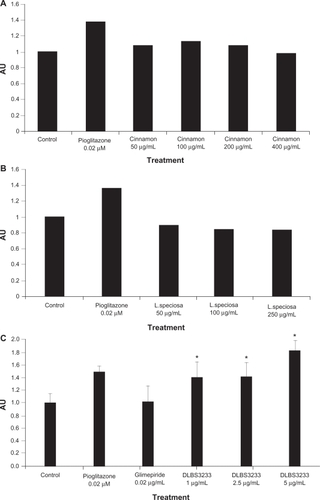
Moreover, the effect of DLBS3233 on PPARγ expression at the mRNA level was compared with that of pioglitazone and glimepiride. The DLBS3233 concentration which stimulated the highest PPARγ mRNA expression was 5 μg/mL (). This concentration of DLBS3233 enhanced PPARγ expression to a 1.8-fold greater extent than in the control cells. On the other hand, administration of pioglitazone 0.02 μM to 3T3 Swiss albino cells enhanced PPARγ expression by only 1.5-fold compared with the control cells, whereas glimepiride 0.02 μM did not result in any effect. This result suggests that DLBS3233 may contain bioactive compound(s) that can act as a direct ligand for PPARγ. In other words, DLBS3233 may regulate the expression of PPARγ either directly or indirectly.
Effect of DLBS3233 on tyrosine phosphorylation
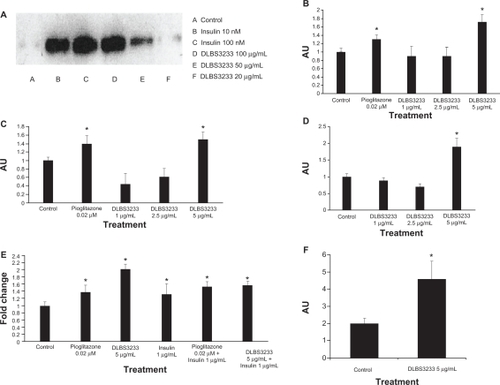
In this experiment, administration of DLBS3233 promoted tyrosine phosphorylation at the insulin receptor in a dose-dependent manner (). The concentration of DLBS3233 used in this experiment was in the range of 20–100 μg/mL. The administration of exogenous insulin (10 nM and 100 nM) also promotes tyrosine phosphorylation.
Figure 3 Effect of DLBS3233 5 μg/mL on expression of tyrosine phosphorylation (A). The effect of DLBS3233 5 μg/mL and pioglitazone 0.02 μM in enhancing phosphatidylinositol-3 kinase (B) and Akt (C) gene expression in 3T3 Swiss albino preadipocytes. The effect of DLBS3233 1–5 μg/mL in enhancing glucose transporter 4 gene expression in 3T3 Swiss albino preadipocytes (D). Effect of DLBS3233 and pioglitazone with or without insulin in enhancing glucose transporter 4 gene expression (E), and also total glucose transporter 4 protein level (F).
Abbreviation: AU, arbitrary unit.
Induction of PI3 kinase gene expression in 3T3 preadipocytes
This study measured the activation of PI3 kinase as a broad indicator of insulin action in the overall insulin signal transduction pathway. The effect of DLBS3233 on induction of PI3 kinase expression at the mRNA level was compared with that of pioglitazone. The DLBS3233 concentration which stimulated the highest PI3 kinase mRNA expression was 5 μg/mL (). This concentration of DLBS3233 enhanced PI3 kinase expression to a 1.7-fold greater extent than in the control cells. Such enhancement was found to be even higher than that demonstrated by 0.02 μM pioglitazone (1.25 times greater than in controls). This result suggests that DLBS3233 action may involve compound(s) which can directly or indirectly activate(s) the insulin receptor, tyrosine kinase.Citation11
Induction of Akt gene expression in 3T3 preadipocytes
The effect of DLBS3233 on the induction of Akt expression at the mRNA level was compared with that of pioglitazone. The concentration of DLBS3233 that stimulated the greatest Akt expression in 3T3 cells was 5 μg/mL (). This concentration enhanced Akt expression to a 1.5-fold greater extent than that seen in the control cells. This value was slightly greater than that for pioglitazone 0.02 μM, which enhanced Akt expression to a 1.4-fold greater degree than in control cells. This result indicates that expression of the Akt effector of PI3 kinase is activated by DLBS3233 and pioglitazone, and this is an important event in the process of conferring insulin sensitivity.Citation12
Induction of GLUT4 gene expression by DLBS3233
To study the activity of DLBS3233 as a glucose transport stimulant, an analysis of GLUT4 gene expression was undertaken. The concentration of DLBS3233 that stimulated the highest GLUT4 expression in 3T3 cells was 5 μg/mL (), and could enhance GLUT4 expression to a 1.9-fold greater extent than in control cells (). This result indicates that DLBS3233 extract significantly increased GLUT4 expression, leading to increased glucose uptake in cells, as shown in .
In addition, the upregulation of GLUT4 expression by DLBS3233 was compared with that of pioglitazone in the presence and absence of insulin (). It was found that DLBS3233 at the concentration of 5 μg/mL induced the expression of GLUT4 by up to 2-fold compared with controls, exceeding that of pioglitazone (1.25-fold) and that of insulin alone (1.35-fold).
Effect of DLBS3233 on GLUT4 protein levels
We examined GLUT4 protein levels and showed that DLBS3233 5 μg/mL increased total GLUT4 in adipocytes to an approximately 2.5-fold greater extent than in control cells (P < 0.05, ). These data are in accordance with the level of GLUT4 expression at the RNA level after DLBS3233 administration, which indicates that DLBS3233 could control GLUT4 at both the RNA level and protein level.
Effect of DLBS3233 on adiponectin and resistin expression in 3T3-Swiss albino cells
The effect of DLBS3233 on adiponectin and resistin expression was explored. The administration of DLBS3233 showed an increase of adiponectin expression to a 1.7-fold greater extent than in controls, while the administration of pioglitazone did not show a significant effect ().
Figure 4 DLBS3233 increases transcription level of adiponectin (A), and decreases transcription level of resistin (B) in 3T3 Swiss albino preadipocytes.
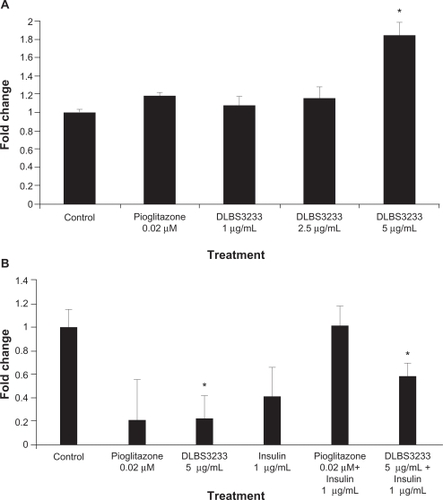
We also investigated the expression of resistin as a marker of insulin resistance in response to DLBS3233 with or without insulin. A decrease in resistin gene expression was observed in the DLBS3233-treated group (). These data suggest that insulin resistance in 3T3 cells decreased as expected. In this regard, administration of DLBS3233 5 μg/mL decreased 80% of resistin expression compared with the control group, even in the presence of insulin. Moreover, the combination of insulin and DLBS3233 reduced gene expression by more than that achieved by a combination of insulin and pioglitazone.
Effect of DLBS3233 on glucose, triglycerides, total cholesterol, LDL, and HDL levels
The effect of DLBS3233 on blood glucose control was also observed in vivo using animal models. The administration of a high-glucose diet increased the concentration of blood glucose by up to 41.33% in normal conditions, by 49.02% in 2-hour postprandial conditions, and by 60.22% in overnight fasting conditions. It also increased insulin, total cholesterol, LDL, and triglyceride levels by up to 220.38%, 59.59%, 31.70%, and 61.39%, respectively. On the other hand, HDL levels decreased by up to 17.15%.
Treatment with DLBS3233 9 mg/kg body weight for a further 2 weeks achieved a significant decrease in random glucose (by 29.64%, ), postprandial glucose (by 30.62%, ), and fasting glucose (by 31.41, ). Similar results were also found for other biochemical parameters, including for insulin (), triglycerides (), total cholesterol (), and LDL levels (), with decreases of 64.71%, 33.78%, 21.36%, and 30.81%, respectively. The levels of these biochemical parameters were lower when compared with those in the insulin-resistant group, and were approximately equal to those reached in normal conditions. Moreover, HDL levels in insulin-resistant rats treated with DLBS3233 were almost the same as normal, and 18.20% higher compared with levels in the insulin-resistant group ().
Figure 5 Effect of DLBS3233 9 mg/kg body weight on the levels of glucose (A), postprandial glucose (B), fasting glucose (C), insulin (D), triglycerides (E), total cholesterol (F), low-density lipoprotein (G), and high-density lipoprotein (H) in insulin-resistant Wistar rats, and comparison of fasting glucose and insulin level (I) and further expressed as homeostasis model assessment (J).
Abbreviation: GF, glucose and fructose.
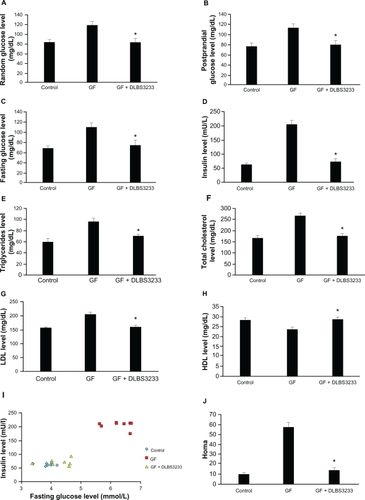
Furthermore, fasting glucose and insulin levels for each individual rat were compared, and are shown in . Insulin and fasting glucose levels were both increased in Group 2, and as the graph indicates, were far from those seen in the normal condition. However, after DLBS3233 was administered, the fasting glucose and insulin levels became similar to those in the normal condition. This comparison was used further to evaluate fasting glucose and insulin levels in each group, and were expressed by homeostasis model assessment. The calculation result shows that the homeostasis model assessment in the insulin-resistant group was increased up to five-fold, and then decreased significantly after treatment with DLBS3233 ().
Discussion and conclusion
In this gene expression study, we have demonstrated that DLBS3233, a standardized herbal extract containing L. speciosa and C. burmannii, acts as an insulin sensitizer via modulation of PPARγ. Initially, we found that the capacity and time course of DLBS3233 glucose uptake was comparable with that of pioglitazone (). However, addition of insulin to DLBS3233 did not increase glucose uptake at the 6-hour treatment, although it shortened the time for onset of action to 2 hours as opposed to 4 hours, achieving its maximum uptake in the fourth hour. This suggests that an additional insulin pool is needed for DLBS3233 to work as an insulin sensitizer and activator of glucose uptake. A similar finding has been found for rosiglitazone, which belongs to the TZD class.Citation1
TZDs comprise a new class of orally active drugs that are designed to enhance the actions of insulin. These agents reduce insulin resistance by increasing insulin-dependent glucose disposal and reducing hepatic glucose output. Although the precise mechanism of action of these drugs remains unknown, transcriptional changes are observed in tissue culture cells that enhance insulin action. This regulation of gene expression appears to be mediated by the interactions of the TZDs with the PPAR family.Citation13
Our results show that DLBS3233 has the capacity to increase PPARγ expression () similar to the TZD class of drugs. The PPARs compose a nuclear receptor subfamily and consists of three isoforms, α, δ, and γ, which are encoded by three separate genes.Citation14 These are ligand-regulated transcription factors, the main physiological actions of which are mediated by altering gene expression. PPARγ is highly expressed in adipose tissue. Activation of PPARγ induces adipocyte differentiation and lipid accumulation in adipocytes by modulating numerous genes regulating adipogenesis, lipid uptake, and lipid metabolism. Hence, it can be inferred that DLBS3233 has the same mechanism of action as that of the TZD class in increasing cellular glucose uptakeCitation15 and insulin sensitivity.
Based on these data, we performed a DLBS3233 study of PI3 kinase because PPARγ plays an important role in regulating this enzyme, which has a pivotal role in mediating the biological actions of insulin through IRS-1 and 2.Citation11,Citation16 It was found that DLBS3233 enhanced PI3 kinase expression to an even greater extent than pioglitazone (). This finding was confirmed by the increase in tyrosine phosphorylation upstream of PI3 kinase, as well as in Akt, a downstream effector of PI3 kinase.
Tyrosine phosphorylation is the beginning of the intracellular signal transduction pathway which activates PI-3 kinase.Citation17,Citation18 The presence of glucose and insulin will stimulate this phosphorylation. As expected, administration of insulin promotes tyrosine phosphorylation. This experiment also showed that DLBS3233 promotes this phosphorylation (), which is consistent with the previous result showing that DLBS3233 works via the insulin signaling pathway.
Akt, also known as protein kinase B, is a member of the serine/threonine-specific protein kinase family.Citation11,Citation12 It is an important signaling molecule in the insulin signaling pathway. It is required for the insulin-induced translocation of GLUT4 to the plasma membrane.Citation12,Citation13 It has been found previously that impaired insulin-stimulated glucose transport is responsible for reducing the rate of insulin-stimulated muscle glycogen synthesis in patients with type 2 diabetes mellitus.Citation19 A pathway in which GLUT4 is expressed on the plasma membrane begins with insulin binding to the receptor in its dimeric form.Citation11,Citation16,Citation19 The receptor phosphorylates and subsequently activates IRS1, which converts PIP2 to PIP3. PIP3 is bound to Akt, signaling for PDK1 to phosphorylate Akt.Citation11 Once phosphorylated, Akt is in its active form and phosphorylates other targets that stimulate GLUT4 to be expressed on the plasma membrane.Citation12 This result indicates that DLBS3233 is a stimulator of glucose transport because it upregulates GLUT4 expression (). This result corresponds with the increase in total GLUT4 protein levels ().
In addition to its effect on the PI3/Akt pathway, DLBS3233 was shown to upregulate adiponectin () and downregulate resistin (). Adiponectin, which is regulated by PPARγ, is a 30 kDa protein containing a short central collagenous region and a C-terminal tumor necrosis factor alpha-like domain.Citation20 It potentiates inhibition of hepatic gluconeogenesis by insulin, and therefore its levels are reduced in obese insulin-resistant subjects and type 2 diabetics.Citation21 Additionally, resistin, which is another gene known to be associated with type 2 diabetes, was also observed in this study. It has recently been identified as a novel derived hormone.Citation22 Results of the adiponectin and resistin study are in agreement with our previous observation indicating that the mechanism of action for DLBS3233 is via PPARγ, thereby increasing insulin sensitivity and reducing insulin resistance.
The effect of DLBS3233 was further seen in the Wistar rat study. The rats were rendered insulin-resistant by administration of fructose and glucose, leading to uncontrolled insulin action. Fructose stimulates hepatic production of triglycerides by promoting the re-esterification of circulating nonesterified fatty acids and by stimulating de novo fatty acid synthesis. Increased delivery of triglycerides or nonesterified fatty acids to the muscle interferes with the utilization of glucose, impairing insulin action.Citation3 Administration of DLBS3233 to insulin-resistant rats brought the levels of glucose, insulin, lipoproteins, total cholesterol, and triglycerides into the normal range (). Moreover, the homeostasis model assessment index was reduced to normal after DLBS3233 administration, suggesting that DLBS3233 was able to control the insulin resistance (). The homeostasis model assessment is often used to assess insulin resistance and beta cell function, and requires only fasting glucose and insulin levels.Citation23 It had high sensitivity and specificity for measuring insulin resistance.Citation24
Taken together, these data suggest that DLBS3233 has the activity to control blood sugar, insulin, and other lipoproteins, including HDL, LDL, triglycerides, and total cholesterol. Currently, clinical trials of DLBS3233 are underway in a number of hospitals. The value of such an herbal drug in the treatment of diabetes in terms of insulin resistance will be meaningful in light of the recent finding that TZDs can actually increase cardiovascular risk in already burdened patients.
Acknowledgements
We thank Veronika Yuliani for her contribution to this work. We are also grateful for the help of Professors Maggy Suhartono, Annemarie Basson, and Audrey Clarissa, and Venni Carolina for careful reading of the manuscript.
Disclosure
The authors report no conflicts of interest in this work.
References
- EdvardssonUBergströmMAlexanderssonMBambergKLjungBDahllöfBRosiglitazone (BRL49653), a PPARγ-selective agonist, causes peroxisome proliferator-like liver effects in obese miceJ Lipid Res1999401177118410393202
- ChaoLMarcus-SamuelsBMasonMMAdipose tissue is required for the antidiabetic, but not for the hypolipidemic effect of thiazolidinedionesJ Clin Invest20001061221122811086023
- HaratiMAniMMessripourMEffect of vanadyl sulfate on fructose-induced insulin resistance ratIran Biomed J20037179182
- LiuFKimJ-KLiYLiuXLiJChenXAn extract of Lagerstroemia speciosa L has insulin like glucose uptake stimulatory and adipocytes differentiation-inhibitory activities in 3T3-L1 cellsJ Nutr20011312242224711533261
- HattoriKSukenobuNSasakiTActivation of insulin receptors by lagerstroeminJ Pharmacol Sci200393697314501154
- LiuXKimJ-KLiYLiJLiuFChenXTannic acid stimulates glucose transport and inhibits adipocyte differentiation in 3T3-L1 cellsJ Nutr200413516517115671208
- ShengXZhangYGongZHuangCZangYQImproved insulin resistance and lipid metabolism by cinnamon extract through activation of peroxisome proliferator-activated receptorsPPAR Res2008200858134819096709
- AndersonRABroadhurstCLPolanskyMMIsolation and characterization of polyphenol type-A polymers from cinnamon with insulin-like biological activityJ Agric Food Chem200452657014709014
- BaileyRWThe reaction of pentoses with anthroneBiochem J19576866967213522678
- PickavanceLCTadayyonMWiddowsonPSBuckinghamREWildingJPHTherapeutic index for rosiglitazone in dietery obese rats: Separation of efficacy and haemodilutionBr J Pharmacol19991281570157610602338
- PessinJESaltielARSignaling pathways in insulin action: Molecular targets of insulin resistanceJ Clin Invest200010616516910903329
- CongLNChenHLiYPhysiological role of Akt in insulin-stimulated translocation of GLUT4 in transfected rat adipose cellsMol Endocrinol199711188118909415393
- SaltielAROlefskyJMThiazolidinediones in the treatment of insulin resistance and type II diabetesDiabetes199645166116698922349
- BergerJMollerDEThe mechanism of action of PPARsAnnu Rev Med20025340943511818483
- WuZXieYMorrisonRFBucherNLFarmerSRPPARγ induces the insulin-dependent glucose transporter GLUT4 in the absence of C/EBPα during the conversion of 3T3 fibroblasts into adipocytesJ Clin Invest199810122329421462
- ShulmanGICellular mechanisms of insulin resistanceJ Clin Invest200010617117610903330
- ChouhuryGGAbboudHETyrosine phosphorylation-dependent PI3 kinase/Akt signal transduction regulates TGFβ-induced fibronectin expression in mesangial cellsCell Signal200416314114607273
- RothenbergPLWillisonLDSimonJWolfBAGlucose-induced insulin receptor tyrosine phosphorylation in insulin-secreting beta-cellsDiabetes1995448028097540574
- ClineGWPetersenKFKrssakMImpaired glucose transport as a cause of decreased insulin-stimulated muscle glycogen synthesis in type 2 diabetesN Engl J Med199934124024610413736
- BergAHCombsTPDuXBrownleeMSchererPEThe adipocytesecreted protein Acrp30 enhances hepatic insulin actionNat Med2001794795311479628
- BergerJPRole of PPARγ, transcriptional cofactor and adiponectin in the regulation of nutrient metabolism, adipogenesis and insulin action: View from the chairInt J Obes200529S3S4
- SteppanCMBaileySTBhatSThe hormone resistin links obesity to diabetesNature200140930731211201732
- ChangAMSmithMJBloemCJGaleckiATHalterJBSupianoMALimitation of the homeostasis model assessment to predict insulin resistance and beta-cell dysfunction in older peopleJ Clin Endocrinol Metab20069162963416317057
- KeskinMKurtogluSKendirciMAtabekMEYaziciCHomeostasis model assessment is more reliable than the fasting glucose/insulin ratio and quantitative insulin sensitivity check index for assessing insulin resistance among obese children and adolescentsPediatrics2005115500503