Abstract
Self-reported hypersensitivity to food is a common condition and many of these patients have indications of intestinal immune activation. Dendritic cells (DCs) are recognized as the most potent antigen-presenting cells involved in both initiating immune responses and maintaining tolerance. The aims of this study were to evaluate the DC populations with their phenotype and T cell stimulatory capacity in patients with food hypersensitivity and to study its relationship with atopic disease. Blood samples from 10 patients with self-reported food hypersensitivity, divided into atopic and nonatopic subgroups, and 10 gender- and age-matched healthy controls were analyzed by flow cytometry using the Miltenyi Blood Dendritic cells kit. Monocyte-derived DCs (moDCs) were evaluated concerning their phenotype and T cell stimulatory capacity. DC populations and cell surface markers were not significantly different between patients and healthy controls, but moDCs from atopic patients expressed significantly more CD38 compared to moDCs from nonatopic patients. Moreover, lipopolysaccharide stimulated moDCs from atopic patients produced significantly more interleukin-10 compared to nonatopic patients. CD38 expression was correlated to total serum immunoglobulin E levels. These findings support the notion of immune activation in some patients with self-reported food hypersensitivity. They need to be confirmed in a larger cohort.
Introduction
Self-reported hypersensitivity to food is common in the general population, but there is a big discrepancy between perceived food hypersensitivity (20%) and medically confirmed food allergy (3%–5%).Citation1 Food allergy can be immunoglobulin E (IgE)-mediated (immediate, type I reactions) or non-IgE-mediated (delayed-type hypersensitivity, type III or IV).Citation2 Medically confirmed allergic reactions are usually IgE-mediated, but non-IgE-mediated (cell-mediated) reactions also exist and are more difficult to diagnose. Gastrointestinal symptoms, especially diarrhea, abdominal pain, and bloating, are among the most common complaints attributed to food hypersensitivity. In our previous studies, the majority of patients with self-reported food hypersensitivity had irritable bowel syndrome (IBS).Citation3 And as in patients with IBS, administration of low-digestible carbohydrates often replicated their gastrointestinal symptoms.Citation4 However, the underlying pathophysiological mechanisms of the IBS-like complaints in patients with food hypersensitivity are unknown so far, and there are no current standard diagnostic methods available for diagnosing non-IgE-mediated delayed-type hypersensitivity reactions, which remain as a possible cause in many of the patients.Citation5
The mucosa of the gastrointestinal tract is constantly in contact with food proteins and bacteria. Dietary protein antigens interact with specific antigen-presenting cells (APCs), which help to activate regulatory T cells, usually resulting in a suppression of immune responses.Citation6 Dendritic cells (DCs) are recognized as the most potent APCs with the unique ability to initiate and maintain primary immune responses.Citation7 DCs acquire antigens in the periphery and migrate to the lymph nodes where antigen-specific T lymphocytes recognize the presented peptide antigens and mount an immune response.Citation7,Citation8 Moreover, DCs are pivotal in inducing tolerance. Initially it was thought that this was restricted to immature DC that present self-antigens in the absence of an additional stimulus to circulating naïve T cells in peripheral lymphoid organs. In the case of autoreactivity, this will normally lead to anergy or deletion of auto-reactive T cells, thereby inducing tolerance.Citation9,Citation10 However, this view was challenged when it was shown that also DCs with a mature phenotype are able to expand regulatory T cells (Tregs).Citation11 Therefore, it has been suggested that the main criteria for the direction of the immune response – induction of immunity or tolerance – are the choice of DC population, maturation status, antigen dosage, and cytokine milieu.Citation12
DCs comprise a heterogeneous cell population which can be divided into two main lineages, myeloid DC (mDC), also called conventional DC, and plasmacytoid (pDC). The latter produces large amounts of type I interferons (INF-α, -β, and -ω) in response to viral infections, and are also known as natural interferon-producing cells (IPC).Citation13,Citation14 The mDC lineage consists of several cell subsets with different functions that can be found almost everywhere in the body. It is still a matter of debate to what extent cell populations characterized in mice correspond to populations identified in humans,Citation15 but it is clear that DC subsets have distinct functions. In human peripheral blood, mainly three DC populations can be distinguished: pDCs, characterized as lin−/HLA-DR+/CD123+/CD303+, type-1 mDC (mDC1; lin−/HLA-DR+/CD1c+), and type-2 mDC (mDC2; lin−/HLA-DR+/CD141+).Citation16
In the intestines, DCs are present in the lamina propria of the small and large bowel, Peyer’s patches (PPs) and mesenteric lymph nodes. DCs have an essential role in directing the balance between tolerance and immunity by cytokines and expression of costimulatory molecules. In the gut, particulate (insoluble) antigens are taken up in two ways: i) DCs can directly sample antigens by extending processes through the epithelium and into the lumen; and ii) M cells which overlie PPs can take up antigens and deliver them to subepithelial DCs. However, soluble antigens cross the epithelium through transcellular or paracellular routes, via brush border membrane and tight junctions, respectively.Citation6,Citation17 After sampling of antigen by DCs, they present them as peptide – major histocompatibility complex (MHC) complexes to effector T-cells in lymphoid organs.
The role of DCs in intestinal food hypersensitivity has not been evaluated fully. In the present pilot study, we wanted to investigate whether DC populations from patients with self-reported food hypersensitivity differ from those of healthy age- and gender-matched individuals, and their relationship with atopic disease. For this purpose, we enumerated the DC populations present in peripheral blood and analyzed monocyte-derived DCs with regard to their phenotype and T cell stimulatory capacity.
Material and methods
Patients
Ten consecutive patients referred to the Haukeland University Hospital because of abdominal complaints self-attributed to food hypersensitivity were included in the study. Organic diseases such as inflammatory bowel diseases (IBD), severe anaphylactic reactions, and pregnancy or lactation were exclusion criteria.
The patients went through an extensive clinical examination including both allergological and gastroenterological examinations as reported previously.Citation3 Briefly, the allergological examination consisted of a full medical history including atopy, family history, suspected food items, serum levels of total and food-specific IgE, and skin prick tests using a panel of inhalant and food antigens (ALK; Abello, Hørsholm, Denmark). The serum levels of total and food-specific IgE were analyzed by ImmunoCap-System (Phadia, Uppsala, Sweden). Open provocation test and double-blind placebo-controlled food challenge test (DBPCFC) were performed by a dietician when indicated according to medical history and results of skin prick test and food-specific IgE levels in serum. The gastroenterological examination included a screening questionnaire based on the Rome II criteria for the diagnosis of IBS,Citation18 and gastroscopy with gastric and duodenal biopsies to diagnose Helicobacter pylori infection and celiac disease, respectively. Stool tests were performed to exclude gastrointestinal infections.
The control group consisted of 10 gender- and age-matched healthy controls without indication of allergic disease, including a history of atopy, recruited from the same geographical area as the patients. Blood (40–50 mL) was taken in heparin tubes from all patients and healthy controls. At the time of blood taking the patients were neither on an elimination diet nor being exposed to food challenge. All blood samples were processed within 2 hours.
The study was approved by the Western Norway Regional Committee for Medical Research Ethics and the subjects gave informed consent for the study.
Enumeration of DC subsets in peripheral blood
DC populations were stained with the Blood DC Enumeration kit (Miltenyi Biotec, Bergisch Gladbach, Germany), according to the manufacturer’s instructions. Cells were analyzed on a BD FACSCanto I flow cytometer (BD Bioscience, San Jose, CA) and data analyses were performed using FlowJo software (Tree Star Inc., Ashland, OR).
Ex vivo generation of monocyte-derived dendritic cells (moDCs)
DCs were generated from monocytes isolated from heparinized blood from patients and gender- and age-matched healthy controls as described previously.Citation19 Briefly, peripheral blood mononuclear cells were separated by density gradient centrifugation and the monocytes were then isolated by plastic adherence. The monocytes were cultured with interleukin- 4 (IL-4, 20 ng/mL; Immunotools, Friesoythe, Germany) and granulocyte macrophage colony-stimulating factor (100 ng/mL; Immunotools) in RP10 medium (RPMI 1640; Cambrex Bioscience, Verviers, Belgium) with 10% FCS (PAA, Pasching, Austria); 100 units/mL penicillin and 100 μg/mL streptomycin (Sigma-Aldrich, St. Louis, MO) for 5–6 days to generate immature DC. Cytokines were replenished every 2–3 days. In some experiments, maturation of the cells was induced by addition of LPS on day 5 (100 ng/mL; Sigma-Aldrich, Oslo, Norway) for 24 hours.
Immunostaining
Phenotypic characterization of moDC was performed using monoclonal mouse anti-human CD1a-PE (NA1/34-HLK), CD14-FITC (UCHM1), HLA-DR-APC (HL-39), CD38-Alexa Fluor 647 (AT13/5), CD40-FITC (LOB7/6), CD83-PE (HB15e), CD86-FITC (BU63) (AbD Serotec, Düsseldorf, Germany), CD80-APC (MEM-233; Immunotools), and CCR7-PE (R&D systems, Abingdon, UK). The cells were incubated with titrated antibodies for 10 minutes at room temperature before they were washed and analyzed immediately on a FACSCanto I flow cytometer. All subsequent analyses were done using FlowJo software. One percent false-positive events were accepted throughout the analyses.
Mixed lymphocyte reaction
Responding cells (2 ×10⁵) from allogeneic nonadherent cells labeled with CFSE (Vybrant® CFDA SE Cell Tracer Kit; Invitrogen, Carlsbad, CA) were co-cultured with various numbers of DC (2 × 10⁴ and 5 × 10⁴) in 96-well flat-bottom microtiterplates (Greiner Bio-One GmbH, Frickenhausen, Germany). CFSE intensity was measured on day 5 using a FACSCanto I flow cytometer. All subsequent analyses were done using FlowJo software.
Cytokine determination
Concentrations of IL-6, IL-10, and IL-12p70 in supernatants from moDC cultures were measured with commercially available two-site sandwich ELISAs from BioLegend (Uithoorn, The Netherlands) or R&D Systems (Minneapolis, MN) according to the manufacturer’s instructions.
Statistical analysis
Statistical analyses were performed by using GraphPad Prism 5.0 (GraphPad Prism Software Inc., La Jolla, CA). Data are presented as percentage of analyzed leukocytes. Values are expressed as the median, in some cases with interquartile ranges (IQR). A two-tailed Mann–Whitney U test was used for comparison of groups. Correlation between total IgE and CD38 expression in patients was analyzed using Spearman’s rank correlation test.
Results
Subjects characteristics
Patients (six female, four male, age range 19–54 years, mean age 31 years) and controls (five female, five male, age range 20–57 years, mean age 34 years) were comparable with respect to age and gender.
In the patients, cow’s milk (60% of the patients) and wheat flour (60%) were the most commonly suspected food item, and diarrhea (80%) and abdominal pain (80%) were the most common gastrointestinal symptoms, followed by bloating (50%) and nausea (20%).
The patients were divided into atopic and nonatopic subgroups, according to history, specific IgE in serum and skin prick tests. Atopic individuals were defined as having at least one positive skin prick test and/or elevated levels of specific IgE in serum to at least one allergen, as well as personal history of at least one of the following atopic symptoms: atopic dermatitis, asthma, or rhinoconjunctivitis.Citation20 Five of 10 patients were classified as having atopic disease. Four of those were sensitized to at least one inhalant allergen, as verified by skin prick test and/or serum-specific IgE whereas three of the atopic patients were sensitized to at least one food allergen. Birch (80%) and timothy grass (80%) were the most common inhalant allergen, while wheat flour (60%) and peanuts (40%) were the most common food allergen. Of the atopic patients, four had atopic dermatitis (80%), three had rhinoconjunctivitis (60%), and one had asthma (20%). Total serum IgE levels were significantly higher in the atopic patients (median, 141 kU/L; IQR, 45–554 kU/L) than in the nonatopic patients (median, 19 kU/L; IQR, 7–32 kU/L; P < 0.008).
DBPCFC was positive in one patient (10% of the whole study population), which indicates non-IgE-mediated allergy or nonallergic food hypersensitivity. None of the patients had IgE-mediated food allergy as confirmed by both skin prick test, food-specific IgE levels in serum, and DBPCFC with the same food item. Nine of 10 patients (90%) had gastrointestinal symptoms consistent with IBS, according to the Rome II criteria.
Dendritic cell enumeration and phenotyping
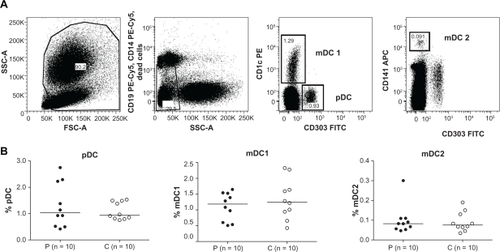
Using the Blood DC Enumeration kit (Miltenyi Biotec), we could not detect differences in the peripheral blood DC populations between patients with food hypersensitivity and healthy controls (). The subgroups, pDCs, mDC1, and mDC2, were similar in patients and in controls.
Figure 1 Patients with self-reported food hypersensitivity have similar percentage of peripheral blood DC populations compared to healthy controls. DC subsets among leukocytes in peripheral blood were analyzed using the Blood DC Enumeration kit (Miltenyi Biotec) on freshly heparinized whole blood samples. A) Representative plots showing the gating strategy for pDC, mDC1, and mDC2. B) Scatter plots with median lines.
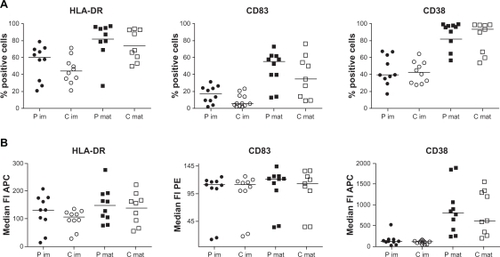
Concerning the phenotype of moDCs, we analyzed DC markers (CD14− and CD1a+), costimulatory molecules (CD40, CD80, and CD86), DC maturation markers (CD83 and MHC class II), and molecules shown to be important for migration of DC (CCR7 and CD38) in unstimulated and lipopolysaccharide (LPS)-stimulated cells. We could not detect any obvious differences of expression levels between patients and controls, even if the expression of MHC class II and CD83 was slightly increased in both unstimulated and LPS-stimulated moDCs of patients ().
Figure 2 Monocyte-derived dendritic cells (moDCs) from patients with self-reported food hypersensitivity have similar phenotypes as moDCs from healthy controls. Expression of MHC class II, CD83 and CD38 of immature (im, n = 10 each) and LPS-stimulated (mat, n = 9 each) moDCs from patients (P, filled symbols) and controls (C, open symbols) did not differ significantly, either analyzed as percentage of positive cells (A) or as median fluorescence intensity (B). Analysis performed by flow cytometry accepting 1% false positive events throughout.
Dendritic cells in atopic disease
Comparing DC populations in the peripheral blood (pDCs, mDC1, and mDC2) for atopic and nonatopic subgroups yielded no obvious differences between the subgroups (data not shown).
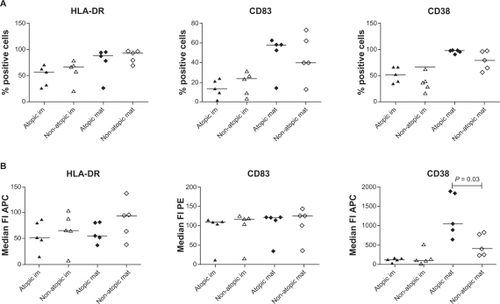
Concerning the phenotype, LPS-stimulated moDCs from atopic patients expressed significantly more CD38 compared to nonatopic patients analyzed by median fluorescence intensity (atopic = 1055, nonatopic = 405; P = 0.03; ) even though the percentage positive cells was not significantly different (atopic = 99%, nonatopic = 79%; ). MHC class II and CD83 expression did not differ significantly between atopic and nonatopic patients, either analyzed as percentage of positive cells or median fluorescence intensity (). The same results regarding median fluorescence intensity were obtained when gating on marker positive cells only. Interestingly, CD38 expression was significantly correlated to total serum IgE levels in patients (r = 0.89, P = 0.001).
Figure 3 LPS-stimulated moDCs from atopic patients express significantly more CD38 compared to similarly stimulated moDCs from nonatopic patients. Surface expression of MHC class II, CD83 and CD38 was analyzed by flow cytometry on immature (im, n = 5 each) and LPS-stimulated (mat, n = 4 each) moDCs. MHC class II and CD83 expression did not differ significantly between atopic (filled symbols) and nonatopic (open symbols) patients, either analyzed as percentage of positive cells (A) or as median fluorescence intensity (B). Analysis performed as described in .
Functional analyses
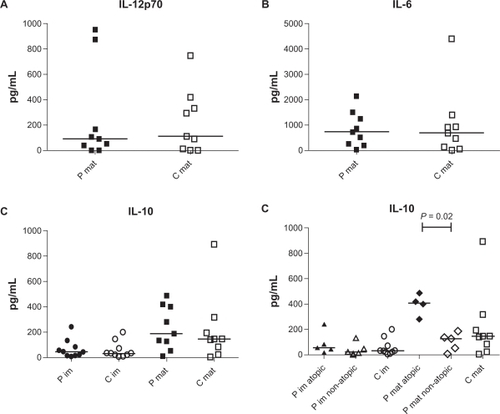
We next analyzed the amount of IL-6, IL-10, and IL-12p70 in the supernatants of the moDC cultures. As expected, no IL-6 or IL-12p70 were produced from immature moDCs. The median level of IL-6 and IL-12p70 produced from LPS-stimulated moDCs from patients and controls was similar (IL-6: patients 741 pg/mL, controls 708 pg/mL; IL-12p70: patients 91.26 pg/mL, controls 109.3 pg/mL; ). LPS stimulation increased IL-10 production in both controls and patients (immature patients 47.44 pg/mL, immature controls 34.83 pg/mL, LPS–stimulation patients 189.9 pg/mL, LPS–stimulation controls 146.6 pg/mL, ). When we divided the patients into atopic and nonatopic subgroups, we found that LPS-stimulated moDCs from atopic patients produced significantly more IL-10 compared to cells from nonatopic patients (atopic 410.1 pg/mL, nonatopic 129.9 pg/mL; P = 0.02; ).
Figure 4 Monocyte-derived dendritic cells (moDCs) from atopic patients produce significantly more IL-10 after LPS stimulation than stimulated moDCs from nonatopic patients or healthy controls. Cytokine production was analyzed by ELISA. A) IL-12p70 production from LPS-stimulated moDCs from patients (P mat, filled square; n = 9) and controls (C mat, open square; n = 9) did not differ significantly. B) No difference in IL-6 production from LPs-stimulated moDcs from patients (P mat, filled square; n = 9) and controls (C mat, open square; n = 9) was observed. C) Immature moDCs from patients (P im, filled circle; n = 10) and controls (C im, open circle; n = 10) produce similar amounts of IL-10. LPS stimulation (mat) increased IL-10 production in both patients (filled square; n = 9) and controls (open square; n = 9). D) Immature moDCs from atopic (filled triangle; n = 5) and nonatopic patients (open triangle; n = 5) secreted similar amounts of IL-10 as cells from controls (open circle; n = 10). LPS-stimulated moDCs from atopic patients (filled diamond; n = 4) secreted significantly more IL-10 than LPS-stimulated moDCs from nonatopic patients (open diamond; n = 5).
Analyzing the T cell stimulatory capacity of the generated DC populations in an allogeneic MLR, we detected no obvious differences between cells from patients and controls, either analyzed together or divided into atopic and nonatopic (data not shown).
Discussion
A relationship between food intolerance and IBS is well recognized. Up to 70% of the IBS patients report adverse reactions to one or more food items, and almost 90% of IBS patients show evidence of immune activation.Citation21,Citation22 Previous immunological studies indicate important functions of T and B cells in patients with IBS, but we are unable to find information about DCs.Citation23 In the present study, most of the patients (90%) had IBS-like gastrointestinal symptoms in response to food intake. Recently, we have shown that more than 60% of patients with self-reported food hypersensitivity have indications of atopic disease and abnormally high numbers of “IgE-armed” mast cells in their duodenal mucosa which was correlated to serum total IgE levels.Citation24 Patients with self-reported food hypersensitivity also had increased concentration of B cell-activation factor (BAFF) in gut lavage fluid and blood,Citation25 indicating intestinal immune activation in many of these patients. The driving force is not known. BAFF is mainly produced and secreted by myeloid cells such as DCs, macrophages, and monocytes. If intestinal allergens are involved, intestinal DCs may play a role. We therefore analyzed various DC populations in the present study.
A vast number of antigens are encountered by the intestine, which needs to distinguish between invading pathogens and other nonself antigens introduced as part of an individual’s diet. Some DC populations localized in the lamina propria of the small intestine and in mesenteric lymph nodes have been shown to be important in inducing Treg and nonreactivity in the steady state. In patients with active IBD, alterations of DC populations in both peripheral blood and intestinal mucosa have been described and an involvement of DCs in the imbalance between Treg and Th17 cells has been proposed.Citation26,Citation27 Furthermore, peripheral blood DCs from IBD patients expressed more costimulatory moleculesCitation28 and displayed aberrant response upon LPS stimulation.Citation29 In the present pilot study, patients with self-reported food hypersensitivity had normal DC populations in peripheral blood and the phenotype of moDCs was similar in patients and healthy controls. However, atopic and nonatopic patients showed significantly different CD38 expression on LPS-stimulated moDCs. The multifunctional surface marker CD38 is a receptor with ectoenzymatic activity. It catalyzes the production of adenosine diphosphate (ADP)-ribose (ADPR) and cyclic ADPR from NAD+ resulting in calcium influx. In animal models, CD38-deficient mice are defective in mounting innate and adaptive immune responses and have impaired migration of neutrophils, monocytes, and DCs.Citation30,Citation31 In addition, these mice exhibit strongly reduced allergen-induced airway hyperresponsiveness, which is accompanied by a decrease in hallmarks of pulmonary inflammation, as well as Th2 cytokine levels (IL-4, IL-5, and IL-13). Concerning CD38 expression on moDCs, Fedele and colleagues showed that CD38 is highly expressed on monocytes, downregulated during DC development, and upregulated upon maturation of moDCs.Citation32 Moreover, CD38 has been shown to be important for migration, survival, and Th1 immune responses of mature moDCs.Citation33 However, not much is known about the consequences of CD38 overexpression on DCs.
DCs play an important role in allergic airway disease. Increased numbers of airway mucosal DCs are found in both allergic rhinitis and asthma, and these DCs express the high affinity IgE receptor. Treatment of asthma patients with inhaled steroids predictably leads to a decrease in airway DC numbers. Another work showed a rapid disappearance of myeloid DC precursors from the circulation, but recruitment of these cells into the airway mucosa after short-term allergen inhalation.Citation34 Recruitment of DCs within the intestinal mucosa during inflammation was also shown in patients with IBD.Citation35,Citation36 Therefore, mucosal DC characteristics in response to food challenge should be investigated in future studies in patients with self-reported food hypersensitivity.
In conclusion, even though only a limited number of patients were included in the present pilot study, atopic patients had significantly higher CD38 expression on LPS-stimulated moDCs compared to nonatopic patients. Moreover, LPS stimulated moDCs from atopic patients produced significantly more IL-10 compared to nonatopic patients. This is an interesting finding as it has been shown previously that in inflammatory conditions, IL-10 is responsible for the expression of Foxp3 in Tregs.Citation37 It is still a matter of debate, however, whether an increase in IL-10 leads to an increase in IgE production.Citation38 Interestingly, CD38 expression was correlated to total serum IgE levels in patients. These findings support the notion of immune activation in some patients with self-reported food hypersensitivity. Further studies including DC populations in the intestinal mucosa and in response to food challenge are warranted.
Acknowledgments/Disclosure
We thank all patients and healthy controls for kindly donating blood for our study and Dagny Ann Sandnes and Marie Karlsen for excellent technical help. The authors have been financially supported by the Faculty of Medicine and Dentistry at the University of Bergen, the Strategic Research Program at Helse Bergen, the Western Norway Health Authority, the Broegelmann Foundation, the Norwegian Cancer Society and Bergen Research Foundation. The authors report no conflicts of interest in this work.
References
- YoungEStonehamMDPetruckevitchABartonJRonaRA population study of food intoleranceLancet1994343112711307910231
- O’LearyPFShanahanFFood allergiesCurr Gastroenterol Rep2002437338212228039
- ArslanGKahrsGELindRFroylandLFlorvaagEBerstadAPatients with subjective food hypersensitivity: the value of analyzing intestinal permeability and inflammation markers in gut lavage fluidDigestion200470263515297775
- GibsonPRShepherdJEvidence-based dietary management of functional gastrointestinal symptoms: The FODMAP approachJ Gastroenterol Hepatol20102525225820136989
- AseroRBallmer-WeberBKBeyerKIgE-mediated food allergy diagnosis: Current status and new perspectivesMol Nutr Food Res20075113514717195271
- BurksAWLaubachSJonesSMOral tolerance, food allergy and immunotherapy: Implications for future treatmentJ Allergy Clin Immunol20081211344135018410959
- BanchereauJSteinmanRMDendritic cells and the control of immunityNature19983922452529521319
- HeathWRCarboneFRCross-presentation, dendritic cells, tolerance and immunityAnnu Rev Immunol200119476411244030
- SteinmanRMHawigerDNussenzweigMCTolerogenic dendritic cellsAnnu Rev Immunol20032168571112615891
- HawigerDInabaKDorsettYDendritic cells induce peripheral T cell unresponsiveness under steady state conditions in vivoJ Exp Med200119476977911560993
- YamazakiSIyodaTTarbellKDirect expansion of functional CD25+ CD4+ regulatory T cells by antigen-processing dendritic cellsJ Exp Med200319823524712874257
- RutellaSDaneseSLeoneGTolerogenic dendritic cells: cytokine modulation comes of ageBlood20061081435144016684955
- SiegalFPKadowakiNShodellMThe nature of the principal type 1 interferon-producing cells in human bloodScience19992841835183710364556
- LiuYJIPC: professional type 1 interferon-producing cells and plasmacytoid dendritic cell precursorsAnnu Rev Immunol20052327530615771572
- NaikSHDemystifying the development of dendritic cell subtypes, a littleImmunol Cell Biol20088643945218414430
- BanchereauJKlechevskyESchmittNMoritaRPaluckaKUenoHHarnessing human dendritic cell subsets to design novel vaccinesAnn N Y Acad Sci20091174243219769733
- ChehadeMMayerLOral tolerance and its relation to food hypersensitivitiesJ Allergy Clin Immunol200511531215637539
- ThompsonWGLongstrethGFDrossmanDAFunctional bowel disorders and functional abdominal painGut199945Suppl 2II43II4710457044
- AppelSRupfAWeckMMEffects of imatinib on monocyte-derived dendritic cells are mediated by inhibition of nuclear factor-kappaB and Akt signaling pathwaysClin Cancer Res2005111928194015756019
- JohanssonSGOBieberTDahlRRevised nomenclature for allergy for global use: Report of the nomenclature review committee of the world allergy organization, October 2003J Allergy Clin Immunol200411383283615131563
- MonsbakkenKWVandvikPOFarupPGPerceived food intolerance in subjects with irritable bowel syndrome: etiology, prevelance and consequencesEur J Clin Nutr20066066767216391571
- ChadwickVSChenWXShuDActivation of the mucosal immune system in irritable bowel syndromeGastroenterology20021221778178312055584
- OhmanLLindmarkACIsakssonSB-cell activation in patients with irritable bowel syndrome (IBS)Neurogastroenterol Motil20092164465019222763
- LillestølKHelgelandLLiedGAIndication of “atopic bowel” in patients with self-reported food hypersensitivityAliment Pharmacol Ther2010311112112220163379
- LiedGALillestølKValeurJBerstadAIntestinal B cell-activating factor (BAFF): An indication of non-IgE-mediated hypersensitivity reactions to food?Aliment Pharmacol Ther201032667320353497
- RescignoMDiSADendritic cells in intestinal homeostasis and diseaseJ Clin Invest20091192441245019729841
- BaumgartDCMetzkeDSchmitzJPatients with active inflammatory bowel disease lack immature peripheral blood plasmacytoid and myeloid dendritic cellsGut20055422823615647187
- VuckovicSFlorinTHKhalilDCD40 and CD86 upregulation with divergent CMRF44 expression on blood dendritic cells in inflammatory bowel diseasesAm J Gastroenterol2001962946295611693331
- BaumgartDCThomasSPrzesdzingIExaggerated inflammatory response of primary human myeloid dendritic cells to lipopolysaccharide in patients with inflammatory bowel diseaseClin Exp Immunol2009157342343619664152
- Partida-SanchezSGoodrichSKusserKOppenheimerNRandallTDLundFERegulation of dendritic cell trafficking by the ADP-ribosyl cyclase CD38: impact on the development of humoral immunityImmunity20042027929115030772
- Partida-SanchezSCockayneDAMonardSCyclic ADP-ribose production by CD38 regulates intracellular calcium release, extracellular calcium influx and chemotaxis in neutrophils and is required for bacterial clearance in vivoNat Med200171209121611689885
- FedeleGFrascaLPalazzoRFerreroEMalavasiFAusielloCMCD38 is expressed on human mature monocyte-derived dendritic cells and is functionally involved in CD83 expression and IL-12 inductionEur J Immunol2004341342135015114667
- FrascaLFedeleGDeaglioSCD38 orchestrates migration, survival, and Th1 immune response of human mature dendritic cellsBlood20061072392239916293598
- UphamJWThe role of dendritic cells in immune regulation and allergic airway inflammationRespirology2003814014812753527
- MiddelPRaddatzDGunawanBHallerFRadzunHJIncreased number of mature dendritic cells in Crohn’s disease: evidence for a chemokine mediated retention mechanismGut20065522022716118351
- SilvaMAIntestinal dendritic cells and epithelial barrier dysfunction in Crohn’s diseaseInflamm Bowel Dis20091543645318821596
- MuraiMTurovskayaOKimGInterleukin 10 acts on regulatory T cells to maintain expression of the transcription factor Foxp3 and suppressive function in mice with colitisNat Immunol2009101178118419783988
- KobayashiNNagumoHAgematsuKIL-10 enhances B-cell IgE synthesis by promoting differentiation into plasma cells, a process that is inhibited by CD27/CD70 interactionClin Exp Immunol200212944645212197885