
Abstract
Objective
The objective of this study was to apply the newly standardized definition for sarcopenia from the Foundation for the National Institutes of Health (FNIH) and the current definition for obesity to 1) determine the prevalence of sarcopenic obesity (SO) in obese elderly women; 2) compare the muscle strength, lean body mass, and markers of inflammation between obese elderly women with SO and nonsarcopenic obesity (NSO), and 3) elucidate the relationship between appendicular lean mass adjusted for body mass index (aLM/BMI) with muscle strength, lean body mass, and obesity indices.
Methods
A total of 64 elderly obese women (age: 68.35±6.04 years) underwent body composition analysis by dual-energy X-ray absorptiometry. Participants were classified into two groups according to the definition of SO and NSO. Blood samples were collected for total cholesterol, triglycerides, high-density lipoprotein, low-density lipoprotein, uric acid, urea, interleukin-6 (IL-6), glucose, and creatine kinase (CK) measurements.
Results
The SO group presented a significantly greater BMI, fat (%), glucose, a marginal trend toward significance for uric acid, and IL-6 compared to the NSO group. In addition, the SO group displayed lower values for muscle strength and lean body mass. From a correlation standpoint, a higher aLM/BMI was positively associated with lean body mass and muscle strength and negatively associated with a lower BMI and percentage body fat.
Conclusion
The definition criteria from FNIH and obesity permit the ability to illustrate the prevalence and identify SO in elderly women with low muscle mass, low muscle strength, and impaired markers of inflammation.
Introduction
During aging, a decline in muscle mass coupled with an increase in fat mass has important consequences for older adults.Citation1 Four body composition phenotype characteristics exist in older adults: normal, sarcopenic, obese, and a combination of sarcopenic and obese.Citation2 Although the definition of sarcopenic obesity (SO) combines those of sarcopenia and obesity, few diagnostic methods have been proposed in recent years.Citation2–Citation4
Obesity can be diagnosed by total fat mass, percentage body fat, body mass index (BMI), visceral fat area, and waist circumference, while sarcopenia can be diagnosed by appendicular lean mass adjusted for height squared (aLM/heightCitation2 or BMI [aLM/BMI]).Citation6 The aLM/heightCitation2 method has been widely used in many studies, while the aLM/BMI method represents a new clinically relevant criteria for weakness and low muscle mass based on a large, diverse, and well characterized set of populations of community-dwelling elderly persons that permit generalizability of findings.Citation1,Citation5–Citation9
The combination of sarcopenia and obesity has a detrimental impact on physical functional status in obese elderly women, which in turn exacerbates disability.Citation2,Citation10 SO is also associated with systemic inflammation (eg, higher C-reactive protein, fibrinogen, interleukin-6 [IL-6]), lower handgrip strength, lower lean body mass, higher mortality risk, lower muscle quality caused by fat infiltration, impaired quality of life, higher cardiovascular disease risk, and more physical disabilities when compared with subjects without SO.Citation3,Citation8,Citation11–Citation16
Considering that SO research is in its infancy and different mathematical thresholds can over- and under-diagnose this clinical condition, our goal was to 1) apply the newly standardized definition for SO used in previous studies and proposed by the Foundation for the National Institutes of Health (FNIH) and illustrate the prevalence of SO in obese elderly women; 2) observe the degree of impairment of muscle strength, lean body mass, and markers of inflammation in those fulfilling such criteria; and 3) elucidate the association between aLM/BMI with obesity indices and strength parameters.Citation6,Citation8,Citation9,Citation11,Citation17
We hypothesized that obese elderly women with SO will have higher pro-inflammatory markers when compared to NSO elderly women. Furthermore, we hypothesized that a higher aLM/BMI will be positively associated with lean body mass and muscle strength and negatively associated with obesity indices.
Table 1 Participant characteristics presented by mean, SD, and 95% CI
Table 2 Correlation coefficient between aLM/BMI and biochemical parameters, muscle strength, and body composition
Materials and methods
Ninety elderly women from a local community were recruited through posters and lectures about the study at the Federal District, Brazil. To be eligible, women needed to be aged ≥60 years with a body fat percentage ≥38% as assessed by dual-energy X-ray absorptiometry (DXA).Citation11,Citation17 Exclusion criteria included history of heart failure, valvular or congenital disease, pacemaker implantation, or osteoarticular disorders. A total of 90 older women were assessed for eligibility and completed a self-report questionnaire that accounted for cardiovascular disease, hypertension, diabetes, osteoporosis, or musculoskeletal conditions that may have precluded participants from safely completing physical function tests assessed in this study. Elderly women were classified as hypertensive and with type 2 diabetes mellitus by the diagnostic criteria used in previous studies.Citation18–Citation20 From the initial applicants, 26 were excluded (did not meet inclusion criteria) and thus a total of 64 women who met the inclusion criteria were selected to participate. The present study was approved by the Institutional Research Ethic Committee of Catholic University of Brasília (UCB) (protocol #035/2011). The study design and employed procedures were in accordance with ethical standards and the Declaration of Helsinki. Each participant was fully informed about the risks associated with study participation and gave their written informed consent.
Muscle strength evaluation
Muscle strength was evaluated by the ten-repetition maximum (10 RM) test according to the protocol used in previous research from our laboratory.Citation21,Citation22 The test-retest reproducibility for the leg extension 10 RM was R=0.99. In addition, the relative muscle strength was calculated by dividing the 10 RM test value by body mass.Citation23 In addition, the leg extension exercise was chosen because lower limb strength has a strong correlation with elderly survival time and dependency.Citation24
Blood samples and biochemical parameters
Lipid profile glycerol phosphate dehydrogenase/p-chlorophenol in presence of peroxidase, urea (Ureasi-glutamate dehydrogenase), and uric acid (uricase/peroxidase method) were measured by the enzymatic colorimetric method using Autohumalyzer equipment (Human GMBH, Wiesbaden, Germany). High-density lipoprotein cholesterol was determined by ionic exchange followed by colorimetric reaction with the Linco Research Inc. kit (St Louis, MO, USA), and blood glucose was measured by the hexokinase enzymatic assay. IL-6 concentration was measured by Quantikine high-sensitivity commercial enzyme-linked immunosorbent assay kit (R&D Systems, Minneapolis, MN, USA). The intraassay coefficient of variation of the kit was 1.5%–5.6% for IL-6. The inter-assay coefficient of variation was 4.3%–6.4% for IL-6. Creatine kinase (CK) concentration was determined by using a commercially available Reflotron CK assay using the Reflotron system (Boehringer Mannheim GmbH, Mannheim, Germany). The measures for CK and IL-6 were performed in triplicate and then averaged.
Body composition
Body composition procedures have been described in detail elsewhere, and percent body fat and appendicular skeletal muscle mass were determined via DXA (General Electric-GE model 8548 BX1L, year 2005, Lunar DPX type, Software Encore 2005; Rommelsdorf, Germany). The coefficient of variation for the percent body fat estimated by DXA was 10.12% and 12.13% for the SO and nonsarcopenic obesity (NSO) groups, respectively. All metal objects were removed from the participants before the scan.Citation25
Sarcopenia and SO
Prevalence of sarcopenia was defined by the aLM adjusted for BMI <0.512.Citation6,Citation8 Obesity was considered as a body fat percentage ≥38%. SO was determined if elderly women fulfilled the criteria for both sarcopenia and obesity using these definitions.Citation4–Citation6,Citation11,Citation17
Statistical analysis
All analyses were conducted with SPSS software version 18.0 (SPSS Inc., Chicago, IL, USA) and the normality was verified by the Shapiro–Wilk test. For the parametric and non-parametric data, an independent Student’s t-test and Mann–Whitney U test were employed, respectively. In addition, the Spearman’s rank correlation coefficient was used to test the association of aLM/BMI with biochemical parameters, muscle strength, and body composition. A chi-squared test for proportions (Fisher’s exact test when cells with expected values were <5 for essential hypertension and type 2diabetes mellitus) was also employed. An alpha level of P≤0.05 was considered significant. In addition, GraphPad Prism 7.0 software was also used (GraphPad Software, Inc., La Jolla, CA, USA). An effect size d of 2.31, a power >80%, alpha error probability of 0.05, allocation ratio of 1.06, and two tails were considered. The post hoc power analysis was used to calculate the sample size necessary to identify differences between two independent groups. Sixty-two elderly (31 vs 31) women were necessary to identify a difference on aLM adjusted for BMI. For the power calculation, the software G*Power 3.1.6 was used (Heinrich-Heine-University Düsseldorf, Düsseldorf, Germany).
Results
The SO group presented a significantly lower absolute muscle strength (35.60±7.88 kg [37.71–38.50 95% CI] vs 40.30±8.38 kg [37.32–43.27 95% CI]) and relative muscle strength (0.51±0.12 kg/kg [0.47–0.56 95% CI] vs 0.60±0.12 kg/kg [0.56–0.65 95% CI]), arm lean body mass (3.76±0.55 kg [3.56–3.97 95% CI] vs 4.02±0.60 kg [3.80–4.23 95% CI]), leg lean body mass (10.90±1.28 kg [10.43–11.37 95% CI] vs 11.76±1.22 kg [11.33–12.20 95% CI]), and aLM (14.67±1.58 kg [14.09–15.25 95% CI] vs 15.79±1.60 kg [15.22–16.36 95% CI]) compared to the NSO group ().
Figure 1 Comparisons between sarcopenic obesity and nonsarcopenic obesity presented by mean and SD.
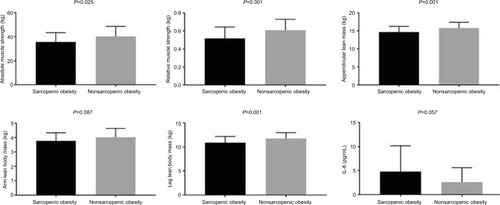
Furthermore, the SO group presented a significantly greater BMI, fat (%), glucose, and a marginal trend toward significance for uric acid, and IL-6 (4.76±5.46 pg/ml [2.76–6.80 95% CI] vs 2.58±3.00 pg/ml [1.51–3.64 95% CI]) compared to the NSO group (; ). In addition, there was a significant positive correlation between aLM/BMI with relative muscle strength, arm lean body mass, leg lean body mass, and aLM. However, there was also a significant negative correlation between aLM/BMI with body fat percentage (). Furthermore, a marginal trend was observed for a negative correlation with glucose.
There was no statistical difference between groups for the presence of hypertension (X2(1) =0.21, P=0.80, Cramer’s V=0.05) and diabetes (X2(1) =0.00, P=1.00, Cramer’s V=0.01).
Discussion
Our results highlight the prevalence of SO in a relatively small sample of obese elderly women using the newly standardized FNIH definition of ALM combined with obesity based on body composition. In addition, our results indicate that elderly women with SO present lower levels of lean body mass and muscle strength, higher glucose, and a trend toward a statistical significance for a higher uric acid and IL-6 serum levels as compared with NSO elderly women. Other important findings include a positive correlation between aLM/BMI with lean body mass and muscle strength, and a negative association with BMI and percentage body fat.
Inflammation associated with SO plays an important role in insulin resistance, glucose tolerance, reduced lean body mass, and lower muscle strength.Citation3,Citation16,Citation26,Citation27 An alternative hypothesis for the higher glucose levels observed in the SO group is that rather than low levels of lean body mass being responsible for glucose intolerance, the condition may instead be primarily a function of the higher accumulation of visceral fat.Citation28
This might be explained by the superior IL-6 serum levels when compared with the NSO group. In addition, chronic IL-6 elevations activate the transcription nuclear factor-kB and JUN N-terminal kinase pathways associated with insulin resistance,Citation27,Citation29 thus promoting a higher level of glucose in the SO group compared with NSO group as verified in this study.
Furthermore, higher IL-6 serum levels are observed in individuals with obesity and poor muscle strength.Citation16 Consistent with this result, we found a trend for greater IL-6 serum levels in the SO group. Moreover, the low muscle strength and lean body mass observed in the SO group might be explained by the activation of molecular pathways as FOXO, Smad 2/3, p38MAPK promoted by IL-6 that causes protein degradation by the ubiquitin ligases and thereby negatively regulates muscle mass and strength in sarcopenic individuals.Citation30 Although no standard for IL-6 serum levels has been established for reference in clinical practice, older women with high IL-6 serum levels (>3.10 pg/mL) have a higher risk of developing physical disabilities (eg, associated with low muscle strength) as observed in the present study for the SO group when compared with the NSO group (4.76 vs 2.58 pg/mL for IL-6, respectively).Citation22,Citation26
On the basis of this finding, SO demonstrated a statistical trend for higher uric acid when compared to NSO group. One possible explanation is that visceral adiposity demonstrates a higher urinary excretion (eg, overproduction-type hyperuricemia).Citation31 In addition, central obesity (aka visceral adiposity) is associated with a proinflammatory condition and insulin resistance.Citation16,Citation32 Central obesity to a greater extent directly affects inflammation, functional impairment, and uric acid serum levels.Citation16,Citation31,Citation33 SO group in our study might have a central obesity characteristic rather than regional obesity when compared with NSO, although not directly verified by DXA. Furthermore, uric acid might also induce insulin resistance, which could partially explain the higher glucose serum levels observed in the SO group.Citation32
SO has been shown to be related to physical limitations, impaired basic activities of daily living, and impaired instrumental activities of daily living.Citation9 The low muscle strength observed in our SO group may increase the likelihood for these maladies and lead to premature mortality.Citation12 Thus, maintaining a higher aLM/BMI is positively associated with lean body mass and muscle strength while negatively associated with a lower BMI and percent body fat. Furthermore, there was a trend toward a negative association with glucose tolerance, which may have beneficial health implications.
Our exploratory analysis provides additional insight into the relationship between SO, inflammation, low muscle strength, glucose intolerance, and uric acid concentrations. However, these important findings are highly dependent on the specific definitions used for sarcopenia and obesity, which may result in over- or under-diagnosis of this clinical condition.Citation6,Citation11,Citation17
Accordingly, our findings would necessarily change when a different method is employed.Citation5,Citation7 Although this represents an important limitation, our results corroborate the relationship between SO and functional disabilities and inflammation where using the aLM/BMI method demonstrated stronger strengths of associations and clinical applicability.Citation8,Citation9 Our findings are also limited by the relatively small sample size that compromises statistical power, how well the sample reflected the true underlying population of obese elderly women, and the cross-sectional design employed precludes the determination of causality.
In addition, we suggest the need of other strength measures to be comparable with other studies of sarcopenia and the need for future research including more details regarding visceral fat such as waist–hip ratio or separation of fat deposits using DXA or other imaging measures.
Conclusion
Our results suggest that SO in elderly women is associated with higher IL-6 serum levels, lower muscle strength, lower lean body mass, higher glucose, and higher uric acid levels. Furthermore, the use of definition criteria from FNIH and obesity might permit the identification of elderly women with SO and allow researchers in clinical geriatric practice to plan possible interventions to reduce the burden of disability downstream.Citation6,Citation11,Citation17
Author contributions
All authors contributed to the study design, data collection, and article preparation; took part in drafting the article or revising it critically for important intellectual content; gave final approval of the version to be published; and agree to be accountable for all aspects of the work.
Acknowledgments
The authors thank the laboratory LAFIT (Daniele Garcia and contributors) of the Catholic University of Brasilia. In addition, the first author wants to dedicate this paper to his family (Rita de Cassia and Nicolas Cunha). The authors also acknowledge the financial support from Coordenação de Aperfeiçoamento de Pessoal de Nível Superior (CAPES), University of Brasilia, Fundação de Amparo a Pesquisa do Distrito Federal - process: 0193.001450/2016 and CNPQ process: 421836/2016-4.
Disclosure
The authors report no conflicts of interest in this work.
References
- CauleyJAAn Overview of Sarcopenic ObesityJ Clin Densitom201518449950526141163
- WatersDLBaumgartnerRNSarcopenia and obesityClin Geriatr Med201127340142121824555
- ZamboniMMazzaliGFantinFRossiAdi FrancescoVSarcopenic obesity: a new category of obesity in the elderlyNutr Metab Cardiovasc Dis200818538839518395429
- LeeDCShookRPDrenowatzCBlairSNPhysical activity and sarcopenic obesity: definition, assessment, prevalence and mechanismFuture Sci OA201623FSO12728031974
- NewmanABKupelianVVisserMSarcopenia: alternative definitions and associations with lower extremity functionJ Am Geriatr Soc200351111602160914687390
- StudenskiSAPetersKWAlleyDEThe FNIH sarcopenia project: rationale, study description, conference recommendations, and final estimatesJ Gerontol A Biol Sci Med Sci201469554755824737557
- DelmonicoMJHarrisTBLeeJSAlternative definitions of sarcopenia, lower extremity performance, and functional impairment with aging in older men and womenJ Am Geriatr Soc200755576977417493199
- BatsisJAMackenzieTAJonesJDLopez-JimenezFBartelsSJSarcopenia, sarcopenic obesity and inflammation: Results from the 1999-2004 National Health and Nutrition Examination SurveyClin Nutr20163561472148327091774
- BatsisJAMackenzieTALopez-JimenezFBartelsSJSarcopenia, sarcopenic obesity, and functional impairments in older adults: National Health and Nutrition Examination Surveys 1999-2004Nutr Res201535121031103926472145
- RoubenoffRSarcopenic obesity: the confluence of two epidemicsObes Res200412688788815229325
- BaumgartnerRNBody composition in healthy agingAnn N Y Acad Sci2000904143744810865787
- BatsisJAMackenzieTABarreLKLopez-JimenezFBartelsSJSarcopenia, sarcopenic obesity and mortality in older adults: results from the National Health and Nutrition Examination Survey IIIEur J Clin Nutr20146891001100724961545
- VillarealDTBanksMSienerCSinacoreDRKleinSPhysical frailty and body composition in obese elderly men and womenObes Res200412691392015229329
- GoodpasterBHCarlsonCLVisserMAttenuation of skeletal muscle and strength in the elderly: The Health ABC StudyJ Appl Physiol20019062157216511356778
- StephenWCJanssenISarcopenic-obesity and cardiovascular disease risk in the elderlyJ Nutr Health Aging200913546046619390754
- SchragerMAMetterEJSimonsickESarcopenic obesity and inflammation in the InCHIANTI studyJ Appl Physiol2007102391992517095641
- BaumgartnerRNKoehlerKMGallagherDEpidemiology of sarcopenia among the elderly in New MexicoAm J Epidemiol199814787557639554417
- Lima-CostaMFPeixotoSVFirmoJOValidade da hipertensão arterial auto-referida e seus determinantes [Validity of self-reported hypertension and its determinants (the Bambuí study)]Rev Saude Publica2004385637642 Portuguese15499433
- AlonsoABeunzaJJDelgado-RodríguezMMartínez-GonzálezMAValidation of self reported diagnosis of hypertension in a cohort of university graduates in SpainBMC Public Health200559416156889
- NishimeEOColeCRBlackstoneEHPashkowFJLauerMSHeart rate recovery and treadmill exercise score as predictors of mortality in patients referred for exercise ECGJAMA2000284111392139810989401
- FunghettoSSPrestesJSilvaAOInterleukin-6 -174G/C gene polymorphism affects muscle damage response to acute eccentric resistance exercise in elderly obese womenExp Gerontol201348111255125923981903
- da Cunha NascimentoDde SousaNMde Sousa NetoIVClassification of pro-inflammatory status for interleukin-6 affects relative muscle strength in obese elderly womenAging Clin Exp Res201527679179725813986
- PrestesJTibanaRAMuscular static strength test performance and health: absolute or relative values?Revista da Associação Médica Brasileira201359430830923850025
- FronteraWRHughesVAFieldingRAFiataroneMAEvansWJRoubenoffRAging of skeletal muscle: a 12-yr longitudinal studyJ Appl Physiol20008841321132610749826
- PrestesJda Cunha NascimentoDTibanaRAUnderstanding the individual responsiveness to resistance training periodizationAge2015373979325971877
- FerrucciLPenninxBWVolpatoSChange in muscle strength explains accelerated decline of physical function in older women with high interleukin-6 serum levelsJ Am Geriatr Soc200250121947195412473005
- TantiJFCeppoFJagerJBerthouFImplication of inflammatory signaling pathways in obesity-induced insulin resistanceFront Endocrinol20123181
- KohrtWMHolloszyJOLoss of skeletal muscle mass with aging: effect on glucose toleranceJ Gerontol A Biol Sci Med Sci199550 Spec No:68–72
- DonathMYShoelsonSEType 2 diabetes as an inflammatory diseaseNat Rev Immunol20111129810721233852
- GumucioJPMendiasCLAtrogin-1, MuRF-1, and sarcopeniaEndocrine2013431122122815045
- TsushimaYNishizawaHTochinoYUric acid secretion from adipose tissue and its increase in obesityJ Biol Chem201328838271382714923913681
- JohnsonRJNakagawaTSanchez-LozadaLGSugar, uric acid, and the etiology of diabetes and obesityDiabetes201362103307331524065788
- BatsisJAGermainCMVásquezEBartelsSJPrevalence of weakness and its relationship with limitations based on the Foundations for the National Institutes for Health project: data from the Health and Retirement StudyEur J Clin Nutr201670101168117327245209