 ?Mathematical formulae have been encoded as MathML and are displayed in this HTML version using MathJax in order to improve their display. Uncheck the box to turn MathJax off. This feature requires Javascript. Click on a formula to zoom.
Abstract
This review discusses the methodology of the standardized on-the-road driving test and standard operation procedures to conduct the test and analyze the data. The on-the-road driving test has proven to be a sensitive and reliable method to examine driving ability after administration of central nervous system (CNS) drugs. The test is performed on a public highway in normal traffic. Subjects are instructed to drive with a steady lateral position and constant speed. Its primary parameter, the standard deviation of lateral position (SDLP), ie, an index of ‘weaving’, is a stable measure of driving performance with high test–retest reliability. SDLP differences from placebo are dose-dependent, and do not depend on the subject’s baseline driving skills (placebo SDLP). It is important that standard operation procedures are applied to conduct the test and analyze the data in order to allow comparisons between studies from different sites.
Introduction
Driving a car is a daily activity for many people, including individuals who are treated with central nervous system (CNS) medication. Impaired driving is an important public health issue, as the driver puts himself and others at risk of injury. Therefore, it is important that the effects of medicines on driving ability are examined in a valid and reliable manner that predicts what happens when individuals actually drive. Currently, the on-the-road driving test is regarded as the “gold standard” to determine whether drugs affect driving ability.Citation1 The on-the-road driving test was developed by O’Hanlon and his colleaguesCitation2–Citation4 and has been applied in psychopharmacological research for 30 years. Although the methodology is highly standardized, guidelines clearly defining the conduct of the test and how the data is interpreted have not been published. This article gives an overview of the methodology of the on-the-road driving test, and the measurement and interpretation of its primary parameter, the standard deviation of lateral position (SDLP). This article summarizes standard operation procedures (SOPs) for conducting the highway driving test, editing and analyzing the data, and calculation and interpretation of SDLP. Recently, various research groups have implemented SDLP as an outcome measure in their driving (simulator) tests. Adopting consistent methodologies is critical to enable comparison of driving data from different research labs using different assays.
The on-the-road driving test
The on-the-road driving test is performed on a public highway in normal traffic. Although the on-the-road test is conducted in the presence of a licensed driving instructor who has access to dual controls, the test conditions reflect actual driving and associated risks. The on-the-road driving test is performed on a 100 km highway segment. Participants are instructed to drive with a steady lane position and constant speed. The primary outcome measure of vehicle control is the standard deviation of lateral position (SDLP), ie, the amount of “weaving” of the car (see ). The secondary outcome measure is the standard deviation of speed (SDS). illustrates that SDLP is a measure of vehicle control. If vehicle control becomes less, SDLP values increase.
Figure 1 The standard deviation of lateral position (SDLP).
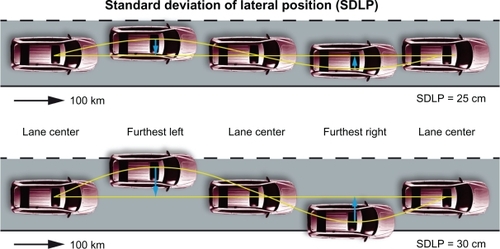
Since SDLP increment may ultimately result in lane crossings into the road shoulder and adjacent traffic lane, SDLP can also be regarded as a potential index of driving safety. Thus, the construct validity of the driving test, ie, measurement of vehicle control, can be regarded as high. Further, the driving test has a much higher content validity (ie, ecological validity) when compared to closed road tests, driving simulators, and psychometric tests. That is, although subjects have to follow certain instructions while driving (eg, maintain a steady lane position and constant speed), and a driving instructor accompanies the participant, the test is the closest representation of normal driving and associated risks.
Up to now, this methodology has been applied in over 50 trials in The Netherlands. Dose-dependent SDLP changes have been reported for various CNS compounds, including alcohol and drugs of abuse,Citation5 hypnotics,Citation6,Citation7 anxiolytics,Citation8 antidepressants,Citation9 and antihistamines.Citation10
Setting and duration of the test
The on-the-road driving test is conducted over a two-lane public highway with normal traffic density and takes about 1 hour to complete. At Utrecht University, the test consists of two 50 km parts and a turning point (eg, Utrecht → Arnhem → Utrecht). The test can be performed at any time of day or night, but generally rush hours are avoided to reduce the likelihood of significant data loss due to maneuvers required in heavy traffic (these maneuvers are edited out when preparing the data for analyses).
The relatively long distance of the test was chosen on purpose to ensure the monotonous character of the test and to incorporate the known finding of a decline in vigilance with time on task. Thus, potential vigilance decrements can be measured. In tests of short duration, by increased effort participants can overcome possible drug-induced impairments and vigilance effects are absent.
Because other traffic is present, participants have to react to other cars, and may experience unexpected events such as traffic jams, emergency stops, etc. This heightens the ecological validity (ie, the feeling of ‘real driving’) of on-road driving relative to driving simulators. For safety, a licensed driving instructor with dual controls accompanies the participant. The presence of the investigator in the back of the car is important as he has knowledge about the (medical) condition of the patient, and is familiar with the potential adverse effects of the drugs that are under investigation. Moreover, the investigator monitors the recording of the data and makes notes about events that happen during the driving test (eg, start and end of overtaking maneuvers). Thus, to ensure data quality, it is preferable that the investigator who accompanied the driving test should edit the data obtained.
Instructions for participants
Although for many people driving is a daily activity, it is necessary to train participants in the procedures of the driving test. Participants should be familiarized with the instrumented vehicle and its equipment, because this may differ from their own car. For example, the test vehicles used in The Netherlands are station wagons, while many people drive regular cars. To this extent, a full 100 km training test drive is made on the same highway track where the research will take place.
The two main instructions for participants are:
Maintain a steady position within the traffic lane during the entire test
Maintain a constant speed (usually 95 km/hour).
Participants are free to choose their preferred position within the traffic lane. Thus, participants should not be directed to drive exactly in the middle of the road, because this may create an unnatural situation if they normally do not drive in that position.
Mean lateral position (MLP) and mean speed (MS) are determined, and the variation in these two outcome measures shows how well subjects were able to conduct the test according to these instructions. A secondary parameter is the standard deviation of speed. This parameter also measures vehicle control, but drug-induced impairment is less clearly observed, and speed variability usually has fewer consequences for traffic safety than weaving of the car (SDLP).
Data recording – the instrumented car
A camera is mounted on the roof of the car to measure the vehicle’s lateral position relative to the painted stripe road delineation (see and ). Two infrared lights enable data collection after sundown or during bad weather conditions. In addition, a filter can be used to prevent reflection of sunlight in case of wet road conditions. Speed is measured from a pulse generator triggered by magnetic induction at a rate proportional to the revolutions of the wheels. Speed and lateral position data is continuously recorded at a rate of 2 Hz.
Figure 2 One of the instrumented cars of Utrecht University.
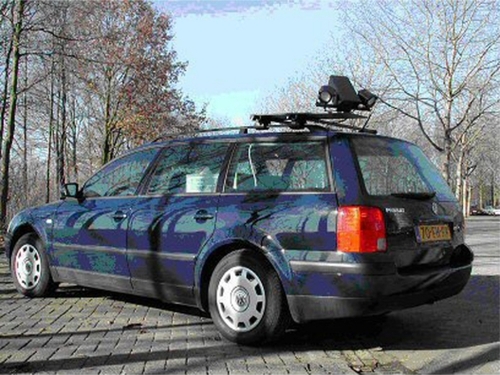
Figure 3 Schematic representation of the on-the-road driving test.
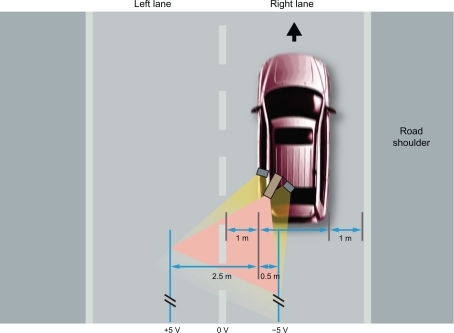
shows that the camera measures the distance from the car relative to the painted striped delineation in the middle of the road. The camera covers about 3 meters. When the car moves towards or into the left traffic lane (for example to overtake another car), at some point the camera can no longer capture the painted striped delineation in the middle of the road. From that moment, the camera switches to the left delineation of the left traffic lane. In the raw data from the test, this typically results in an easy-to-recognize peak in the data, that is also seen when the car returns to the right traffic lane. In the event that the car crosses the left delineation of the left traffic lane by more than 50 cm (a rare event) the signal is lost and no data is collected.
Raw data
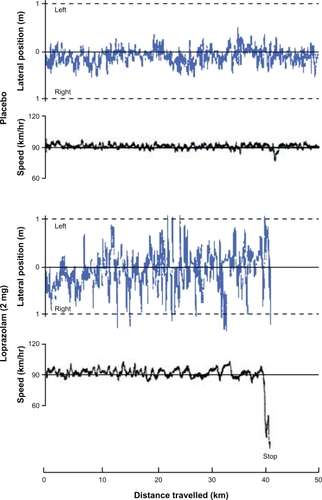
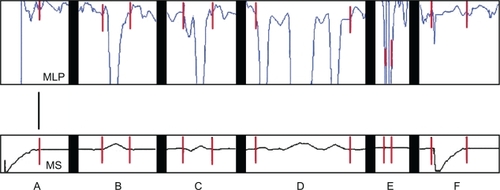
During the driving test, lateral position and speed data is collected at a speed of 2 Hz. shows a typical example of this raw data.Citation11 Data from two driving tests of a participant in a hypnotic study are shown. The top figure shows raw data from a driving test 10 hours after bedtime administration of placebo; the bottom figure shows raw data collected 10 hours after bedtime administration of loprazolam (2 mg). One meter left indicates left wheel excursion into the adjacent traffic lane and one meter right indicates right wheel excursion into the road shoulder. Note, the driving test in the loprazolam condition was stopped after 40 km, because the participant was too sedated to continue driving.Citation11
Figure 4 Examples of lateral position and speed changes over distance traveled. Adapted with permisison from Volkerts ER, de Vries G, Meijer T, et al. Driving performance the day after use of loprazolam, flunitrazepam and placebo. VSC, Report VK 83-04, Traffic Research Centre, Groningen, The Netherlands, 1984.Citation11
Data editing: Standard Operation Procedures
The raw data from the driving test must be edited before SDLP is computed because it contains artifacts. This is always done before the blind is broken. Because the driving test is performed in normal traffic, events may occur where a participant can not obey the two instructions of maintaining a steady lane position and constant speed. For example, passing maneuvers, traffic jams, and the turn-around point should be edited out from the data. Standard operation procedures (SOPs) describe rules on how to edit the data. These are summarized in . To ensure standardization in editing the data, it is important that editors are trained to use the SOPs.
Figure 5 Standard operation procedures to edit the raw data of the driving test. The top figure shows the mean lateral position (MLP) of the car. The bottom figure shows the mean speed (MS) of the car. Standard operation procedures: A) Start of the test: data is deleted until the subject drives 95 km/h in gear number 5. B) An overtaking maneuver: data is deleted from the start of accelerating to overtake, or moving to the left lane, until the car is returned completely back on the right lane and its speed is returned to 95 km/hour. C) Attempt to overtake: data is deleted from the first attempt to overtake. D) Between two overtaking maneuvers: data is deleted when the distance between the two maneuvers is at less than 600 meters. E) Out of the detection range: data is deleted. F) Collisions, off road crashes, other events requiring stopping or slowing speed: data is deleted from the moment of the crash until the car drives 95 km/hour in gear number 5. Cut-off points for editing are indicated by |.
Normal SDLP values
The SDLP is calculated the following way:
Calculate the mean lateral position (MLP) for the entire drive (eg, the 100 km test)
Calculate the standard deviation of the MLP (= SDLP) across all of the samples taken in the 100 km drive.
The equation to calculate a standard deviation is:
When X is the lateral position (determined for each valid data point) with a mean value μ:
(1)
In Equationequation (1)(1) , MLP (mean lateral position) denotes the average of X. The standard deviation of X is the quantity:
(2)
In other words, SDLP is the square root of the variance of X, ie, it is the square root of the average value of (X − μ)2.
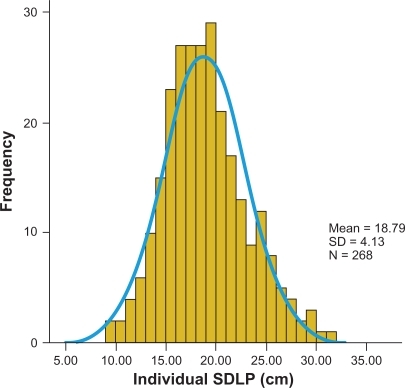
depicts individual SDLP values from n = 268 healthy volunteers who performed a driving test after administration of placebo.Citation2,Citation12–Citation24 Whereas the mean SDLP is 18.79 cm, values range from 9 cm up to 30 cm and higher. Thus, SDLP values differ greatly between individual drivers.
Figure 6 SDLP values obtained after administration of placebo.
Data from references Citation2, Citation12–Citation24.
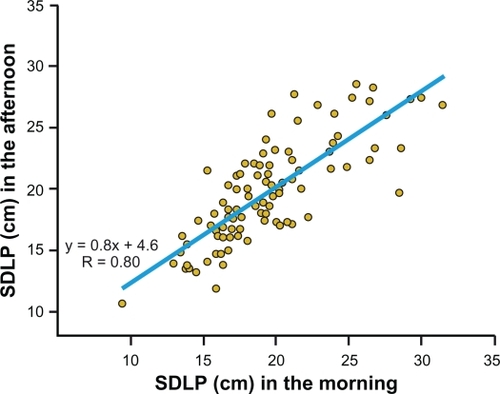
Most studies that tested subjects on different occasions support the idea that SDLP is a very reliable measure. That is, although SDLP varies greatly between subjects, it is a stable measure within subjects across time. This is illustrated by , which shows the relationship between morning and afternoon driving test results in n = 98 healthy volunteers.Citation2,Citation12–Citation18 The participants received placebo at bedtime and performed a driving test 9–10 and 16–17 hours after intake. The mean SDLP of the morning and afternoon driving tests did not differ from each other (19.44 and 19.69 cm, respectively). Importantly, it is evident from that the test–retest reliability is high (r = 0.80).
Figure 7 Test–retest reliability of SDLP measurement.
Data from n = 98 healthy volunteers (data from references Citation2, Citation12–Citation18).
Weather conditions and traffic density
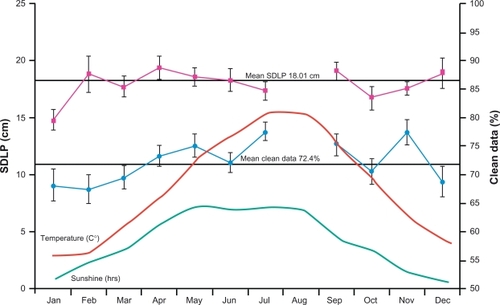
Driving tests are conducted throughout the year, under different weather conditions. Excessive sunshine and reduced visibility due to rain and clouds can interfere with measurements made by the camera. This reduces the percentage of clean data from the driving test that can be used for statistical analysis. There are no rules for a minimum of required clean data points from a given driving test. Under normal weather conditions and traffic density 60%–80% of the data is retained for the statistical analyses and there are no major changes with traffic or inclement weather.
shows that in winter the percentage of clean data is 5% to 10% lower compared to the remainder of the year.Citation21–Citation23,Citation25 It is important to note that SDLP values do not differ significantly during the year.
Figure 8 SDLP values and weather conditions.
Data from 174 driving tests of healthy volunteers who received placebo treatment (Data from references Citation21–Citation23, Citation25).
It has been suggested that differences in traffic density may affect driving performance. Since the aim of a highway test is to measure driving performance in monotonous conditions, increased traffic density may increase participants’ alertness because they have to respond continuously to other traffic. Increased alertness may in turn improve driving performance. Also of concern is the fact that increased numbers of overtaking maneuvers and risk of traffic jams will significantly reduce the clean data that can be used for statistical analyses. To reduce this unwanted effect, driving tests should not be conducted during rush hours. Outside rush hours, the traffic density is fairly constant.
Safety issues and premature stopping of the test
Over the past 30 years of applying the on-the-road driving test, no accidents have occurred. Nevertheless, several drugs visibly impaired driving performance of participants. Thus, the participants are accompanied by a driving instructor who has dual controls to take over before it actually becomes unsafe to continue driving. According to Dutch law, drivers should stop driving if they perceive their driving is dangerous. As long as neither the driver nor other traffic are at risk, the test is continued. Both the participant and the driving instructor can decide to stop the driving test. The latter is important, since participants do not always recognize that their driving is impaired. In that case, only the distance that is actually driven is used for the statistical analyses. Driving tests are stopped for example when participants are very sleepy. SDLP values at that time are often, but not always, high (eg, above 40 cm), and participants may actually drive into the road shoulder and adjacent traffic lane. An example of such a driving test is shown in . After 40 km the driving test was stopped. It is likely that driving performance would have further deteriorated if the test had been continued. Therefore, the SDLP value over the distance that was actually driven should be regarded as the lower cutoff point and an underestimation of the real impairment. For stopped driving tests, SDLP is calculated over the distance that was actually driven. One should not apply a last-observation-carried forward procedure, in which the SDLP value of the last completed 10 km segment is used for the missing segments.
The number of stopped driving tests, if frequent in any condition, may be an indicator of the frequency of impaired driving but is a poor indicator of the magnitude of impairment caused by a drug.Citation3 This is caused by the fact that the decision to stop a driving test or continue driving is a safety assessment made by the participant or the driving instructor. Therefore, in some studies, driving tests have also been stopped when absolute SDLP values were fairly normal, eg, ranging between 20 and 24 cm.Citation26 Hence, SDLP values of driving tests that were completed can be higher than tests that were stopped. This highlights the importance of including data from stopped driving tests in the statistical analysis.
SDLP values over distance traveled: 10 km segments
The standardized 100 km driving test takes about 1 hour to complete. Because the driving test is in part a vigilance test, it is common to see performance decrement over time. The usual method to illustrate the vigilance effect is examining the change in SDLP across the 10 km segments. It is possible to use shorter segments (eg, 5 km), however it can be questioned if this is useful. The shorter the examined segment, the smaller the corresponding SDLP values. This is illustrated in . While the mean SDLP over 100 km is 15.3 cm, the average of the 10 km segments is 13.5 cm, and even lower for 5 km segments (12.1 cm) and 2 km segments (10.6 cm). The reason for lower SDLP values in shorter segments is that the MLP has less opportunity to show large changes if the distance is shorter. In fact, if the length of the segment approaches zero, SDLP does too. Therefore the SDLP measured over short distance of a segment is an underestimation of the overall 100 km SDLP.
Table 1 Data from one driving test, when using different length of segments
The following rules apply for calculating the SDLP of a given segment:
Calculate the mean lateral position (MLP) for the segment of interest
Calculate the standard deviation of the MLP of that segment (= SDLP).
A typical example of a driving performance decrement across the 100 km driving test is shown in , summarizing data from 214 driving tests performed in the placebo condition by healthy volunteers.Citation11,Citation12,Citation17,Citation18,Citation22,Citation23.
Figure 9 SDLP values over distance traveled. The left Figure shows SDLP values calculated for 10 km segments of 214 subjects who drove after receiving placebo (Data from references Citation11, Citation12, Citation17, Citation18, Citation22, Citation23). The right panel shows SDLP values obtained after 1, 4, and 8 hours of continuous driving (Data from reference Citation27).
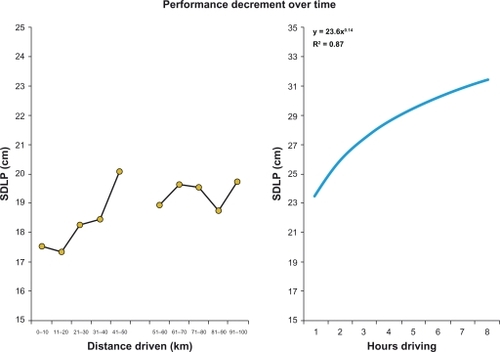
From (left panel), it is evident that SDLP values increase during the test. A temporary reduction in SDLP is seen after the ‘turning point’ (segment 6). Half way (ie, at the turning point), participants leave the highway for about 2–5 minutes to turn around and continue the second part of the test. As this represents an increase in activities and stimulation for the driver a transient improvement of driving is typically seen (ie, a reduced SDLP value in segment 6). A similar progressive performance decrement is seen when driving after administration of sedative drugs, but SDLP values are higher in each segment. The right panel of shows that SDLP continues to deteriorate when the duration of the driving test is further extended.Citation27
It is important to note the overall 100 km SDLP is not the average of the SDLP values of the ten 10 km segments. Because the MLP of individual segments differ from each other, they also differ from the overall 100 km MLP that is used to calculate the SDLP. This is illustrated in .
Figure 10 The impact of mean lateral position changes on SDLP.
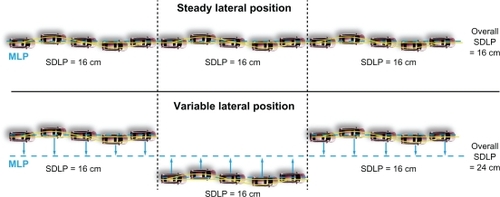
schematically summarizes two test drives. The SDLP computed for each 10 km segment equals 16 cm. In the top figure, the participant maintains a steady lane position within the traffic lane. As a result, the overall SDLP does not differ much from the SDLP measured in the individual segments. The bottom figure shows a participant that was not maintaining a steady lane position. This results in a difference between the SDLP values of the individual segments (16 cm) and the overall SDLP (24 cm). The reason for this difference is the fact that the MLP of the segments is different from the MLP of the entire test. Thus, one may incorrectly conclude that driving performance of the participant is impaired. This underlines the importance of training and instructing participants to maintain a constant lane position throughout the entire driving test.
Subjective assessments
The use of subjective assessments can provide further insight into behavioral changes associated with CNS drugs. Two assessments that are routinely made after the driving test are subjective driving quality and mental effort required to perform the test.Citation28,Citation29 Measurements are conducted with visual analog scales (see ).
Figure 11 Subjective assessments completed after the driving test. Subjects indicate their perceived driving quality (left figure) and perceived effort (right figure) by placing an ‘X’ at the vertical line.
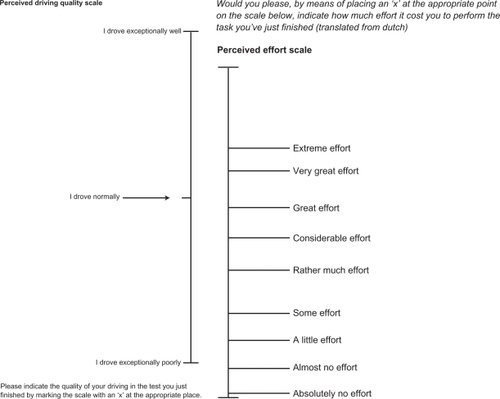
Perceived driving quality is important as this may differ significantly from actual driving performance. That is, participants may not acknowledge or even be aware of the fact that their driving is impaired. This finding has been shown for various psychoactive drugs including alcohol and diphenhydramine.Citation21,Citation22 Clearly when aware of their impairment they can make adjustments or even chose not to drive. However the lack of this awareness exacerbates the potential consequences of the impairment.
Sometimes participants do acknowledge that their driving is impaired, or they experience reduced alertness. In such instances, increased effort to perform the test may (partly) counteract the impairment. For example, no difference from placebo may be found after administration of a drug, but it takes participants much more effort to perform a driving test.Citation24
Subjective assessments on driving quality, mental effort and alertness also provide information on subgroups of participants that do experience adverse effects of a drug, while statistical analyses on a group level do not reveal overall differences from placebo.
Clinical relevance of statistical results
If the analysis reveals a statistically significant difference in SDLP between a drug and placebo, this does not automatically imply that the difference has a meaningful relevance in terms of traffic safety.
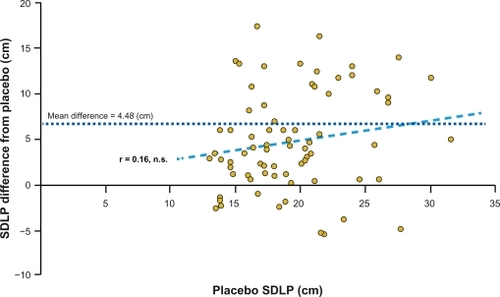
It is important to have a clinical relevant cut-off point of impairment that facilitates the interpretation of results from driving studies measuring SDLP. Historical data is often used to serve as such a comparator. For example, a study by Louwerens et al provided SDLP changes from placebo when driving with different blood alcohol concentrations (BAC).Citation30 These differences, corresponding to common legal limits for driving were +2.4 cm (BAC 0.05%) and +4.3 cm (BAC 0.08%). Many driving studies refer to these changes from placebo to contrast with the magnitude of impairment observed with a given drug. Looking at differences from placebo is justified because SDLP changes (at group level) are very stable and independent of the magnitude of baseline (placebo) SDLP values. This is shown in , which depicts data from 73 driving tests performed after administration of flurazepam (30 mg) and placebo.Citation3,Citation15 Contrary to what is sometimes suggested, it is evident from that SDLP differences from placebo do not significantly differ between ‘good’ and ‘bad’ drivers. In line with earlier findings by O’Hanlon, absolute SDLP values are not reliable predictors of impairment seen after drug administration.Citation3
Figure 12 SDLP differences from placebo (cm) after administration of flurazepam (30 mg). When absolute placebo SDLP values increase, the difference from placebo does not (r = 0.16, n.s.).
Data from reference Citation3, Citation15.
Although the historical data may be used to interpret the magnitude of the SDLP impairment, it is strongly recommended that an active comparator is incorporated into the study design. The positive control (verum) should be a drug that has been previously shown to impair driving ability in terms of significant increment in SDLP. Including a verum is important for three reasons: a) to show the sensitivity of the participant to drug-induced impairment, b) to confirm sensitivity of the driving test in the specific experiment, and c) to calibrate, through the active control, to other studies in the literature. The choice of a verum is arbitrary, and can be alcohol or a CNS drug. However, it is important that a verum is chosen that 1) the research team is familiar with, 2) of which the magnitude of impairment is important, and 3) has been demonstrated before to impair SDLP in an on road driving task. For example, when studying hypnotics zopiclone is often used, and when studying anxiolytics diazepam could be included as the positive control.
Predictive validity of SDLP
It is sometimes argued that SDLP is representative only of a subtask of driving (eg, road tracking ability), or that it is obtaining measurements only at the skill based (operational level) level of driving behavior. While it is correct that the performance measured by SDLP is conducted at an operational/control level and that it comprises road tracking, this does not preclude the concept that SDLP predicts overall vehicle control.
For a valid measure, it is essential that it predicts actual traffic safety, such as the likelihood of becoming involved in a traffic accident. Owens and RamaekersCitation31 conducted comparative analyses of data obtained from on-the-road driving tests as well as epidemiological data on crash risks. SDLP increment after consumption of different dosages of alcoholCitation30 and epidemiological studies relating BAC and accident dataCitation32 showed a very high correlation (r = 0.99) between SDLP increment (relative to placebo) and indirectly, the risk of having a traffic accident.Citation31 Owens and Ramaekers found similar strong relationships for benzodiazepines (r = 0.96) and THC (r = 0.97). Although direct data relating change in SDLP to accidents is currently lacking, these data support the value of SDLP in its relationship to traffic accident risk.
Relationship with blood plasma concentration
Relative to placebo, a dose-related increment in SDLP is generally seen after treatment administration. In addition, significant correlations of SDLP changes from placebo with blood plasma concentrations of drugs have also been found for dose averages of some but not all drugs.Citation3 Driving studies do not typically include blood sampling to examine the relationship between SDLP increment and blood plasma concentration caused by the drugs under investigation. Therefore, it is currently not possible to provide general cut-off points for safe driving, based on the taken dosage and time after intake of a drug. Although the latter would be an important goal,Citation3 this may also put drivers at potential risk, because this information could only be provided at a drug level (ie, a mean drug effect), and not tailored for individual patients. Because of differences in drug metabolism in patients and the development of tolerance after repeated dosing, it is unlikely that this information can be determined on the individual patient level.
Issues in study design
The large individual differences in SDLP values make it hard to directly compare individuals on their absolute SDLP values. Therefore, between-subject designs, for example comparing 2 groups, are an inefficient way to determine the effect of drugs on driving, as very large groups of subjects are needed for statistical significance. Matching subjects on SDLP before randomization may reduce variability, but even in the healthy volunteer studies that included very similar subjects with regards to driving history, SDLP was shown to differ considerably between subjects.
For driving research using SDLP as outcome measure, a within-subject crossover design is more efficient and sensitive. SDLP is stable over time. Cross over designs allow the comparison of differences between a drug and a placebo, within subjects. Using this design, very comparable results were obtained in different studies using the same methodology and design. This was shown for example in driving studies testing the residual effects of zopiclone.Citation33–Citation35
Dosage and time of testing
To understand the effects of a drug it is necessary to include more than one dosage of the drug under investigation. Preferably, studies include both the clinical dose and twice that dose. Any drug, regardless of half-life, can produce impairment of SDLP if the dose is high enough, or fail to produce impairment if the dose is low enough. Therefore, study designs including multiple dosing are preferred. For some drugs, dosages are determined on an individual basis. An example of individualized dosing can be found in patients with attention deficit hyperactivity disorder (ADHD). In such instances patients are preferably tested after receiving their individual tailored dosage,Citation36 which then can be compared to a placebo and verum treatment. For other medications, dosages are titrated after an initial low starting dose. This happens for example with the use of selective serotonin reuptake inhibitors (SSRIs). Ideally, both the doses at the beginning of titration and the end of titration should be studied.
To test acute effects of drugs on driving, tests are generally scheduled at CMAX, ie, the time after administration when peak blood plasma concentration of the drug under investigation is reached. Sub-chronic effects can be tested after days or weeks, and patients should be retested especially after changing dosages.
If next-day or other delayed drug effects are expected one should not test driving ability solely at CMAX. For some drugs such as hypnotics it is essential to examine potential hangover effects on driving performance. Most study designs administer sleep medication at bedtime and test driving performance the following morning, 9–10 hours after treatment administration. With long-acting hypnotics, additional tests in the afternoon, 16–17 hours after intake, are warranted.
Subject considerations
If one aims to demonstrate adverse effects on driving caused by a drug, the greatest sensitivity appears to be from a sample of healthy adult volunteers. To enhance generalizability both sexes should be studied. Participants should have sufficient driving experience to minimize learning effects during the study. Generally, a lower limit of 5 years of driving experience, and driving at least 5000 km per year is recommended to reach this goal. The results obtained with the healthy volunteer study can be the basis of further investigation of driving performance comparing specific groups such as elderly versus young/adult drivers, novice versus experienced drivers, or professional versus regular drivers. After healthy volunteer data is obtained, a second subject sample should reflect the target population that will use the drugs under investigation clinically. A disadvantage of including these patients is that there are many confounding variables that make interpretation of the study results difficult. For example, if depressed patients are included to test the effects of a new antidepressant on driving ability, improved driving may be seen as a result of therapeutic efficacy of the drug. At the same time, adverse effects of the medication may impair driving. These two effects then cancel each other out and make the study results hard to interpret. There are a number of potential subject/drug interactions which require collecting data in healthy volunteers to understand the direct drug effect. Therefore, testing only in patients is not recommended. After obtaining data from healthy volunteers, data obtained from patients is easier to interpret.
Concluding remarks
The standardized on-the-road driving test has proven to be a sensitive and reliable method to examine driving ability after administration of CNS drugs. Its primary parameter, SDLP, is a stable measure of driving performance with high test–retest reliability. SDLP differences from placebo are dose-dependent, and do not depend on the subject’s baseline driving skills (placebo SDLP).
Strengths and weaknesses of the on-the-road driving test are summarized in .
Table 2 Summary of generally observed differences and similarities between the on-the-road driving test, driving simulators, and psychometric tests
Future innovations of on-road testing include measuring driving ability (including SDLP) in the driver’s own car over long periods of time. Pilot studies applying this naturalistic way of data collection are currently in progress.Citation37
It is important that standard operation procedures are applied to conduct the test and analyze the data in order to allow comparisons between studies from different sites. Applying different data editing procedures, or shortening the test, has an impact on the study outcome (SDLP). We therefore advocate that researchers who use SDLP as a measure (either in a driving simulator or on-road) adopt the strategies discussed in this paper to conduct the test and edit the data.
Disclosure
The authors have no conflicts of interest to disclose.
References
- VermeerenAde GierJJO’HanlonJF1993Methodological guidelines for experimental drugs affecting driving performance: an international expert surveyMaastrichtInstitute for Human Psychopharmacology, University of Limburg, The Netherlands
- O’HanlonJFHaakTWBlaauwGJRiemersmaJBDiazepam impairs lateral position control in highway drivingScience1982217455479817089544
- O’HanlonJFDriving under the influence of drugs: rationale for, and application of, a new testBr J Clin Pharmacol198418Suppl 1121S129S6525328
- O’HanlonJFAre actual driving tests necessary for evaluating drug safety?Int Clin Psychopharmacol19883Suppl 181853403953
- PenningRVeldstraJDaamenAPOlivierBVersterJCDrugs of abuse, driving and traffic safetyCurr Drug Abuse Rev201031233220088818
- VersterJCVeldhuijzenDSVolkertsERResidual effects of sleep medication on driving abilitySleep Med Rev20048430932515233958
- VersterJCVeldhuijzenDSPatatAOlivierBVolkertsERHypnotics and driving safety: meta-analyses of randomized controlled trials applying the on-the-road driving testCurr Drug Saf20061637218690916
- VersterJCVeldhuijzenDSVolkertsERIs it safe to drive a car when treated with anxiolytics? Evidence from on-the-road driving studies during normal trafficCurr Psychiatry Rev20051215225
- RamaekersJAntidepressants and driver impairment: Empirical evidence from a standard on-the-road testJ Clin Psychiatry2003641202912590619
- VersterJCVolkertsERAntihistamines and driving ability: Evidence from on-the-road driving studies during normal trafficAnn Allergy Asthma Immunol200492329430315049392
- VolkertsERde VriesGMeijerTDriving performance the day after use of loprazolam, flunitrazepam and placebo VSC, Report VK 83-04,Traffic Research CentreGroningen, The Netherlands1984
- O’HanlonJFVolkertsERHypnotics and actual driving abilityActa Psychiatr Scand Suppl1986332951043554901
- VolkertsERLouwerensJWGloerichABMZopiclone’s residual effect upon actual driving performance versus those of nitrazepamand flunitrazepam VSC, VK 84-10,Traffic Research CentreGroningen, The Netherlands1984
- O’HanlonJFVolkertsERBrookhuisKARepeated dose effects of nitrazepam and temazepam upon actual driving performanceTraffic Research Centre, University of UtrechtThe Netherlands VK 85-02,1985
- BrookhuisKAVolkertsERO’HanlonJFRepeated dose effects of lormetazepam and flurazepam upon driving performanceEur J Clin Pharmacol199039183871980464
- BrookhuisKAVolkertsERO’HanlonJFRepeated dose effects of lormetazepam 1 and 2 mg (in soft gelatine capsules) and flurazepam 30 mg upon driving performanceTraffic Research Centre, University of GroningenThe Netherlands VK 86-18,1986
- VolkertsERvan LaarMWvan WilligenburgAPPPlompTAMaesRAAA comparative study of on-the-road and simulated driving performance after nocturnal treatment with lormetazepam 1 mg and oxazepam 50 mgHum Psychopharmacol199275297309
- VolkertsERAbbinkFvan LaarMWPlompTAA double-blind study to compare the acute residual effects of lormetazepam 1 mg, oxazepam 50 mg and placebo on driving performance in an over-the-road driving testNIDDR, University of UtrechtThe Netherlands1989
- Van LaarMWVolkertsERVerbatenMNSubchronic effects of the GABA-agonist lorazepam and the 5-HT2a/2c antagonist ritanserin on driving performance, slow wave sleep and daytime sleepiness in healthy volunteersPsychopharmacology (Berl)2001154218919711314681
- VolkertsERvan WilligenburgAPvan LaarMWMaesRADoes cetirizine belong to the new generation of antihistamines? An investigation into its acute and subchronic effects on highway driving, psychometric test performance and daytime sleepinessHum Psychopharmacol199274227238
- VersterJCDe WeertAMBijtjesSIRDriving ability after acute and subchronic administration of levocetirizine and diphenhydramine: a randomized, double blind, placebo-controlled trialPsychopharmacology (Berl)20031691849012721777
- VersterJCVolkertsERSchreuderAHResidual effects of middle-of-the-night administration of zaleplon and zolpidem on driving ability, memory functions and psychomotor performanceJ Clin Psychopharmacol200222657658312454557
- VersterJCVolkertsERVerbatenMNEffects of alprazolam on driving ability, memory functioning and psychomotor performance: a randomized, placebo-controlled studyNeuropsychopharmacology200227226026912093599
- VersterJCVeldhuijzenDSVolkertsEREffects of an opioid (oxycodone/paracetamol) and an NSAID (bromfenac) on driving ability, memory functioning, psychomotor performance, pupil size and moodClin J Pain2006225549950416772806
- MetsMAJde VriesJSenerpont DomisLMOlivierBVolkertsERVersterJCNext-day effects of ramelteon (8 mg), zopiclone (7.5 mg) and placebo on highway driving performance, memory functioning, psychomotor performance and mood in healthy adult subjectsIn press2011
- TheunissenELVermeerenARamaekersJGRepeated-dose effects of mequitzine, cetirizine and dexchlorpheniramine on driving and psychomotor performanceBr J Clin Pharmacol2005611798616390354
- VersterJCTaillardJSagaspePOlivierBPhilipPProlonged nocturnal driving can be as dangerous as severe alcohol-impaired drivingJ Sleep Res201110.1111/j.1365-2869.2010.00901 [Epub ahead of print].
- ZijlstraFRHvan DoornLThe construction of a scale to measure perceived effortReport Delft University of TechnologyDelft, The Netherlands1985
- MeijmanTFZijlstraFRHKompierMAJMuldersHPGBroerseJPJThe measurement of perceived effort. ReportUniversity of Groningen, Department of Occupational Psychology, Biological CenterHaren, The Netherlands1986
- LouwerensJWGloerichABMDe VriesGBrookhuisKAO’HanlonJFThe relationship between drivers’ blood alcohol concentration (BAC) and actual driving performance during high speed travelNoordzijPCRoszbachRAlcohol, Drugs and Traffic SafetyAmsterdamExcerpta Medica1987183192
- OwensKRamaekersJGDrugs, driving, and models to measure driving impairmentVersterJCPandi-PerumalSRRamaekersJGde GierJJDrugs, driving and traffic safetyBasel, SwitzerlandBirkhauser Verlag AG20094358
- BorkensteinRFCrowtherRPShumateRPZielHBZylmanRThe role of the drinking driver in traffic accidents1964Dept. of Police Administration, Indiana UniversityBloomington, Indiana
- VermeerenADanjouPEO’HanlonJFResidual effects of evening and middle-of-the-night administration of zaleplon 10 and 20 mg onmemory and actual driving performanceHum Psychopharmacol Clin Exp199813S98S107
- VermeerenARiedelWJvan BoxtelMPJDarwishMPatyIPatatADifferential residual effects of zaleplon and zopiclone on actual driving: a comparison with a low dose of ethanolSleep200225222423111905433
- LeufkensTRLundJSVermeerenAHighway driving performance and cognitive functioning the morning after bedtime and middle-of-the-night use of gaboxadol, zopiclone, and zolpidemJ Sleep Res200918438739619552733
- VersterJCBekkerEMDe RoosMMethylphenidate significantly improves driving ability of adults with attention-deficit hyperactivity disorder: a randomized crossover trialJ Psychopharmacol200822323023718308788
- WinkelbauerMEichhornASagbergFBacker-GrøndahlANaturalistic driving: a new form of data collectionData and Mobility201081163176