Abstract
Objectives
To evaluate (1) whether or not the addition of computer-assisted diagnosis (CAD) to 64-slice multidetector computed tomography (CT) can be used as a screening tool for detection of pulmonary nodules in routine CT chest examinations and (2) whether or not to advocate the incorporation of CAD as a screening tool into our daily practice.
Materials and methods
A retrospective cross-sectional analysis of 109 consecutive patients who had all undergone routine contrast-enhanced CT chest examinations for indications other than lung cancer at the Radiology Department of Aga Khan University Hospital, Karachi, between November 2010 and January 2011. All examinations were evaluated in terms of the detection of pulmonary nodules by a consultant radiologist and CAD (ImageChecker CT Algorithm R2 Technology) software. The ability of CAD software to detect pulmonary nodules was evaluated against the reference standard. In addition, a chest radiologist also calculated the number of pulmonary nodules. The sensitivity and specificity of the CAD software were calculated against the reference standard by using a 2 × 2 table. The Mann–Whitney U test was applied to compare the performances of CAD and the radiologist.
Results
CAD detected 610 pulmonary nodules while the radiologist detected only 113. The reference standard declared 198 pulmonary nodules to be true nodules. CAD detected 95% of all true nodules (189/198), whereas the radiologist detected only 57% (113/198). In the detection of true pulmonary nodules, CAD had 98% sensitivity compared with the radiologist who had 57% sensitivity; the statistical difference between their performances had a P value <0.001.
Conclusion
Considering the high sensitivity of CAD to detect nearly all true pulmonary nodules, we advocate its application as a screening tool in all CT chest examinations for the early detection of pulmonary nodules and lung carcinoma.
Introduction
Lung carcinomas are one of leading causes of death worldwide. It has been estimated that over 1 million people die every year from secondary lung cancer.Citation1 The mean 5-year survival rate of lung cancer is 15% but with early detection and treatment the overall survival rate can be improved from 15% up to 70%.Citation2–Citation4 Unfortunately, only 15% of lung cancers are detected at this early stage and that figure has remained unchanged over the last three decades.Citation5 Missed lung cancer is a serious challenge for both radiologists and pulmonologists. Chest X-rays are the initial method of investigation but computed tomography is more sensitive than projectional radiography in the detection of small pulmonary nodules.Citation6
With the advent of multidetector computed tomography (MDCT), especially 64-slice, it has become possible to acquire several thin slices in a single breath hold and allow image reconstruction in axial, coronal, and sagittal planesCitation7 without affecting spatial resolution. This not only produces a large amount of imaging data but also increases the burden on already overworked radiologists.
Recently developed computer-assisted diagnosis (CAD) has gained worldwide acceptance, not only because of its ability to handle increasing amounts of data but also due to its detection of pulmonary nodules and filling defects for pulmonary embolism, and its capacity to estimate interstitial pulmonary diseases.Citation8
Since no lung cancer screening programs are available in our part of the world, the use of CAD may help in diagnosing lung cancer at an earlier stage. No study has been done in our region to look at the applicability of CAD for use as a screening tool in the detection of pulmonary nodules. Therefore, the purpose of our study was to evaluate whether the addition of CAD of pulmonary nodules in routine 64-slice MDCT of the lung has any role in patient management and, on the basis of its results, whether or not to advocate for the incorporation of CAD as a screening tool into our daily practice.
Materials and methods
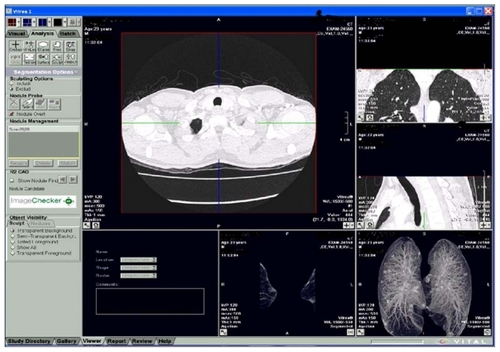
One hundred and nineteen consecutive patients of both genders coming to the Radiology Department of Aga Khan University Hospital, Karachi for the routine chest CT scan with all indications between November 2010 and January 2011 were retrospectively selected. Ten patients were excluded from the study because of lung collapse involving more than one lobe, pneumonectomy, significant lung fibrosis, or breathing artifacts interfering with the interpretation of scan. Finally, 109 exams were included in the study. All patients underwent contrast-enhanced chest CT scans using a Toshiba Aquilion 64 slice CT scanner, following routine departmental protocols which include 120 kVp, 200 mAs, pitch standard, 0.5 second gantry rotation time. One hundred milliliters of intravenous contrast iohexol, 350 mg/mL iodine (Omnipaque, GE Healthcare, Waukesha, WI) were given through computer-controlled mechanical power injector at a rate of 3 mL/second. There was a delay of 60 seconds before initiation of the scan. Volume data were acquired from a section thickness of 0.5 × 64 mm that was subsequently reconstructed to 1 mm and 5 mm axial, coronal, and sagittal sections. A series of 1 mm axial images were sent to the CAD software based on automatic detection of pulmonary nodules and all images were sent to the PACS (picture archiving and communication system) workstation for identification of pulmonary nodules by a consultant radiologist with more than 5 years’ experience in chest CT reporting. The pulmonary nodules calculated by the radiologist (RAD) were labeled as the RAD group and the pulmonary nodules calculated by computer-based software were labeled as the CAD group. Our CAD software is ImageChecker CT server algorithm (R2 Technology, Bedford, MA; see ) which is designed to detect lung nodules by identifying the solid parenchymal focal densities in the lung tissue 4 mm in diameter or larger and pleural-based nodules 4 mm or larger, provided they project significantly into the lung and are approximately spherical in shape, have boundaries that are smooth, lobulated, or speculated, and are surrounded by lung parenchyma.Citation9,Citation10
Figure 1 CAD software. In the left-hand corner are various operational tools while in the center, the main window shows the lung under study. In the right-hand corner multiplanar views of the lung can be seen.
Pulmonary nodules (<15 mm) identified by CAD software were recorded on Performa, labeled as the CAD group. Two senior radiologists with 10 years’ experience in CT chest reporting in conjunction with a final-year radiology resident, all of whom were trained to work on CAD software, reviewed all CT examinations for the determination of true nodules and their findings were taken as the reference standard. The nodule were considered to be: (1) true positive when an opacity in the lung was declared to be a nodule by CAD/RAD and also confirmed by the reference standard; false positive when an opacity in the lung was declared to be a nodule by CAD/RAD but was not confirmed by the reference standard; (3) false negative when an opacity in the lung was not declared to be a nodule by CAD/RAD but was declared to be a nodule by the reference standard; and (4) true negative when an opacity in the lung was declared not to be a nodule by both CAD/RAD and also by the reference standard.
Statistical analysis was performed using SPSS Windows package (v 16; SPSS Inc, Chicago, IL). Descriptive analysis was conducted, ie, frequencies and percentages for categorical variables such as sex, presence and absence of pulmonary nodules, and mean and standard deviation for continuous variables such as age. Considering the distribution of data, the Mann–Whitney U test was used to compare the medians of CAD and RAD against the reference standard. The sensitivity of the CAD and RAD groups was calculated against the reference standard.
Results
There were 58% males with a mean age of 36.7 years (range 19–63 years) and 42% females with a mean age of 44.4 years (range 22–84 years). The overall mean age was 39.9 years (range 19–84). Five percent of the females and 80% of the males had a positive history of smoking. CAD detected 610 nodules in 87 patients (seven nodules per patient), excluding 22 examinations as negative for the presence of nodules, whereas the RAD detected 113 nodules in 37 patients, with an average of three nodules per patient, and the rest of the 72 examinations were declared negative for the presence of pulmonary nodules. The reference standard calculated a total of 198 nodules in 62 patients (average 3.2) and the remaining 47 patients’ scans were declared negative. The maximum size of the nodules was 15 mm with an average size of 5.8 mm (range 4–15 mm). Of all CAD-detected nodules 31% (192/610) were true nodules and 68% (418/610) were false positive, contributing to the significant overcall rate. CAD picked up 95% (189/198) of all true nodules; however, about 1.4% (9/198) of true nodules were missed. In the detection of pulmonary nodules, CAD has a very high sensitivity of 98%. On the other hand, all nodules detected by the RAD were true nodules but he missed 85 true nodules (43%, 85/198), contributing to the RAD false-negative rate. There were no false-positive nodules for RAD. In the detection of pulmonary nodules, the RAD has a poor sensitivity of 57% (see ). When we applied the Mann–Whitney U test to the findings of both groups (CAD and RAD), we found a statistically significant difference (P < 0.001).
Table 1 Detection performance of true pulmonary nodules
Discussion
Missed lung cancers remain a challenge for both radiologists and clinicians. The pulmonary nodules less than 15 mm in diameter are the potential nodules which are missed and have been reported as having a high probability of being stage 1 lung cancer.Citation4 Unfortunately, the majority of patients are unable to seek medical attention because of lack of awareness, and no screening programs are available in underdeveloped countries. In one of the screening studies conducted by Kaneko et al, 32% of lung cancers were initially missed but subsequently diagnosed on follow-up imaging.Citation11
In a study conducted by Swenson et al, radiologists missed pulmonary nodules in about 26% of patients.Citation12 In our study, the radiologist missed nodules in about 35% (25/72) of patients and the RAD sensitivity in picking up nodules was only 57%. This may be due to the large number of images produced by MDCT which not only increases the workload of the radiologist but can also lead to oversight errors and paradoxical cases.Citation13 This requires double reading, which can effectively be provided by CAD using artificial intelligence and vision.Citation14
Wide variation exists in the literature regarding the efficiency of CAD but none of the studies evaluated CAD as a screening modality; most have applied the CAD software in screening CT lung examinations which are not being routinely done in our part of world. We assessed the applicability of commercially available CAD as a screening tool in routine CT chest examinations with a normal radiation dose which were performed for indications other than the lung cancer screening. The main indications were dyspnea, trauma, infections, chronic obstructive pulmonary disease, interstitial lung diseases, and metastatic workup.
In our study, CAD performed much better than the RAD and picked up 95% (189/198) of true nodules; however, about 1.4% (9/198) of the true nodules were missed. In a series conducted by Yuan et al, nearly one-quarter of the nodules were not picked up by CADCitation15 but in our study CAD missed very few.
CAD has a significant overcall rate, contributing to its number of false positives – the problem which has been identified in almost all studies conducted so far on this particular topic of the computer-aided detection of pulmonary nodules. In our study, CAD falsely marked nodules in 34% of the patients, which were declared negative by the reference standard. The reasons for the CAD false positives in our study were end-on vessels 44% (184/418), round/oval areas of atelectasis 27% (113/418), scars 13% (56/418), and osteophytes projecting into the lung surface 16% (65/418).
On the other hand, all nodules detected by RAD were true nodules but they missed a significant number of true nodules (85/198). The RAD false-negative rate can pose a significant risk of morbidity and mortality in terms of missed lung cancer and is unacceptable in this era of sophisticated technology. This significant false-negative rate may be due not only to overwork but also to oversight errors caused by distraction, hurry due to time limits, and the subtlety of the lesions. CAD is immune from these errors and picks up the nodules missed by radiologists.
Regarding the sensitivity of CAD in the detection of pulmonary nodules, there is wide variation in the literature. In a study conducted by Yuan et al,Citation15 CAD has 73% sensitivity and in a study by Goo et al,Citation16 65% sensitivity. In our study, the sensitivity of CAD in picking up pulmonary nodules was 98% which is the highest to date in the reported literature in patients with normal-dose CT chest examinations. The sensitivity of CAD was 94% in a study by Fraioli et alCitation17 but they used low-dose protocols with a small number (20) of patients. The CAD false-positive is different from that of the radiologist and can easily be eliminated with the expertise of the radiologist and is unlikely to increase the number of unnecessary biopsies. It may, however, increase patient costs in terms of follow-up because any suspicious nodule has to be in surveillance: a nodule that remains stable for up to a period of 2 years is considered to be benign.Citation18 The false-negative rate of CAD in our study is significantly less than the false-negative rate published in the literature, which may be due to differences in CAD software, difference in image thickness, and variability in reference standards. There is strong evidence in the literature that CAD picks up not only additional nodules but also those nodules which were initially missed by radiologists and diagnosed later on in follow-up studies.Citation8,Citation19,Citation20 Therefore, considering the high sensitivity and ability of CAD to detect nearly all nodules, it may be applied to all CT chest examinations for the purpose of screening pulmonary nodules. It is cost effective and safe, but also noninvasive and requires minimal expertise to operate. The results can be reproduced and will not entail an additional radiation dose to the patient because CAD will be applied to already-performed CT chest examinations.
There were several limitations to our study. It was a retrospective study of a sample with a wide variety of indications. In addition, partly necrotic nodules were not evaluated in this study. The higher false-negative rate of the RAD in comparison to CAD can partially be attributed to time constraints, slice thickness, and workload, as calculating each and every nodule is time consuming. Studies have shown that thin-slice images detect more nodules than thicker sections;Citation20–Citation22 however, the radiologist also had additional coronal and sagittal sets of images which are very helpful in assessing the suspicious lesion in all three dimensions. Nevertheless, a study conducted by Aberle et alCitation22 has shown significantly reduced lung-cancer mortality with low-dose CT screening. In our study, no additional radiation dose was given to the patient because we added CAD to the already-performed chest CT scan for other clinical indications such as trauma, infection, malignancy, and metastatic workup. The purpose of our study was to evaluate whether we can use CAD as a screening tool by comparing its performance against the reference standard and the reporting radiologist. The majority of our patients had a positive history of smoking and we do not know what percentage of detected nodules will become neoplastic and what percentage are benign. For these patients, follow-up is crucial to keep a close eye on the character of the nodule so that if any become malignant, they can be dealt with in a prompt and timely manner.
The results of our study have shown the additional benefits of CAD in the detection of pulmonary nodules so we advocate the additional application of CAD to every chest CT examination as a screening tool for timely identification of pulmonary nodules.
Acknowledgments
We would like to thank Dr Talat Waseem MD, Registrar at Ittefaq Hospital, Lahore and Mr Muhammad Islam, Department of Community Health Services, Aga Khan Hospital for statistical analysis. We would also like to thank Mr Zafar Jamil, senior technologist CT Section, Radiology Department, Aga Khan Hospital for his technical support.
Disclosure
There are no conflicts of interest. All authors contributed equally to the work. No funding was received for this study.
References
- ArmatoSGGigerMLMacMahonHSoneSDoiKLung cancer: performance of automated lung nodule detection applied to cancers missed in a CT screening programRadiology200222568569212461246
- American Lung AssociationLung Cancer Fact Sheet http://www.lungusa.org/lung-disease/lung-cancer/resources/facts-figures/lung-cancer-fact-sheet.htmlAccessed October 30, 2011
- FlehingerBJKimmelMMelamedMRThe effect of surgical treatment on survival from early lung cancer. Implications for screeningChest1992101101310181313349
- MartiniNBainsMSBurtMEIncidence of local recurrence and second primary tumours in resected stage 1 lung cancerJ Thorac Cardiovasc Surg19951091201297815787
- RiesLSEER Cancer statistics review, 1973–1996National Cancer InstitutionBethesda http://seer.cancer.gov/csr/1973_1996/overview.pdfAccessed October 30, 2011
- HenschkeCIMcCauleyDIYankelovitzDFEarly lung cancer action project: overall design and findings from base line screeningLancet19993549910510408484
- ParrishFJVolume CT: state-of-the-art-reportingAJR Am J Roentgenol200718952853417715096
- MartenKSeyfarthTAuerFComputer-assisted detection of pulmonary nodules: performance evaluation of an expert knowledge-based detection system in consensus reading with experienced and inexperienced chest radiologistsEur Radiol20041419301938 [Epub ahead of print.]15235812
- Server Algorithm R2 TechnologyThe ImageChecker CT Lung System User ManualPN 132278 Rev A Hologic Inc35 Crosby Drive, Bedford, MA 01730-01401
- Understanding the ImageChecker CT Lung SystemPN 13229 Rev A Hologic Inc35 Crosby Drive, Bedford, MA 01730-01401
- KanekoMEguchiKOhmatsuHPeripheral lung cancer: screening and detection with low-dose spiral CT versus radiographyRadiology19962017988028939234
- SwensonSJJettJRSloanJAScreening of lung cancer with low dose spiral computed tomographyAm J Respir Crit Care Med200216550851311850344
- KakinumaROhmatsuHKanekoMDetection failures in spiral CT screening for lung cancer: analysis of CT findingsRadiology1999212616610405721
- DoiKMacMahonHKatsuragawaSNishikawaRMJiangYComputer-aided diagnosis in radiology: potential and pitfallsEur J Radiol1999319710910565509
- YuanRVosPMCooperbergPLComputer aided detection in screening CT for pulmonary nodulesAJR Am J Roentgenol20061861280716632719
- GooJMLeeJWLeeHJKimSKimJHIMJGAutomated lung nodule detection at low dose CT: preliminary experienceKorean J Radiol2003421121614726637
- FraioliFCatalanoCAlmbergerMEvaluation of effectiveness of a computer system (CAD) in the identification of lung nodules with low-dose MSCT: scanning techniques and preliminary resultsRadiol Med2005109404815729185
- JenningsGSWiner-MuramHTTarverRDFarberMOLung tumour growth: assessment with CT – comparison of diameter and cross-sectional area with volume measurementsRadiology200423186687115163822
- PeldschusKHerzogPWoodSACheemaJLCostelloPSchoepfUKComputer aided diagnosis as a second reader: spectrum of findings in CT studies of the chest interpreted as normalChest20051281517152316162752
- ParanjpeDVBerginCJSpiral CT of lungs: optimal technique and resolution compared with conventional CTAJR Am J Roentgenol19941625615678109496
- FischbachFKnollmannFGriesshaberVFreundTAkkolEFelixRDetection of pulmonary nodules by multislice computed tomography: improved detection rate with reduced slice thicknessEur Radiol20031323782383 [Epub ahead of print.]12743736
- AberleDRAdamsAMBergCDNational Lung Screening Trial Research TeamReduced lung-cancer mortality with low-dose computed tomographic screeningN Engl J Med2011365539540921714641