Abstract
Introduction
Both occupational and environmental exposures to lead remain a serious problem in many developing and industrializing countries. When humans are exposed to high levels of lead, there is damage to almost all organs and organ systems (most importantly, the central nervous system, kidneys, and blood), which often culminates in death.
Objective
To estimate the prevalence of blood lead levels (BLLs) and to identify the sources of environmental exposure and potential risk factors for elevated BLLs among Saudi schoolchildren.
Methods
A cross-sectional survey was conducted from March to May 2010. The study population included 557 Saudi school students of both sexes. A multistage random sampling technique was used. Information about socioeconomic status, house and school construction, and parents’ education and employment was collected using questionnaires. Lead was analyzed in a blood sample using an atomic absorption technique and hemoglobin was measured using a Sysmex hematological analyzer.
Results
The mean BLL was 4.94 ± 3.38 μg/dL (range 0.45–26.3 μg/dL). A total of 19% had BLLs <1.0 μg/dL, 16% had BLLs <2.5 μg/dL, 15% had BLLs <5.0 μg/dL, 20% had BLLs <7.5 μg/dL, 25% had BLLs <10.0 μg/dL, and about 6% had BLLs >10.0 μg/dL. Analysis of odds by controlling all risk factors (adjusted odds ratio [OR]) that affect BLLs (≥10 μg/dL) indicated that using cosmetics (OR = 18.5, confidence interval [CI] = 14.4–19.8), putting colored toys in mouth (OR = 15.7, CI = 3.6–16.2), eating canned food (OR = 9.8, CI = 7.0–10.1), and using newspaper during food preparation (OR = 7.6, CI = 6.3–8.2) are risk factors. There were significant correlations between BLLs and family habits (r = 0.225, P = 0.000), personal habits (r = 0.321, P = 0.000), eating habits (r = 0.128, P = 0.002) and school building characteristics (r = 0.469, P = 0.000). There was a significant correlation between BLLs and anemia in age group 6 < 12 years (P = 0.000) and age group 12 to less than 18 years, among males (P = 0.000) and females (P = 0.041).
Conclusion
The BLLs of children are affected by multiple factors. Female students have higher BLLs and lower hemoglobin concentration than males. The possible sources of lead exposure were use of toothpaste, use of kohl, putting colored toys in the mouth, use of both canned food and canned juice, use of lip gloss in females, and different methods of handling newspaper while preparing food.
Introduction
Lead is a metal that has been associated with human activities for the past 6000 years. That lead is an environmental toxin is an ancient observation. Despite increased attention, lead poisoning is still a serious problem. Lead is a ubiquitous environmental and industrial pollutant that has been detected in every facet of environmental and biological systems.Citation1,Citation2 Lead is a major industrial byproduct and can be found in water pipes, insecticides, linings of equipment where corrosion resistance and pliability are required, petroleum refining, construction, bullets, and X-ray and atomic-radiation protection equipment. The manipulation of lead for these uses has caused lead contamination of air, dust, and soil. Lead has been known to cause mental retardation and learning disorders.Citation3,Citation4 Further sources of lead exposure include automobile emissions from use of leaded gasoline, industrial emissions, cottage industries (eg, battery recycling), lead-soldered cans and water pipes, lead-glazed ceramics, and traditional medicines.Citation5,Citation6 Lead exposure may occur in the home (eg, paint, dust, and soil), workplace, other environments (eg, parents’ occupation and hobbies), or from the use of folk remedies containing lead.Citation7,Citation8 Further, lead exposure may occur through ingestion of flaking lead paint and inhalation of dust and soil contaminated with such paint ().Citation9
Table 1 Possible sources of leadCitation6–Citation10
Lead poisoning in adults occurs more frequently from exposure in the workplace and primarily involves the central nervous system (CNS). Children are more susceptible to lead exposure than adults because they participate in age-appropriate behaviors and activities that result in greater exposure, causing them to absorb more lead than adults and their overall development is also affected.Citation10 Children absorb 40%–50% of dietary lead and retain 2%–25%, whereas adults absorb 5%–10% and retain little.Citation11 Furthermore, children’s digestive systems absorb lead more readily than an adult’s system, and their premature and still-developing CNS is more vulnerable to lead toxicity than a mature CNS.Citation1,Citation12 Lead is a pervasive environmental toxin that affects virtually every system in the body. Evidence of harmful effects in various organs has been found in children whose BLLs exceed 10 μg/dL.Citation13
In 2000, an estimated 120 million people around the world had blood lead concentrations of between 5 and 10 μg/dL, and about the same number had concentrations of >10 μg/dL. Forty percent of all children had blood lead concentrations of >5 μg/dL, and half of these had blood lead concentrations of >10 μg/dL; of these children, 97% were living in developing countries.Citation14 Estimates published recently suggest that the theoretical minimum risk of health effects may occur at blood lead concentrations as low as 0–1 μg/dL.Citation14,Citation15 Blood lead concentrations are indicative of recent lead exposure (within the preceding few weeks) rather than of cumulative long-term exposure. However, exposure to lead varies relatively little over the period of a year this measure can also be a sign of longer-term exposure.Citation16
Workers are also at particular risk in battery manufacturing, demolition work, welding, pottery and ceramic-ware production (often a home-based occupation involving women and children), small businesses repairing automobile radiators, and artisan production of jewelry and decorative items. The last category is of particular concern since the work is predominantly carried out at home or in unregulated workshops, often by women and children. Although adults are mainly involved, in many countries (especially those with developing industries), particularly in small home-based enterprises, there is little distinction between home and workplace, and children are consequently exposed to lead. Because of the transfer of lead to the fetus in utero and the introduction of lead into people’s homes on clothing, through which young children are exposed, problems of occupational exposure become community problems.Citation7,Citation17
Because of rapid industrialization and the persistence of lead in the environment, exposure is likely to remain a significant public health problem in most developing countries for many years; this includes in Al-Madinah, Saudi Arabia. To prepare an action plan, one must first know the prevalence of lead exposure and its sources among the population most affected; namely, children.
The current study was conducted to estimate the prevalence of blood lead levels (BLLs) and to identify the sources of environmental exposure and potential risk factors for elevated BLLs among Saudi schoolchildren.
Subjects and methods
A cross-sectional survey was conducted from March to May 2010. The study population included Saudi school students (of elementary, intermediate, and secondary schools) of both sexes. The total number of students to be selected was estimated using the following formula: n = (Z2 × P × q)/D2.Citation18 Since the actual prevalence of elevated BLL is 20%, the probability of its occurrence was estimated to be P = 0.20. Accordingly, the probability of nonoccurrence will be q = (1 – P) = 0.80. A value of 0.03 was chosen as the acceptable limit of precision (D) at 95% confidence intervals (CIs) where (Z = 1.96). Based on these assumptions, the sample size was estimated at 682.95 children. For ease of calculation and analysis, 685 was chosen as the minimum sample size. The proposal was approved by the human subjects committees at the Taibah University, Ministry of Health, and Ministry of Education, Kingdom of Saudi Arabia.
A multistage sampling technique was used. First, a review of the records of all schools (elementary, intermediate, and secondary schools for boys and girls) was undertaken, and the schools were listed by grade and sex. Then, one school from each grade and each sex was randomly selected. After allocation of the selected schools, classes were enlisted, and then students were simply selected randomly.
Questionnaire
An anonymous self-administered questionnaire was distributed to the students at their schools to take home for their parents to fill in. The questionnaire was prepared in Arabic. Some questionnaires had to be administered by trained interviewers because some parents were not able to complete them without assistance. The purpose, procedure, risks, and benefits of the study were explained to the respondents and verbal and written informed consent was obtained. The survey tool was pre-tested on a random sample of 20 participants to ensure practicability, validity, and interpretation of responses. The reliability of the questionnaire was assessed using Cronbach’s alpha (0.812). The questionnaire included queries on family size; socioeconomic status, including questions on number of possessions, house condition (year of construction, presence of lead pipes, last time the house was painted, number of rooms and bedrooms in the house, whether the family owned or rented the house), parents’ education, and employment status; characteristics of school construction; pregnancy outcomes (birth weight and gestational age); breastfeeding history (duration of breastfeeding and child’s age at the time liquids other than breast milk and solid foods were introduced); and the child’s health (history of anemia, use of iron-fortified formula or cereals, whether the child uses a pacifier or puts fingers/toys in his/her mouth) and general diet (how many times in the last week did the child consume any fruits, vegetables, meat, eggs, legumes, and dairy products). The “family possessions” variable was constructed by summing the presence in the household of one or more of the following items: TV, video player, DVD player, computer, video games, radio, sound equipment, refrigerator, washer, house phone, cellular phone, or car.
BLLs were analyzed by Zeeman background-corrected flameless graphite furnace atomic absorption (model Z-8100; Hitachi, Tokyo, Japan). The limit of detection for the blood lead concentrations was 1.0 μg/dL.Citation19 Hemoglobin was assessed by a Sysmex XE-2100 Automated Hematology Analyzer (Sysmex, Kobe, Japan) with the appropriate calibrator, reagent kits, and quality control processes.Citation20
The mean percent score was calculated (using the formula: total score/maximum possible score × 100) for the following: household exposure (household construction characteristics; see next paragraph), school exposure (school construction characteristics; see below), family, personal, and eating habits.
Hierarchical cluster analysis was used to summate the following: housing construction characteristics (including presence of a workshop or factory near house, width of street, type of house, paint, ground type, water source, and presence of water tanks), school construction characteristics (including presence of workshop or factory near school, width of street, paint, floor, and ground type), family habits (including bakhoor [from the Arabic language; used to describe most incense resins or fragranced wood chips] use, smoking, utensils used in food storage and preparation), personal (use of kohl [an ancient eye cosmetic], cosmetics, lip gloss in females, playing with newspapers, putting colored toys in mouth; and up to the end of elementary school, using colored pencils), and eating habits (including canned food; canned juice; type of utensils used for food preparation and storage; use of newspapers in food preparation, storage, wrapping, and as table mats). After cluster analysis, correlation of some parameters with BLL <10 μg/dL and BLL >10 μg/dL was undertaken.
Statistical analysis
Data were entered and analyzed using SPSS (v 13.0; IBM Corp, Armonk, NY). Data gathered from the cross sectional survey were analyzed using the case control approach. The chi-square test was used for comparisons of nonparametric data. Student’s t-test was used for comparisons of parametric data. Spearman’s rank correlation was used to study correlations. Odds ratio (OR) and the corresponding 95% CI were computed for high BLL. Multiple linear regressions were performed to predict possible causes for increase in BLL.
Results
A total of 557 students participated in the survey, corresponding to approximately 81.3% of the total number of students (685) eligible to participate from the 18 schools. Sex and age distributions varied considerably across schools because nine girls’ schools constituted 47% of the recruited students with a mean age 11.6 ± 2.63 years, and nine boys’ schools constituted 53% of the recruited students with a mean age 12.5 ± 3.5 years (). The mean BLL was 4.94 ± 3.38 μg/dL, with a significant difference between male and female BLLs (r = 0.406, P = 0.000). The distributions of BLLs across six blood-lead categories are presented in . In the three school study levels (elementary, intermediate, and secondary), 19% of children had BLLs <1.0 μg/dL, 16.2% had BLLs from 1.0 to 2.499 μg/dL, 14.5% had BLLs from 2.5 to 4.99 μg/dL, 19.7% had BLLs from 5.0 to 7.49 μg/dL, 25% had BLLs from 7.5 to 9.99 μg/dL, and about 5.6% had BLLs of ≥10 μg/dL ().
Table 2 Demographics of the students in the blood lead level (BLL) survey by school grade, sex, age, and BLL
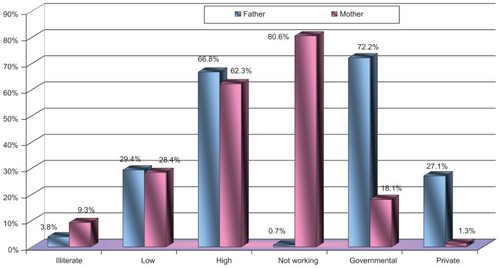
Geometric mean BLLs were significantly associated with family size and education level of the parent guardian. shows that 66.8% of fathers and 62.3% of mothers had a high level of education; meanwhile 80.6% of mothers were housewives. None of the fathers of the students who had BLLs of ≥10 μg/dL had occupational exposure to lead. The mean family size was 7.4 ± 2.12 and mean general crowding index was 1.6 ± 0.59. There was a significant relationship between mean family size and, general crowding index and BLL (r = 0.086, P = 0.042 and r = 0.112, P = 0.008, respectively).
Figure 1 Education and work status of father and mother.
compares the general data of the surveyed individuals grouped according to BLLs. Study groups had significantly differentiated family and personal habits. shows the association between BLLs and family and personal habits, where the highest risk values were associated with the use of cosmetics (OR = 18.5, CI = 14.4–19.8), putting colored toys in mouth (OR = 15.7, CI = 3.6–16.2), eating canned food (OR = 9.8, CI = 7.0–10.1), and using newspaper during food preparation (OR = 7.6, CI = 6.3–8.2). Using cluster analysis, illustrates a significant correlation between BLLs and family habits (r = 0.225, P = 0.000), personal habits (r = 0.321, P = 0.000), eating habits (r = 0.128, P = 0.002) and school construction characteristics (r = 0.469, P = 0.000).
Table 3 Association between blood lead level and family and personal habits
Table 4 Correlation between blood lead level and some studied characters (cluster analysis)
There was a significant relationship between BLLs and family habits (P = 0.000, OR = 8.6, CI = 4.1–11.3), personal habits (P = 0.000, OR = 5.2, CI = 2.1–8.6), eating habits (P = 0.000, OR = 22.3, CI = 20.4–26.7), and mean percent score of possible sources of lead exposure (P = 0.000, OR = 35.5, CI = 34.1–40.5) (, ).
Figure 2 Association between BLL and scores of possible lead exposure (odds ratios [OR]).
![Figure 2 Association between BLL and scores of possible lead exposure (odds ratios [OR]).](/cms/asset/3fefabf9-90d1-4637-87ae-711e59d47ca2/dijg_a_28403_f0002_c.jpg)
Table 5 Mean percent score of possible sources of lead exposure
Regarding the relationship between BLLs and hemoglobin level, shows that there was significant correlation in age group 6–11 years (P = 0.000) and age group 12–18 years, among males (P = 0.000) and females (P = 0.041).
Table 6 Relationship between blood lead level and hemoglobin level by age group
It was found that the predictors for high BLL () were the use of toothpaste (P = 0.000), kohl (P = 0.000), putting colored toys in the mouth (P = 0.000), canned food and canned juice (P = 0.008 and 0.018, respectively), use of lip gloss in females(P = 0.000), and different ways of handling newspapers while preparing food.
Table 7 Predictors of high blood lead level among schoolchildren
Discussion
Both occupational and environmental exposures to lead remain a serious problem in many developing and industrializing countries, as well as in some developed countries.Citation1 Lead is a potent poison that can affect individuals at any age. Children with developing bodies are especially vulnerable because their rapidly developing nervous systems are particularly sensitive to the effects of lead.Citation1,Citation10 Lower age as a risk factor for elevated BLLs among children aged 6–18 years has not been investigated in many countries. The data presented in show an apparent increase in BLLs in the young compared with older people. However, these results are inconsistent with reports from the USA and Australia, where BLLs are highest in 1- to 2-year-old children and decline later.Citation21 In contrast, a study from Russia reported little variation in lead levels by age.Citation22
In the year 2000, an estimated 120 million people around the world had blood lead concentrations of between 5 and 10 μg/dL, and about the same number had concentrations of >10 μg/dL. Forty percent of all children had blood lead concentrations of >5 μg/dL and half of these children had blood lead concentrations of >10 μg/dL; of these children, 97% were living in developing countries. The present work showed that 4.3% of students aged 6–18 years had BLLs > 10 μg/dL, with a mean of 4.94 ± 3.38 μg/dL. This finding was less than expected and even approaches that of developed countries, indicating decreased exposure to different lead sources. Most of the parents and teachers from each school had a high degree of general hygiene – both at home and at school – despite the fact that they were unaware of the risks of lead poisoning and the possible degree of exposure to lead.Citation2
According to the Centers for Disease Control and Prevention (CDC 1991),Citation13 the definition of an elevated concentration of lead in the blood is 10 μg/dL. However, evidence indicating that some health effects can occur below this threshold is accumulating. Recent analyses suggest that health effects may become apparent at concentrations of <5 μg/dL and, indeed, that no evidence exists for a threshold, even at 1 μg/dL.Citation14
Blood lead concentration is an indicator of recent lead exposure (within the preceding few weeks), rather than of cumulative long-term exposure. However, as exposure to lead varies relatively little over the span of 1 year,Citation23 this measure can also be used to assess long-term exposure.Citation22 This was consistent with this research finding where school construction characteristics, family (P < 0.0001), and personal and eating habits (P < 0.0001) were correlated with BLL.
A few studies reported small differences (typically <10%) between blood lead concentrations in males and females.Citation23 This finding was true for this study, where there was a significant difference between males’ and females’ mean BLLs. Males were associated with elevated BLL, which may be due to behavioral differences between boys and girls. In the Second and Third National Health and Nutrition Examination Surveys, the prevalence of elevated BLL was higher among boys than in girls, but the difference was not statistically significant.Citation24,Citation25
Much research has been conducted recently on children with moderately raised BLLs associated with environmental exposure. The potential for adverse effects of lead exposure in children is heightened because: the intake of lead per unit body weight is higher for children than for adults; young children often place objects in their mouths, resulting in the possibility of dust and soil contaminated with lead being ingested; physiological uptake rates of lead in children are higher than those in adults; young children are undergoing rapid development; and their systems are not fully developed.Citation26,Citation27 Unlike overt lead toxicity, where there is usually one identifiable source, low-level environmental exposure to lead is associated with multiple sources (petrol, industrial processes, paint, solder in canned foods, water pipes) and pathways (air, household dust, street dirt, soil, water, food).Citation17,Citation28 In the current study, it was found that the possible sources for lead may be use of toothpaste, use of kohl, putting colored toys in the mouth, use of both canned food and juice, use of lip gloss in females, and different methods of handling newspaper while preparing food – nearly the same sources found by other research as stated above.
This work indicated a significant relationship between BLL and hemoglobin level, especially among females (P < 0.0001) with lower mean hemoglobin level than males, and especially for age group 12–18 years. Hazards for anemia and gastrointestinal effects were based on a large review of toxicological and epidemiological data.Citation27 Based on the results of a study by Schwartz, et al,Citation29 as a consequence of individual variation, we considered that only 20% of the people with blood lead concentrations above those indicated by the Agency for Toxic Substances and Disease Registry would actually develop symptoms.Citation29,Citation30 Absorbed lead inhibits the activity of a number of enzymes involved in heme biosynthesis. Several studies have shown that the activity of δ-aminolevulinic acid dehydratase is affected at very low BLLs, with no apparent threshold.Citation31 Typically, lead-induced anemia arises from a combination of reduced hemoglobin formation (caused either by impaired heme synthesis or globin chain formation) and reduction in erythrocyte survival because of hemolysis.Citation32
Conclusion
Female students have a higher blood lead level than males. They also have a lower blood hemoglobin level. The possible sources of lead exposure included the use of toothpaste, kohl, canned food and canned juice, putting colored toys in the mouth, use of lip gloss in females, and different methods of handling newspaper while preparing food.
Recommendation
A health-education intervention program should be planned and directed to parents, teachers, and students to increase their awareness of sources of lead exposure and how to avoid them. Possible interventions include providing soap and water at schools and homes, frequently washing hands and face, thoroughly cleaning fruits and vegetables, and limiting dust on floors and furniture. Children should be educated not to suck on their fingers, pencils, or toys, or to eat soil. A treatment plan should be designed for those who have an elevated BLL, with continuous evaluation.
Study limitation
An assessment of the effect of BLL upon scholastic achievement together with measurement of the intelligence quotient for both students and their parents (especially mother) were needed, but many difficulties (related to schools, students, and parents) faced the authors in carrying these out.
Acknowledgments
This research work was financially supported by research grant 440/430, funded by the Deanship of Scientific Research, Taibah University, Al-Madinah Al-Munawwarah, Saudi Arabia. The authors also thank the Ministry of Education for approving the study protocol, the local field workers for their invaluable assistance in the data collection activities, and the school principals and teachers for welcoming us into their schools.
Disclosure
The authors report no conflicts of interest in this work.
References
- NeedlemanHLead poisoningAnnu Rev Med20045520922214746518
- MeyerPABrownMJFalkHGlobal approach to reducing lead exposure and poisoningMutat Res20086591–216617518436472
- ToscanoCDGuilarteTRLead neurotoxicity: from exposure to molecular effectsBrain Res Rev200549352955416269318
- GarzaAVegaRSotoECellular mechanisms of lead neurotoxicityMed Sci Monit2006123RA576516501435
- GottesfeldPPokhrelAKReview: lead exposure in battery manufacturing and recycling in developing countries and among children in nearby communitiesJ Occup Environ Hyg20118952053221793732
- BrownMJRaymondJHomaDKennedyCSinksTAssociation between children’s blood lead levels, lead service lines, and water disinfection, Washington, DC, 1998–2006Environ Res20111111677421112052
- LinSHWangXRYuITTangWNLiJLiuBOLead powder use for skin care and elevated blood lead level among children in a Chinese rural areaJ Expo Sci Environ Epidemiol201122219820322166809
- KauffmanJFWestenbergerBJRobertsonJDGuthrieJJacobsACumminsSKLead in pharmaceutical products and dietary supplementsRegul Toxicol Pharmacol200748212813417467129
- RappazzoKCummingsCEHimmelsbachRMTobinRThe effect of housing compliance status on children’s blood lead levelsArch Environ Occup Health2007622818518316265
- JakubowskiMLow-level environmental lead exposure and intellectual impairment in children – the current concepts of risk assessmentInt J Occup Med Environ Health20112411721468897
- MarkowitzMLead poisoningPediatr Rev20002132733511010979
- IglesiasVSteenlandKMaisonetMPinoPExposure to lead from a storage site associated with intellectual impairment in Chilean children living nearbyInt J Occup Environ Health201117431432122069929
- Centers for Disease Control and Prevention (CDC)Preventing Lead Poisoning in Young Children: A Statement by the Centers for Disease ControlAtlanta, GACDC1991
- LanphearBPDietrichPAuingerPCoxCSubclinical lead toxicity in US children and adolescentsPublic Health Rep200011552152911354334
- SchwartzJLow-level lead exposure and children’s IQ: a meta-analysis and search for a thresholdEnviron Res19946542558162884
- World Health Organization (WHO)The WHO World Health Report 2001GenevaWorld Health Organization2001
- Von SchirndingYEThe impact of lead poisoning on the workforce and societyGeorgeAMProceedings of the International Conference on Lead Poisoning1999 February 8–10Bangalore, IndiaBangaloreThe George Foundation19994147
- LwangaSKLemeshowSSample Size Determination in Health Studies: A Practical ManualGenevaWHO1991
- HuHAroAPaytonMThe relation of bone and blood lead to hypertensionJAMA199627515117168609684
- PengSZhangCWangCThe investigation on the changes of hematological parameters in the occupationally lead exposed workersZhonghau Lao Dong Wei Sheng Zhi Ye Bing Za Zhi20022053345
- BrodyDJPirkleJLKramerRABlood lead levels in the U.S. population: phase 1 of the Third National Health and Nutrition Examination Survey (NHANES III, 1988 to 1991)JAMA199427242772838028140
- RubinCHEstebanEJonesRChildhood lead poisoning in Russia: a site-specific pediatric blood lead evaluationInt J Occup Environ Health1997342412489891123
- WHOAir Management Information System (AMIS) 20GenevaWHO1998
- MahaffeyKRAnnestJKRobertsJMurphyRSNational estimates of blood lead levels: United States, 1976–1980: association with selected demographic and socioeconomic factorsN Engl J Med19823075735797110203
- PirkleJLKaufmannRBBrodyDJHickmanTGunterEWPaschalDCExposure of the U.S. population to lead, 1991–1994Environ Health Perspect19981067457509799191
- NriaguJSenthamarai-KannanRJamilHFakhoriMKorponicSLead poisoning among Arab American and African American children in the Detroit metropolitan area, MichiganBull Environ Contam Toxicol201187323824421725626
- TongSMcMichaelAJThe magnitude, persistence and public health significance of cognitive effects of environmental lead exposure in childhoodJ Environ Med199912103110
- MaasRPPatchSCUpdate on research findings and regulatory/legal activities regarding tap water lead exposure from traditional leaded-brass and “no-lead” type plumbing partsJ New Engl Water Works Assn200486114127
- SchwartzJLandriganPJBakerELJrOrensteinWAvon LindernIHLead-induced anemia: dose–response relationships and evidence for a thresholdAmerican Journal of Public Health19908021651682297059
- Agency for Toxic Substances and Disease RegistryToxicological Profile for Lead (Update)Atlanta, GAUS Department of Health and Human Services1999
- ScinicarielloFMurrayHEMoffettDBAbadinHGSextonMJFowlerBALead and delta-aminolevulinic acid dehydratase polymorphism: where does it lead? A meta-analysisEnviron Health Perspect20071151354117366816
- WangQZhaoHHChenJWdelta-Aminolevulinic acid dehydratase activity, urinary delta-aminolevulinic acid concentration and zinc protoporphyrin level among people with low level of lead exposureInt J Hyg Environ Health20102131525819733117