
Abstract
Objective
The occurrence and development of hepatocellular carcinoma (HCC) remain unclear. This study aimed to investigate potential diagnostic or prognostic markers for early HCC by applying bioinformatic analysis.
Methods
The gene expression profiles of early HCC and normal tissues from a TCGA dataset were used to identify differentially expressed genes (DEGs) and then analysed by weighted gene coexpression network analysis. The integrated genes were selected to construct the protein–protein interaction (PPI) network and determine the hub genes. The prognostic impact of the hub genes was then analysed.
Results
A total of 508 integrated genes were selected from the 615 DEGs and 8956 genes in the turquoise module. A PPI network was constructed, and the top 20 hub genes, including apolipoprotein A-IV (APOA4), fibrinogen gamma chain (FGG), vitamin K-dependent protein Z (PROZ), secreted phosphoprotein 24 (SPP2) and fetuin-B (FETUB), were identified. Only PROZ was significantly associated with the prognosis of early HCC.
Conclusion
In this study, we demonstrated that the expression of PROZ was decreased in early HCC compared with normal liver controls, and low PROZ expression might result in poor overall survival of early HCC.
Introduction
Liver cancer is one of the most commonly occurring tumours around the world, especially in epidemic areas of hepatic viruses, such as Japan, South Korea, China and Thailand.Citation1–Citation3 Hepatocellular carcinoma (HCC) is the majority type of liver cancer. Although factors, including alcoholic abuse, fatty liver and aflatoxin, could induce the carcinogenesis of HCC,Citation4 hepatic B virus infection is the first aetiology of HCC in these Asian countries.Citation5,Citation6 The number of patients with HCC is still increasing, and the prognosis of HCC remains poor due to a lack of effective treatment.Citation7 It has been reported that the five-year survival rate of advanced-stage HCC is less than 15%,Citation8 while the five-year survival rate of early-stage HCC is more than 75%.Citation9 Thus, the medical burden is heavy in terms of patients with HCC, and thus, early diagnosis of HCC is extremely important.
The current methods for diagnosing HCC mainly include the detection of tumour biomarkers, imaging examination and liver biopsy.Citation10 Among the tumour biomarkers, alpha-fetoprotein (AFP) is the most frequently used biomarker for HCC diagnosis and surveillance.Citation11 Other biomarkers, such as glypican-3 (GPC3),Citation12 Golgi protein 73 (GP73),Citation13 and des-γ-carboxyprothrombin (DCP),Citation14 are also believed to be potentially useful in diagnosing HCC. However, the above biomarkers are not effective for diagnosing early HCC. Thus, exploring novel biomarkers is extremely important for improving the long-term survival of patients with HCC. Protein Z, a vitamin K-dependent plasma glycoprotein (PROZ), is synthesized in the liver and secreted into the plasma and has been found to be a novel biomarker for diagnosing early-stage pancreatic cancer.Citation15 However, the value of PROZ for detecting early HCC or predicting the prognosis of early HCC has not been reported. B ultrasonication is the most widely applied examination for HCC and is especially associated with AFP for monitoring HCC development. Liver biopsy is the most useful method for diagnosing HCC. However, for diagnosis of those with HCC with a background of liver cirrhosis, biopsy does not always work.
The poor prognosis of those with HCC is mainly related to the late clinical stage when HCC is diagnosed. Thus, exploring early and even very early diagnostic methods for HCC is the most effective approach for improving the prognosis of those with HCC. This study aimed to investigate potential diagnostic or prognostic markers for HCC by applying bioinformatic analysis.
Materials and Methods
Identification of Differentially Expressed Genes (DEGs)
The fragments per kilobase per million values (FPKMs) of the gene expression profiles of 100 early HCCs and 40 normal controls were downloaded from The Cancer Genome Atlas (TCGA) dataset (https://portal.gdc.cancer.gov/). The clinical data of the early HCCs were obtained from the TCGA dataset. Early HCC has been defined by the American Joint Committee on Cancer TNM Staging System (AJCC TNM, 2018 Edition) stage I. Only early HCC patients with survival data were included in this study. The gene expression data were then analysed via R software by using the Limma package for identifying the DEGs. The cut-off criterion of DEGs was adjusted with P<0.05 and |log2FC|>1. Written consent was not needed for the public data used in this study.
Weighted Gene Co-Expression Network Analysis (WGCNA)
The TCGA gene dataset of early HCC and controls was further explored by applying WGCNA. The most significant module genes in WGCNA were selected and then intersected with the DEGs that were identified above to obtain the integrated genes.
Functional Enrichment Analysis
Gene ontology (GO) analysis of the integrated genes, including categories of biological processes (BP), cellular components (CC) and molecular functions (MF), was performed in R by employing the Database for Annotation, Visualization and Integrated Discovery (DAVID). Moreover, Kyoto Encyclopedia of Genes and Genomes (KEGG) pathway analysis of the above genes was performed in R.
Protein-Protein Interaction (PPI) Network Analysis and Selection of Hub Genes
The PPI network of the integrated genes was built by using the STRING dataset (the Retrieval of Interacting Genes/Proteins, https://string-db.org/), a public website for exploring protein-protein interactions. Then, the hub genes were selected from the PPI network by applying the cytoHubba plugin. The algorithm of maximal clique centrality in cytoHubba was chosen to identify the top 20 hub genes.
Overall Survival Analysis and Expression Validation of the Hub Gene
The clinical data of the included early HCCs were downloaded from TCGA. The overall survival (OS) and disease-free survival (DFS) analyses of the hub genes were performed in R by using the survival package and the clinical data. Then, the gene expression of the prognosis-associated hub genes was validated by using the GSE12443 gene expression profile. Gene expression data of 24 cirrhotic nodules (CNs) and 10 early HCCs in GSE12443 were used in this study.
Statistical Analysis
The data were analysed in SPSS version 22.0 for Windows (IBM, Armonk, New York, USA), GraphPad Software version 7 (GraphPad Software, San Diego, California) and R software version 4.0.2 (The R Foundation for Statistical Computing, USA). The Wilcoxon test was used to identify the DEGs with |Log FC| >1 and an adjusted P value of <0.05. The Pearson’s χ2 test was applied to compare the clinico-pathological characteristics. The Kaplan-Meier method was used for survival analysis. Student’s t-test for normally distributed data and the Mann–Whitney test for nonnormally distributed data were used to identify the differences. The criteria for statistical significance were a P-value of <0.05.
Results
Integrated Genes Identified in Early HCC
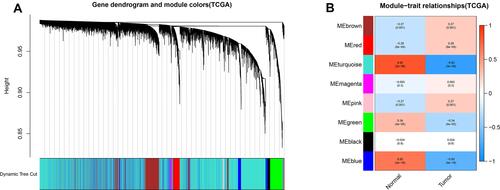
A total of 615 DEGs, including 67 upregulated and 548 downregulated DEGs, were identified by comparing 100 early HCCs and 40 normal controls. The ethnicities of the early HCCs were mainly non-Hispanic or non-Latino. The clinical patterns of the 100 early HCCs are summarized in . and present the heat map and volcano plots of the DEGs. The genes were divided into eight modules by WGCNA (). Among these modules, the turquoise module, which contained 8956 genes, had the highest significance (). Finally, 508 integrated genes were selected by intersecting the genes in the turquoise module and DEGs.
Table 1 Clinical Patterns of the Early HCCs Included in This Study
Figure 1 Heatmap of the differentially expressed genes in early hepatocellular carcinoma. Red, upregulated. Green, downregulated. T, tumour. N, normal. 4, 4, level of gene expression.
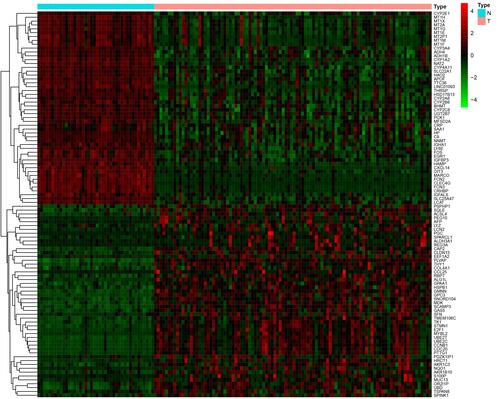
Figure 2 Volcano plot of the differentially expressed genes in early hepatocellular carcinoma. Red, upregulated. Green, downregulated.

Figure 3 Weighted gene coexpression network analysis of gene expression profiles between early hepatocellular carcinoma and normal controls. (A) Gene dendrogram. (B) Module-trait relationships. Genes in modules are marked with different colours (brown, red, pink, green, black, magenta, blue and turquoise).
GO and KEGG Analysis of the Integrated Genes
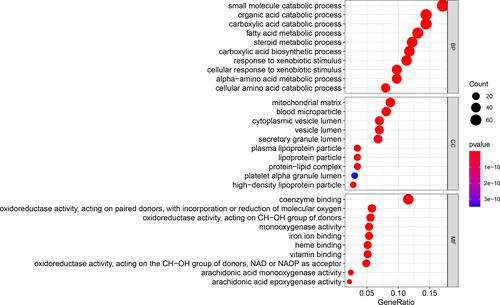
The GO functional analysis results () showed that the integrated genes were mostly enriched in the BP category: small molecule catabolic process, organic acid catabolic process, carboxylic acid catabolic process and fatty acid metabolic process; CC category: mitochondrial matrix, blood microparticle, cytoplasmic vesicle lumen; MF category: coenzyme binding, oxidoreductase activity and monooxygenase activity.
Figure 4 Gene ontology functional enrichment analysis of the integrated genes. The left y-axis represents the P-value. The x-axis represents the ratio of enriched genes.
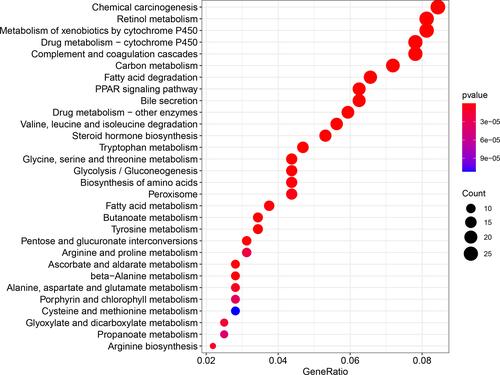
The KEGG pathway enrichment analysis results () showed that the integrated genes were mainly enriched in pathways, such as chemical carcinogenesis, retinol metabolism and metabolism of xenobiotics by cytochrome P450.
Figure 5 Kyoto encyclopedia of genes and genomes pathway enrichment analysis of the integrated genes. The left y-axis represents the P-value. The x-axis represents the ratio of enriched genes.
PPI Network Construction and Identification of Hub Genes
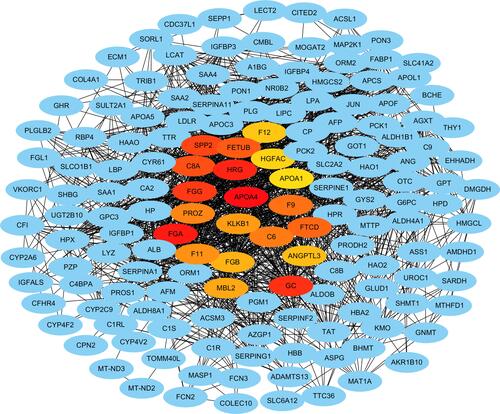
A PPI network with 477 nodes and 3752 edges was constructed for the integrated genes to evaluate the protein-protein interactions (). The average local clustering coefficient was 0.429, and the PPI enrichment P value was < 1.0e-16. The hub genes with the highest connections were identified ( and Supplementary Table 1), namely, apolipoprotein A-IV (APOA4), fibrinogen gamma chain (FGG), protein Z, vitamin K dependent plasma glycoprotein (PROZ), secreted phosphoprotein 24 (SPP2) and fetuin-B (FETUB), complement C8 alpha chain (C8A), fibrinogen alpha chain (FGA), coagulation factor XI (F11), fibrinogen beta chain (FGB), mannose-binding lectin 2 (MBL2), kallikrein B1 (KLKB1), histidine rich glycoprotein (HRG), coagulation factor XII (F12), HGF activator (HGFAC), apolipoprotein A-I (APOA1), coagulation factor IX (F9), complement C6 (C6), GC vitamin D binding protein (GC), formimidoyltransferase cyclodeaminase (FTCD) and angiopoietin-like-3 (ANTL3). All these hub genes were downregulated in early HCCs.
Figure 6 Protein-protein interaction network and the selected hub genes from the integrated genes. Blue nodes represent genes. Edges represent the associations. Red and yellow nodes represent hub genes.
Overall Survival Analysis and Expression Validation of the Hub Genes
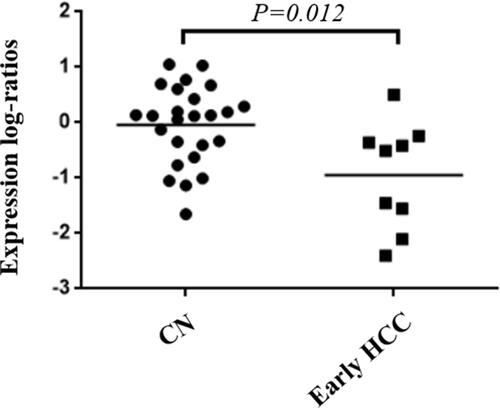
OS and DFS analyses of the identified hub genes were performed by using TCGA clinical data of the early HCCs. The results showed that the low expression of PROZ was significantly associated with poor prognosis of early HCCs (P=0.019) ( and Supplementary Table 2). There was no significant correlation between the expression level of PROZ and the prognosis of early HCC (Supplementary Figure 1). However, DFS analysis results showed that there was no significant difference in the expression level of PROZ (=0.444) (). The GSE data analysis validated that PROZ was significantly downregulated in early HCC compared with cirrhotic nodules (P=0.012) ().
Figure 7 Prognostic analysis of PROZ in early HCC. (A) Disease-free survival, (B) overall survival, 1, low expression of PROZ, 2, relatively low expression of PROZ, 3 relatively high expression of PROZ, 4, high expression of PROZ.
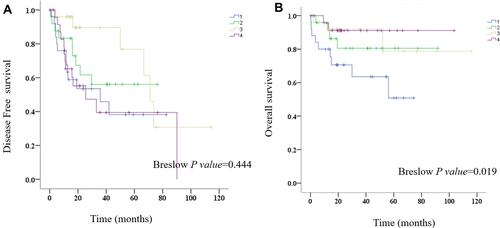
Figure 8 Validation of the downregulation of PROZ in early HCC and controls.
Discussion
HCC is a leading cause of death worldwide, especially in Asian areas where chronic hepatitis virus infection spreads. The poor prognosis of HCC was mainly associated with the low early diagnosis rate. Thus, exploring the underlying mechanism of the development of HCC is important for identifying early diagnostic biomarkers for HCC and for improving the prognosis of HCC. Although various studies have attempted to discover new biomarkers for predicting the prognosis of HCC or detecting early HCC,Citation16,Citation17 these biomarkers lack effectiveness for HCC, and most studies have focused on whole-stage HCC.
In this study, we obtained 508 significant genes by exploring the expression dataset of early HCC and normal controls by using WGCNA. These genes were mainly involved in biological processes, such as small molecule catabolic process, organic acid catabolic process, oxidoreductase activity and monooxygenase activity and the pathways of chemical carcinogenesis, retinol metabolism and metabolism of xenobiotics by cytochrome P450. Then, we identified 20 hub genes from the integrated genes, but only the PROZ gene was significantly associated with the prognosis of early HCC.
PROZ encodes a glycoprotein, namely, the protein Z (PZ)/protein Z-dependent protease inhibitor (ZPI), which plays a critical role in blood coagulation under physiological conditions. PROZ is mainly synthesised in the liver and kidney tissues and then secreted into the blood. Although the plasma level of PZ has been reported to be decreased in cancers, such as acute leukaemia and acute lymphoblastic leukaemia,Citation18,Citation19 the PROZ expression level was found to be increased in most cancer types, especially in advanced cancer stages.Citation18 The function of PROZ in tumorigenesis is still unknown. PROZ might promote cancer progression by limiting the activation of blood coagulation.Citation20 PROZ was found to be highly expressed in pancreatic cancer compared with healthy controls and pancreatic benign controls, which demonstrated that PROZ might be a novel biomarker for the early diagnosis of pancreatic cancer.Citation15 This illustrated that PROZ might play a critical role in the early diagnosis of HCC.
In breast cancer, the PZ protein has been reported to be strongly expressed in breast cancer cells compared to normal breast tissue.Citation21,Citation22 Similar results were also observed for endometrial cancer.Citation23 Moreover, for gastric cancer, the mRNA expression of PROZ was detected in gastric cancer cells and not in normal tissues.Citation24 Factors X and PZ have been demonstrated to be colocalized in gastric cancer tissues.Citation24 The above phenomenon was also observed in colon cancer and non-small lung cancer.Citation25,Citation26 Additionally, the mRNA and protein expression levels of PROZ were elevated in lung adenocarcinoma cells compared to normal healthy lung tissues and might serve as a prognostic biomarker for lung cancer.Citation27
However, PROZ was found to be decreased in HCC tissues compared with control tissues and was significantly associated with overall survival in HCC.Citation28 This was consistent with the results of this study. However, in our study, a difference in PROZ was found by comparing early HCC tissues with normal liver tissues. The low expression of PROZ contributed to the poor prognosis of early HCC. Furthermore, PROZ has been shown to be hypermethylated in HCC compared to normal liver controls.Citation29 Although hypermethylated PROZ might increase the cell clonogenicity and viability in HCC cells and promote their invasion and metastasis, PROZ cannot be completely considered a tumour suppressor gene.Citation29,Citation30
Although we preliminarily verified PROZ expression by using the GSE dataset, our study had some limitations, such as the relatively low number of early HCCs and the lack of experimental results validating PROZ. Thus, more experiments and more samples need to be performed and included to validate our results.
Abbreviations
HCC, Hepatocellular carcinoma; LC, Liver cirrhosis; DEGs, Differentially expressed genes; WGCNA, Weighted gene co-expression network analysis; GO, Gene ontology; BP, Biological processes; CC, Cellular components; MF, Molecular functions; KEGG, Kyoto Encyclopedia of Genes and Genomes; PPI, Protein-protein interaction; APOA4, Apolipoprotein A-IV; FGG, Fibrinogen gamma chain; PROZ, Vitamin K-dependent protein Z; SPP2, Secreted phosphoprotein 24; FETUB, Fetuin-B; PZ/ZPI, Protein Z/protein Z-dependent protease inhibitor.
Data Sharing Statement
The datasets supporting the conclusions of this study are included with the article.
Ethics Declarations
Ethics approval and written consent were not needed for this study exploring the public data.
Disclosure
The authors report no conflicts of interest in this work.
Additional information
Funding
References
- Siegel RL, Miller KD, Fuchs HE, Jemal A. Cancer statistics, 2021. CA Cancer J Clin. 2021;71(1):7–33.
- Cao W, Chen H-D, Yu Y-W, Li N, Chen W-Q. Changing profiles of cancer burden worldwide and in China: a secondary analysis of the global cancer statistics 2020. Chin Med. 2021;134(7):783–791. doi:10.1097/CM9.0000000000001474
- Sung H, Ferlay J, Siegel RL, et al. Global cancer statistics 2020: GLOBOCAN estimates of incidence and mortality worldwide for 36 cancers in 185 countries. CA Cancer J Clin. 2021;71(3):209–249. doi:10.3322/caac.21660
- Wang S, Toy M, Hang Pham TT, So S, Alpini GD. Causes and trends in liver disease and hepatocellular carcinoma among men and women who received liver transplants in the U.S., 2010–2019. PLoS One. 2020;15(9):e0239393. doi:10.1371/journal.pone.0239393
- Si J, Yu C, Guo Y, et al. Chronic hepatitis B virus infection and total and cause-specific mortality: a Prospective Cohort Study of 0.5 million people. BMJ Open. 2019;9(4):e027696. doi:10.1136/bmjopen-2018-027696
- Song C, Lv J, Liu Y, et al. Associations between hepatitis B virus infection and risk of all cancer types. JAMA Netw Open. 2019;2(6):e195718. doi:10.1001/jamanetworkopen.2019.5718
- Signoriello S, Annunziata A, Lama N, et al. Survival after locoregional treatments for hepatocellular carcinoma: a Cohort Study in real-world patients. ScientificWorldJournal. 2012;2012:564706. doi:10.1100/2012/564706
- Lin CL, Kao JH; Research H. Prevention of hepatitis B virus-related hepatocellular carcinoma. Hepatoma Res. 2021;7(1):9.
- Sangiovanni A, Colombo M. Treatment of hepatocellular carcinoma: beyond international guidelines. Liver Int. 2016;36:124–129. doi:10.1111/liv.13028
- Osho A, Rich NE, Singal AG. Role of imaging in management of hepatocellular carcinoma: surveillance, diagnosis, and treatment response. Hepatoma Res. 2020;6. doi:10.20517/2394-5079.2020.42
- Wang T, Zhang KH. New blood biomarkers for the diagnosis of AFP-negative hepatocellular carcinoma. Front Oncol. 2020;10:1316. doi:10.3389/fonc.2020.01316
- Zhao S, Long M, Zhang X, et al. The diagnostic value of the combination of Golgi protein 73, glypican-3 and alpha-fetoprotein in hepatocellular carcinoma: a diagnostic meta-analysis. Ann Transl Med. 2020;8(8):536. doi:10.21037/atm.2020.02.89
- Wu M, Liu Z, Li X, Zhang A, Li N. Dynamic changes in serum markers and their utility in the early diagnosis of all stages of hepatitis B-associated hepatocellular carcinoma. Onco Targets Ther. 2020;13:827–840. doi:10.2147/OTT.S229835
- Yamazaki S, Takayama T, Kurokawa T, et al. Next-generation des-r-carboxy prothrombin for immunohistochemical assessment of vascular invasion by hepatocellular carcinoma. BMC Surg. 2020;20(1):201. doi:10.1186/s12893-020-00862-0
- Wu X, Zhang ZX, Chen XY, et al. A panel of three biomarkers identified by iTRAQ for the early diagnosis of pancreatic cancer. Proteomics Clin Appl. 2019;13(5):e1800195. doi:10.1002/prca.201800195
- Li D, Ji Y, Guo J, Guo Q. Upregulated expression of MTFR2 as a novel biomarker predicts poor prognosis in hepatocellular carcinoma by bioinformatics analysis. Future Oncol. 2021;17(24). doi:10.2217/fon-2020-1160
- Liang Y, Ma B, Jiang P, Yang HM. Identification of methylation-regulated differentially expressed genes and related pathways in hepatocellular carcinoma: a study based on TCGA database and bioinformatics analysis. Front Oncol. 2021;11:636093. doi:10.3389/fonc.2021.636093
- Shang Y, Pan XY, Ding CP, et al. [Clinical significance of protein Z detection in patients with malignant tumors]. Chinese Journal of Cancer. 2005;24(9):1144–1147. Chinese.
- Galar M, Piszcz J, Bolkun L, Szumowska A, Kloczko J. Protein Z concentrations in patients with acute leukemia. Clin Appl Thromb Hemost. 2012;18(5):542–545. doi:10.1177/1076029611429784
- Wojtukiewicz MZ, Sierko E, Kisiel W. The role of hemostatic system inhibitors in malignancy. Semin Thromb Hemost. 2007;33(7):621–642. doi:10.1055/s-2007-991530
- Sierko E, Wojtukiewicz MZ, Zimnoch L, Tokajuk P, Kisiel W. Protein Z is present in human breast cancer tissue. Int J Hematol. 2011;93(5):681–683. doi:10.1007/s12185-011-0846-3
- Sierko E, Wojtukiewicz MZ, Ostrowska-Cichocka K, Zimnoch L. Protein Z-dependent protease inhibitor (ZPI) is present in loco in human breast cancer tissue. Thromb Haemost. 2010;104(1):183–185. doi:10.1160/TH09-09-0666
- Sierko E, Zabrocka E, Ostrowska-Cichocka K, Tokajuk P, Zimnoch L, Wojtukiewicz MZ. Co-localization of coagulation factor X and its inhibitory system, PZ/ ZPI, in human endometrial cancer tissue. In Vivo (Brooklyn). 2019;33(3):771–776. doi:10.21873/invivo.11538
- Sierko E, Wojtukiewicz MZ, Zimnoch L, Tokajuk P, Ostrowska-Cichocka K, Kisiel W. Protein Z/protein Z-dependent protease inhibitor system in loco in human gastric cancer. Ann Hematol. 2014;93(5):779–784. doi:10.1007/s00277-013-1941-8
- Sierko E, Wojtukiewicz MZ, Zimnoch L, Tokajuk P, Ostrowska-Cichocka K, Kisiel W. Co-localization of protein Z, protein Z-dependent protease inhibitor and coagulation factor X in human colon cancer tissue: implications for coagulation regulation on tumor cells. Thromb Res. 2012;129(4):e112–118. doi:10.1016/j.thromres.2011.10.027
- Sierko E, Wojtukiewicz MZ, Zimnoch L, et al. Protein Z/protein Z-dependent protease inhibitor system in human non-small-cell lung cancer tissue. Thromb Res. 2012;129(4):e92–96. doi:10.1016/j.thromres.2011.09.005
- Wang H, Huang F, Pan XY, et al. Quantification of protein Z expression in lung adenocarcinoma tissues and cells. Springerplus. 2016;5(1):1046. doi:10.1186/s40064-016-2610-x
- Li Z, Xu J, Cui H, Song J, Chen J, Wei J. Bioinformatics analysis of key biomarkers and potential molecular mechanisms in hepatocellular carcinoma induced by hepatitis B virus. Medicine (Baltimore). 2020;99(20):e20302. doi:10.1097/MD.0000000000020302
- Neumann O, Kesselmeier M, Geffers R, et al. Methylome analysis and integrative profiling of human HCCs identify novel protumorigenic factors. Hepatology. 2012;56(5):1817–1827. doi:10.1002/hep.25870
- Vasse M. The protein Z/protein Z-dependent protease inhibitor complex. Systemic or local control of coagulation? Hamostaseologie. 2011;31(3):155–158, 160–154. doi:10.5482/ha-1161