
Abstract
Background
Cardiac troponin T (cTnT) is currently one of the important indicators for clinical diagnosis of myocardial injury, which is inevitable in cardiac surgery, especially coronary artery bypass grafting (CABG). Describing the release profile of cTnT and finding out the risk factors of postoperative myocardial injury (PMI) are of great significance. The purposes of this study are to explore the release profile of cTnT in patients undergoing CABG and to search for independent risk factors of PMI.
Methods
In this retrospective study, clinical data of CABG patients were collected. The cTnT was measured at 24 hours before and 6, 12, 24, 48, 72, 96 and 120 hours after operation separately. The release profiles and peak time of cTnT in total cohort and sub-cohorts were observed. Independent risk factors of PMI were explored via univariate and multivariate logistic regression analyses.
Results
In total, 2084 patients were enrolled, including 998 patients in a cTnT group and 1086 patients in a high-sensitive cTnT (hs-cTnT) group. PMI was recognized in 797 patients. In both groups, cTnT showed a trend of rising first and then falling within 120 hours after operation. The peak cTnT appeared within 12–24 hours after operation, while the peak hs-cTnT occurred mostly within 24–48 hours after operation. Univariate logistic analysis showed that body mass index (BMI), New York Heart Association (NYHA) classification, coronary artery disease (CAD) classification, cerebrovascular disease, left ventricular ejection fraction, number of diseased vessels, valvular disease, intra-aortic balloon pump (IABP) implantation, chronic obstructive pulmonary disease, pulmonary hypertension, previous percutaneous coronary intervention (PCI), BMI, bypass graft number, cardiopulmonary bypass, and preoperative cTnT were related risk factors. Multivariate logistic regression analysis showed that NYHA classification, CAD classification, valvular disease, IABP implantation, pulmonary hypertension, previous PCI, bypass graft number, cardiopulmonary bypass, and preoperative cTnT were independent risk factors of PMI.
Conclusion
NYHA classification, CAD classification, valvular disease, IABP implantation, pulmonary hypertension, previous PCI, bypass graft number, cardiopulmonary bypass, and preoperative cTnT are independent risk factors of PMI in patients undergoing CABG.
Background
In recent years, the incidence of cardiovascular diseases has increased year-to-year with the social development.Citation1 Coronary artery bypass grafting (CABG) is one of the main treatments for serious coronary artery diseases (CADs), and the number of operations is increasing.Citation2,Citation3 Postoperative myocardial injury (PMI) is inevitable,Citation4,Citation5 which can be identified and diagnosed by myocardial injury markers, such as cardiac troponin T (cTnT).Citation6–Citation8 Early recognition of PMI is conducive to early intervention, reducing complications and improving prognosis. However, few studies have focused on the release profile of cTnT and the risk factors of PMI. This study is aimed to explore the release profile of cTnT after CABG and to find out independent risk factors of PMI.
Methods
Patients
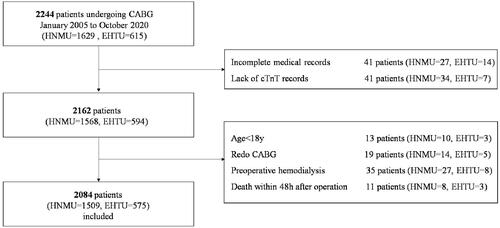
This two-center retrospective study enrolled 2244 consecutive patients undergoing CABG (including on-pump CABG and off-pump CABG) in the First Affiliated Hospital of Nanjing Medical University and the East Hospital Affiliated to Tongji University between January 2005 and October 2020. Exclusion criteria were preoperative hemodialysis (35 cases), age < 18 years (13 cases), redo CABG (19 cases), death during operation or within 48 hours after operation (11 cases), lack of preoperative cTnT (41 cases), and lack of medical record (41 cases) (). Finally, 2084 patients formed the research database. All included patients or their legal representatives signed written informed consent in the study and all surgical procedures. Blood for measurement of cTnT was sampled at 24 hours before and 6, 12, 24, 48, 72, 96, and 120 hours after operation separately. The detection limit of cTnT is 0.1–2 ng/mL and the normal range is 0–0.1 ng/mL.Citation9 The new-generation high-sensitivity cTnT (hs-cTnT) has been adopted in clinical practice since 2012. The detection limit of hs-cTnT is 0–10,000 ng/l and normal range is 0–14 ng/l.Citation10–Citation12 According to the cTnT measurement method, the patients were divided into two sub-cohorts: a cTnT group and an hs-cTnT group. This study was approved by the Ethics Committee of Shanghai East Hospital and registered with the number of ChiCTR2100044847 (http://www.chictr.org.cn/). This study was conducted in accordance with the Declaration of Helsinki.
Figure 1 Flow chart of inclusion and exclusion.
Study Endpoints
Endpoints of this study were the incident and risk factors of PMI. According to the fourth universal definition of myocardial infarction, PMI was defined as elevation of cTnT/hs-cTnT > 10 times of the 99th percentile upper reference limit in patients with normal baseline values. Patients with elevated pre-procedural cTnT/hs-cTnT must meet the criteria for a > 10-fold increase and manifest a > 20% change from the baseline value.Citation13 In addition to the criteria for PMI, the definition of postoperative myocardial infarction also meets at least one of the standards: (1) generation of new pathological Q waves; (2) imaging evidence of myocardial necrosis; (3) results of angiography consistent with the complications of surgical procedures (for example, coronary artery dissection, occlusion of major epicardial arteries or grafts, collateral artery occlusion thrombus, blood flow interruption or distal embolism).Citation13
Statistical Analysis
The measured data in normal distribution were expressed as mean ± standard, and compared between groups by an independent two-sample Student’s t-test. The measured data in non-normal distribution were expressed as median and interquartile ranges, and compared between groups using the non-parameter Mann Whitney U-test. Simple frequency and percentages were used in the descriptive analysis. The Chi-square test and Fisher exact test were used to compare proportions. All analyses were two-sided, with P< 0.05 considered to be significant. Univariate and multivariate logistic regression analyses were used for correlation analysis to determine the effects of the independent variables with dependent variable using odds ratio (OR) and 95% confidence intervals (CIs). Factors with P < 0.1 in univariate analysis and clinically recognized risk factors were included in multivariate analysis. SPSS23.0 was used to analyze the data.
Results
Baseline Clinical Characteristics
In the total cohort, the median age was 66 years old, and there were 1587 (76.15%) male, 1419 (68.09%) patients with hypertension, 679 (32.58%) patients with diabetes, 54 (2.59%) patients receiving emergency operation, 255 (12.24%) patients with valvular disease (ischemic mitral regurgitation without surgical intervention), 1666 (79.94%) patients underwent off-pump coronary artery bypass grafting (OPCABG), and 187 (8.97%) patients with a history of percutaneous coronary intervention (PCI). Forty-three (2.06%) deaths happened within 30 days after the operation.
In the hs-cTnT group, the median age was 65 years old, and there were 829 (76.34%) males, 689 (63.44%) patients with hypertension, 351 (32.32%) patients with diabetes, 45 (4.14%) patients receiving emergency operation, 185 (17.03%) patients with valvular disease, 888 (81.77%) patients underwent OPCABG, and 157 (14.46%) patients with history of PCI. Twenty-three (2.12%) deaths occurred within 30 days after operation. Baseline clinical characteristics of patients are shown in .
Table 1 Baseline Clinical Characteristics of Total Cohort and Subsets
Compared with the cTnT group, the hs-cTnT group had higher proportions of cerebrovascular diseases, peripheral vascular diseases, emergency operation, valvular diseases, chronic obstructive pulmonary disease (COPD), pulmonary hypertension, and previous PCI (P<0.05).
Trend of Median Value
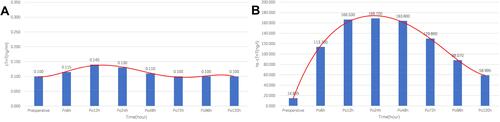
In either the cTnT group or the hs-cTnT group, the median value of cTnT changed greatly, showing a trend of increasing first and then decreasing. The change trend of the hs-cTnT group was more significant. The peak cTnT appeared at 12 hours after operation in most patients of the cTnT group (0.14 ng/mL), but at 24 hours after operation in the hs-cTnT group (168.7 ng/l) ().
Figure 2 Median values of (A) cTnT in cTnT group and (B) hs-cTnT in hs-cTnT group at different time points. Red lines: the fitted curves of the median value at each time point.
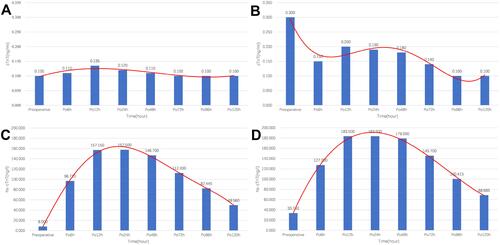
According to the definitions of PMI and cTnT types, the whole cohort was divided into four subgroups: non-PMI-cTnT, PMI-cTnT, non-PMI-hs-cTnT and PMI-hs-cTnT. The changes of cTnT/hs-cTnT in the four subgroups basically remained the same trend. However, in the PMI-cTnT subgroup, the median values of cTnT after operation were lower than those before operation ( and ).
Table 2 Baseline Clinical Characteristics of Non-PMI Group and PMI Group
Figure 3 Median values of (A) cTnT in cTnT group with preoperative cTnT in the normal range, (B) cTnT in cTnT group with preoperative cTnT in the abnormal range, (C) hs-cTnT in hs-cTnT group with preoperative hs-cTnT in the normal range, (D) hs-cTnT in hs-cTnT group with preoperative hs-cTnT in the abnormal range at different time points. Red lines: the fitted curves of the mean value at each time point.
Peak Value Distribution
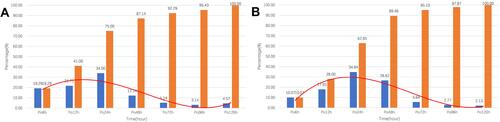
The peak cTnT after CABG was defined as the postoperative cTnT/hs-cTnT greater, for at least once, than the upper limit of normal value. The cTnT group involved 700 (700/998, 70.14%) patients with postoperative peaks, which mostly occurred in 6–24 hours (525/700, 75.00%) after operation. The hs-cTnT group involved 1082 (1082/1086, 99.63%) patients with postoperative peaks, which mostly happened 12–48 hours (859/1082, 79.4%) after operation (). The hs-cTnT group had a higher proportion of patients with postoperative peak than the cTnT group (99.63% vs 70.14%). The peak distributions of the two groups were roughly the same, but the occurring time of most postoperative peak in the hs-cTnT group was later than that in the cTnT group.
Figure 4 Peak value distributions at different time points in (A) cTnT group and (B) hs-cTnT group. Blue bars: percentage of total number of peak occurrences at the time points. Orange bars: cumulative percentage. Red lines: fitted curves of percentage at each time point.
Logistic Regression Analysis
Univariate logistic analysis showed that body weight, New York Heart Association (NYHA) classification, CAD classification, cerebrovascular diseases, left ventricular ejection fraction (LVEF), number of diseased vessels, valvular disease, intra-aortic balloon pump (IABP) implantation, COPD, pulmonary hypertension, previous PCI, bypass graft number, cardiopulmonary bypass, and preoperative cTnT were risk factors of PMI ().
Table 3 Risk Factors of PMI by Univariate Logistic Regression Analysis
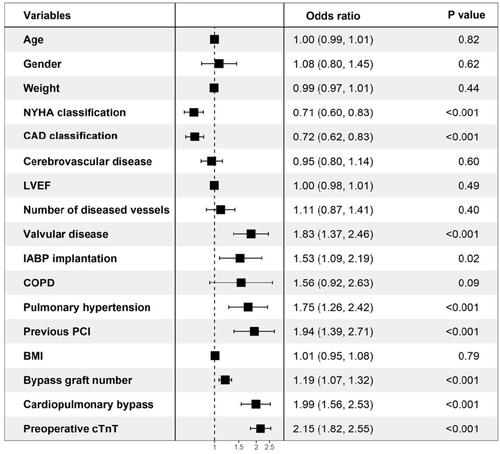
Multivariate logistic regression analysis showed that NYHA classification, CAD classification, valvular disease, IABP implantation, pulmonary hypertension, previous PCI, bypass graft number, cardiopulmonary bypass, and preoperative cTnT were independent risk factors of PMI ().
Figure 5 The forest map of the multivariate logistic regression analysis.
Discussion
For the majority of patients, the release of cTnT after operation had a similar process of rising sharply first and then falling slowly. The range of changes in the hs-cTnT group was more dramatic, and the peak concentration time was relatively delayed compared with the cTnT group. NYHA classification, CAD classification, valvular disease, IABP implantation, pulmonary hypertension, previous PCI, bypass graft number, cardiopulmonary bypass, and preoperative cTnT were independent risk factors of PMI, which are of great clinical significance for preoperative evaluation.
Clinically, determination of cardiac troponin is regarded as the biochemical gold standard for diagnosis and classification of myocardial injury.Citation14 Both cTnT and cardiac troponin I (cTnI) have excellent sensitivity and specificity as indicators of myocardial necrosis. Concentrations of both begin to rise in the 4–8 hours following injury and peak at 12–24 hours. cTnT may remain rising for more than two weeks and cTnI for more than 5–7 days.Citation15 cTnT seemingly has higher sensitivity and specificity than cTnI.Citation16,Citation17 Due to surgical injury, ischemia and other reasons, patients undergoing CABG are more likely to experience elevated troponin levels after operation.Citation18,Citation19 Especially after cardiopulmonary bypass, reversible or irreversible cell damage may occur due to incomplete cardioprotection or huge hypertrophy of diffuse CAD and inevitable surgical trauma. Therefore, the postoperative release of cardiac troponin is more complicated. Troponin can be used as an independent predictor of short- and long-term prognosis.Citation20–Citation22 Compared to other myocardial injury markers, such as CK-MB, cTnT was a better predictor.Citation23 Especially when cTnT and risk evaluation system were used in combination, the predictive performance of all-cause mortality after CABG was better than risk evaluation system alone.Citation24,Citation25 Hu et al founded that the peak values and peak phases of postoperative cTnT were both risk factors for mid-term prognosis of OPCABG patients.Citation26 Study on troponin release profiles is still of great clinical significance.
Experimental studies show that myocardial injury markers have a short half-life in the 90-minute cycle, and in the case of cTnT, the increase in concentration 48–72 hours after the injury is caused by the disintegration of the contraction mechanism, which only functions in irreversible cells.Citation14,Citation27 Highly sensitive assays for hs-cTnT can detect troponin 10 times lower than the standard assays. For cTnT and hs-cTnT, only the measurement method and detection limit are different. In both the cTnT group and the hs-cTnT group of our study, the median value of cTnT changed greatly in a trend of increasing first and then decreasing, and the peaks almost fell within 72 hours. In the hs-cTnT group, the cTnT content changed more drastically, and its peak appeared later. Preoperative cTnT concentration seemingly had no much effect on this trend. This may be related to the different detection method of hs-cTnT, which is more sensitive and has a higher detection limit.Citation28,Citation29 These differences allow a higher cTnT content to be described. More importantly, the absolute value of cTnT/ hs-cTnT after operation was not the most important for predictive performance of all-cause mortality after CABG, but the degree of change in the value of cTnT/ hs-cTnT.Citation30
In the statistics of postoperative peaks in the two groups, the hs-cTnT group had a higher proportion of peaks (99.63% vs 70.14%). In addition to the high sensitivity and detection limit, it may be partly due to the higher proportions of valvular disease (17.03% vs 7.01%, P=0.04), pulmonary hypertension (15.75% vs 2.30%, P<0.001), and previous PCI (14.46% vs 3.01%, P<0.001) in the hs-cTnT group.Citation31 All the above factors were independent risk factors for PMI.
Univariate logistic analysis showed that hypertension, diabetes, emergency operation, and renal failure were not related factors. cTnT is believed to be mainly metabolized by the kidney. For patients with renal failure, the circulating cTnT can hardly be metabolized by the kidney, which should be manifested as a significant increase in cTnT content. Our results are different from previous studies, which may be explained by the exclusion of hemodialysis and the small number of patients with chronic renal failure. However, its relevance still needs further exploration.
As reported, elderly male patients have relatively high levels of cTnT, and different normal range standards should be set.Citation32 Therefore, age, gender, and meaningful factors in univariate logistic analysis were incorporated into multivariate logistic regression. Results showed that age and gender were still not independent risk factors of PMI.
Contrary to the common sense, patients with low-level versus high-level NYHA classification are more likely to have PMI, and patients with stable angina pectoris are more likely to have PMI than patients with acute myocardial infarction (AMI). There were 260, 1334, 445 and 45 patients in different levels of NYHA classification. Patients with the low-level versus high-level NYHA classification had higher preoperative cTnT level and higher proportions of cardiopulmonary bypass and renal failure. These factors were shown to cause an increase in cTnT after CABG. Similarly, compared with AMI patients, the patients with stable angina had more bypass grafts and higher proportions of valvular disease and pulmonary hypertension.Citation33 All these factors were found to be independent risk factors of PMI in this study. That may be part of the reason.
Limitations
There are some limitations. First, this is a retrospective observational study conducted at two medical centers, and inevitable differences between surgical technique postoperative cares may bias the results. Secondly, some patients recovered smoothly after the operation and were discharged within 5 days after the operation, which also led to the loss of cTnT/hs-cTnT in these patients within 120 hours after surgery. Third, the suspicious risk factors collected were still not enough, and there may be other independent influencing factors.
Conclusions
Generally, the release of troponin after operation increases first and then slowly decreases. For the hs-cTnT, the peak value usually occurs 12–48 hours after operation. Exploring PMI monitoring is of great significance. NYHA classification, CAD classification, valvular disease, IABP implantation, pulmonary hypertension, previous PCI, bypass graft number, cardiopulmonary bypass, and preoperative cTnT are independent risk factors of PMI.
Data Sharing Statement
If readers need complete original data, they can contact the corresponding author to obtain it.
Note: E-mail for correspondence: Yangyang Zhang, PhD, MD, E-mail: [email protected].
Ethics Approval and Consent to Participate
This study was approved by the Ethics Committee of Shanghai East Hospital and registered with the number of ChiCTR2100044847 (http://www.chictr.org.cn/). This study was conducted in accordance with the Declaration of Helsinki. All patients included in the study, or their legal representatives, signed written informed consents to participate in the study.
Disclosure
The authors declare that they have no competing interests.
Additional information
Funding
References
- Lim CC, Cuculi F, van Gaal WJ, et al. Early diagnosis of perioperative myocardial infarction after coronary bypass grafting: a study using biomarkers and cardiac magnetic resonance imaging. Ann Thorac Surg. 2011;92(6):2046–2053. doi:10.1016/j.athoracsur.2011.05.019
- Kocak EF, Kocak C, Aksoy A, et al. High-sensitivity cardiac troponin T is more helpful in detecting peri-operative myocardial injury and apoptosis during coronary artery bypass graft surgery. Cardiovasc J Afr. 2015;26(6):234–241. doi:10.5830/CVJA-2015-052
- Zhou P, Zhu P, Xiao Z, Lin X, Xu R, Zheng S. Meta-analysis of repeat revascularization of off-pump and on-pump coronary artery bypass surgery. Ann Thorac Surg. 2018;106(2):526–531. doi:10.1016/j.athoracsur.2018.02.068
- Moon MH, Song H, Wang YP, Jo KH, Kim CK, Cho KD. Changes of cardiac troponin I and operative mortality of coronary artery bypass. Asian Cardiovasc Thorac Ann. 2014;22(1):40–45. doi:10.1177/0218492312468439
- Sandoval Y, Thygesen K. Myocardial infarction type 2 and myocardial injury. Clin Chem. 2017;63(1):101–107. doi:10.1373/clinchem.2016.255521
- Chapman AR, Adamson PD, Shah A, et al. High-sensitivity cardiac troponin and the universal definition of myocardial infarction. Circulation. 2020;141(3):161–171. doi:10.1161/CIRCULATIONAHA.119.042960
- Jiang Z, Hu P, Liu J, Wang D, Jin L, Hong C. Screening preoperative peptide biomarkers for predicting postoperative myocardial infarction after coronary artery bypass grafting. PLoS One. 2014;9(6):e100149. doi:10.1371/journal.pone.0100149
- McCarthy CP, Raber I, Chapman AR, et al. Myocardial injury in the era of high-sensitivity cardiac troponin assays: a practical approach for clinicians. JAMA Cardiol. 2019;4(10):1034–1042. doi:10.1001/jamacardio.2019.2724
- Iddagoda MT. The role of high-sensitive troponin measurement as a biomarker during the postoperative period for the detection of myocardial injury after non-cardiac surgery. J Perioper Pract. 2020;1750458920930993. doi:10.1177/1750458920930993
- Apple FS, Sandoval Y, Jaffe AS, Ordonez-Llanos J. Cardiac troponin assays: guide to understanding analytical characteristics and their impact on clinical care. Clin Chem. 2017;63(1):73–81. doi:10.1373/clinchem.2016.255109
- Kavsak PA, Pardhan A, Krizmanich W, Worster A. Hospital admission and myocardial injury prevalence after the clinical introduction of a high-sensitivity cardiac troponin I assay. Clin Chem. 2015;61(9):1209–1210. doi:10.1373/clinchem.2015.243345
- Mullins KE, Christenson RH. Optimal detection of acute myocardial injury and infarction with cardiac troponin: beyond the 99th percentile, into the high-sensitivity era. Curr Cardiol Rep. 2020;22(9):101. doi:10.1007/s11886-020-01350-w
- Thygesen K, Alpert JS, Jaffe ASet al. Fourth universal definition of myocardial infarction (2018). Rev Esp Cardiol. 2019;72(1):72.
- Omland T. New sensitive cardiac troponin assays for the early diagnosis of myocardial infarction. Drugs Today. 2011;47(4):303–312. doi:10.1358/dot.2011.47.4.1533082
- Maynard SJ, Menown IB, Adgey AA. Troponin T or troponin I as cardiac markers in ischaemic heart disease. Heart. 2000;83(4):371–373. doi:10.1136/heart.83.4.371
- Hetland O, Dickstein K. Cardiac troponins I and T in patients with suspected acute coronary syndrome: a comparative study in a routine setting. Clin Chem. 1998;44(7):1430–1436. doi:10.1093/clinchem/44.7.1430
- Zimmerman J, Fromm R, Meyer D, et al. Diagnostic marker cooperative study for the diagnosis of myocardial infarction. Circulation. 1999;99(13):1671–1677. doi:10.1161/01.CIR.99.13.1671
- Hammarsten O, Mair J, Möckel M, Lindahl B, Jaffe AS. Possible mechanisms behind cardiac troponin elevations. Biomarkers. 2018;23(8):725–734. doi:10.1080/1354750X.2018.1490969
- Mair J, Lindahl B, Hammarsten O, et al. How is cardiac troponin released from injured myocardium. Eur Heart J Acute Cardiovasc Care. 2018;7(6):553–560. doi:10.1177/2048872617748553
- Filizcan U, Kurc E, Cetemen S, et al. Mortality predictors in ST-elevated myocardial infarction patients undergoing coronary artery bypass grafting. Angiology. 2011;62(1):68–73. doi:10.1177/0003319710369103
- Garg P, Morris P, Fazlanie AL, et al. Cardiac biomarkers of acute coronary syndrome: from history to high-sensitivity cardiac troponin. Intern Emerg Med. 2017;12(2):147–155. doi:10.1007/s11739-017-1612-1
- Paparella D, Scrascia G, Paramythiotis A, et al. Preoperative cardiac troponin I to assess midterm risks of coronary bypass grafting operations in patients with recent myocardial infarction. Ann Thorac Surg. 2010;89(3):696–702. doi:10.1016/j.athoracsur.2009.11.072
- Søraas CL, Friis C, Engebretsen KV, Sandvik L, Kjeldsen SE, Tønnessen T. Troponin T is a better predictor than creatine kinase-MB of long-term mortality after coronary artery bypass graft surgery. Am Heart J. 2012;164(5):779–785. doi:10.1016/j.ahj.2012.05.027
- Lurati Buse GA, Koller MT, Grapow M, et al. 12-month outcome after cardiac surgery: prediction by troponin T in combination with the European system for cardiac operative risk evaluation. Ann Thorac Surg. 2009;88(6):1806–1812. doi:10.1016/j.athoracsur.2009.07.080
- Fellahi JL, Le Manach Y, Daccache G, Riou B, Gérard JL, Hanouz JL. Combination of EuroSCORE and cardiac troponin I improves the prediction of adverse outcome after cardiac surgery. Anesthesiology. 2011;114(2):330–339. doi:10.1097/ALN.0b013e318201662f
- Hu B, Gao F, Lv M, et al. Effects of peak time of myocardial injury biomarkers on mid-term outcomes of patients undergoing OPCABG. BMC Cardiovasc Disord. 2021;21(1):208. doi:10.1186/s12872-021-02006-5
- Mueller M, Vafaie M, Biener M, Giannitsis E, Katus HA. Cardiac troponin T: from diagnosis of myocardial infarction to cardiovascular risk prediction. Circ J. 2013;77(7):1653–1661. doi:10.1253/circj.CJ-13-0706
- Hernández-Romero D, Vílchez JA, Lahoz Á, et al. High-sensitivity troponin T as a biomarker for the development of atrial fibrillation after cardiac surgery. Eur J Cardiothorac Surg. 2014;45(4):733–738. doi:10.1093/ejcts/ezt488
- Markman PL, Tantiongco JP, Bennetts JS, Baker RA. High-sensitivity troponin release profile after cardiac surgery. Heart Lung Circ. 2017;26(8):833–839. doi:10.1016/j.hlc.2016.09.017
- Mauermann E, Bolliger D, Fassl J, et al. Association of troponin trends and cardiac morbidity and mortality after on-pump cardiac surgery. Ann Thorac Surg. 2017;104(4):1289–1297. doi:10.1016/j.athoracsur.2017.03.003
- Bandstein N, Wikman A, Ljung R, Holzmann MJ. Survival and resource utilization in patients with chest pain evaluated with cardiac troponin T compared with high-sensitivity cardiac troponin T. Int J Cardiol. 2017;245:43–48. doi:10.1016/j.ijcard.2017.05.111
- Gahl B, Göber V, Odutayo A, et al. Prognostic value of early postoperative troponin T in patients undergoing coronary artery bypass grafting. J Am Heart Assoc. 2018;7(5):e007743. doi:10.1161/JAHA.117.007743
- Ståhle E, Bergström R, Holmberg L, Nyström SO, Hansson HE. Risk factors for operative mortality and morbidity in patients undergoing coronary artery bypass surgery for stable angina pectoris. Eur Heart J. 1991;12(2):162–168. doi:10.1093/oxfordjournals.eurheartj.a059863